
The graph below provides a clearer understanding of the US fiscal deficit. First, focus on the red line below, graphing the ratio of federal debt to GDP. Note that it is at the same level today as it was in 2021. Similarly, before the pandemic, it had been relatively flat for seven years. This highlights that the deficit problem we have today was exacerbated by recession-prompted fiscal stimulus and the temporary decline in GDP.
To illustrate this more clearly, we created the green line. This version of the debt-to-GDP ratio assumes zero change in the ratio during recessions. Moreover, it uses the same growth rates as the all-inclusive debt-to-GDP ratio to calculate the growth for periods outside of recession. As the green line indicates, the ratio today is the same as it was over 10 years ago. Furthermore, it is close to levels seen in the mid-1990s. The takeaway from comparing the two lines is that the ratio of debt to GDP follows a stairstep pattern. It’s generally flat during periods of growth, while it accelerates during recessions.
The point in playing with the data is not to belittle the deficit problem. Instead, we think it’s essential to acknowledge that the deficit problem is primarily associated with recessionary stimulus. Thus, maybe we should consider how we spend stimulus funds during recessions. In particular, might a focus toward productive stimulus during recessions provide a greater long term economic boost?
Still, if there is no recession in the near future, we might find that today’s deficits are not significantly worsening as some pundits lead us to believe. Might they be too focused on the deficit amount stated in dollars, rather than as a ratio to our ability to pay for it, i.e., economic growth?

What To Watch Today
Earnings
- No earnings releases today
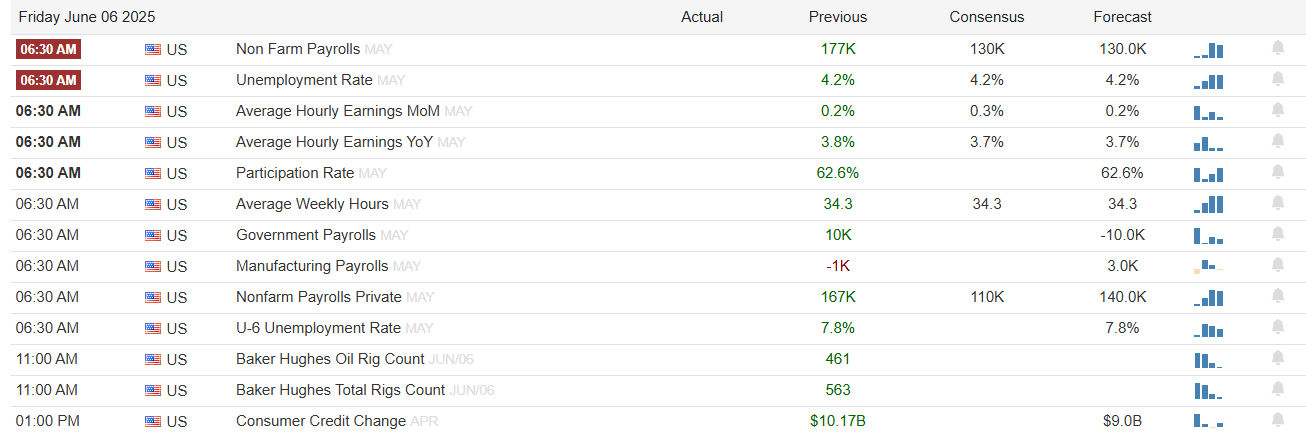
Economy
Market Trading Update
In yesterday’s commentary, we examined the weekly market indicators, which have now turned positive, signaling an end to the previous correction. With the correction over, however, that doesn’t mean that markets won’t pause in their advance, but with yesterday’s breakout above the 2-week consolidation, the next resistance levels are at all-time highs. For the “bears,” this defies the arguments of tariffs, the debt, deficit, and potential recession. However, as we have noted previously, markets tend to be forward-looking, and earnings estimates are back on the rise, particularly for the Mag 7.

More notably, momentum, as measured by the NYSE Advance-Decline line and the number of stocks above their respective 50 and 200 DMAs, has bottomed and turned higher. This is typically the case when markets set correction lows.
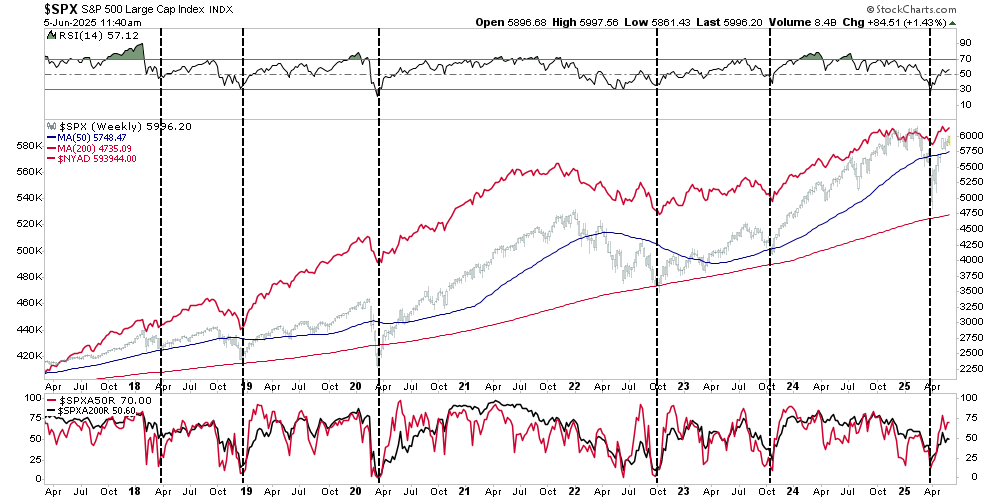
Crucially, for investors, the path of least resistance currently is to new all-time highs, and I would not be surprised to see traders push the market to those levels in the next few days. However, there is still reasonable evidence to expect short-term market corrections that reduce the current overbought market conditions. Such pullbacks should be bought for now. Such is particularly the case with money flows remaining strongly positive as investors bid stock prices higher as tariffs concerns ease.

As is always the case, the market can often operate in vastly different ways than what the “narrative” of the day suggests. Avoid getting trapped in headlines, and focus on what matters most when investing.

Inflation Data Is More Suspect Than Usual
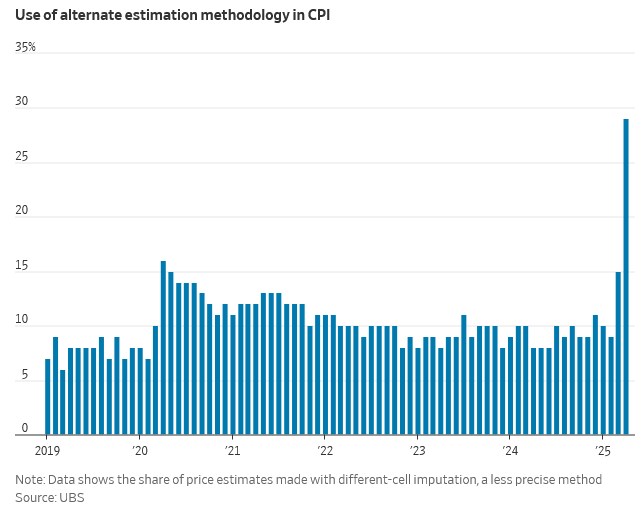
The BLS CPI data has always been problematic. The simple fact is that assigning a number to characterize one inflation number for everyone is impossible. We are now finding out from the Wall Street Journal that the data is now even more suspect. Their article, Economists Raise Questions About Quality Of US Inflation Data, discusses how a BLS hiring freeze and budget cuts are forcing the BLS to rely more on estimates than it has in the past. The graph below shows the massive jump in the use of “alternate estimation” methodologies that occurred in the last month’s CPI report.
Per the article:
The BLS said Wednesday that in April it stopped collecting consumer-inflation data in Lincoln, Neb., and Provo, Utah. It also said that it stopped collecting data in Buffalo, N.Y., in June. The BLS said the changes will have “minimal impact on the overall inflation rate,” but might increase volatility for the price data on specific goods and in specific regions.
“BLS makes reductions when current resources can no longer support the collection effort,” the agency said.
While the BLS believes the impact is “minimal,” relying on guesstimates and smaller sample sizes is asking for volatility in the numbers. Moreover, there is little way to know to what degree the estimates are impacting the data. Furthermore, “Detmeister said it is impossible to tell whether the reliance on different-cell estimates skewed the data in one direction or the other.”
Comprehensive Financial Planning
For affluent families, financial success isn’t solely about accumulating wealth; it’s about preserving it across generations, optimizing tax strategies, and aligning financial decisions with personal values and long-term goals. Comprehensive financial planning offers a holistic approach, integrating various financial aspects to provide clarity, control, and confidence in one’s financial journey.

Tweet of the Day
“Want to achieve better long-term success in managing your portfolio? Here are our 15-trading rules for managing market risks.”
Please subscribe to the daily commentary to receive these updates every morning before the opening bell.
If you found this blog useful, please send it to someone else, share it on social media, or contact us to set up a meeting.

