
The BEA reported that real GDP grew by 3.0% in the second quarter. Such is almost a percent better than the longer run trend growth rate, and is a cause for optimism for some. However, first quarter GDP was -0.5%, well below trend growth, and worthy of pessimism. The problem with being optimistic about the second quarter or pessimistic about the first quarter is that the threat of tariffs and actual tariffs abnormally impacted the data. Let’s explain.
The formula for GDP is C+I+G+(X-M), where C is Personal Consumption, I is Investment (inventories and fixed investments), G is Government Spending, and X-M is Net Exports (exports minus imports). The graph below breaks down the GDP by those four contributors. Typically, net exports are a negative number as our nation often runs a trade deficit.
With that, let’s look at how tariffs significantly impacted net exports (X-M). In the first quarter, net exports reduced GDP by 4.64%. Conversely, net exports added 4.99% in the second quarter. In the first quarter, demand from consumers and companies to buy products or inventory before tariffs were enacted was much greater than usual. Thus, there was a sharp decline in net exports. Having extra inventory or having already purchased goods, consumers and companies had fewer demands for those imports in the second quarter. The net impact of the tariffs over the two quarters is near zero. But the lopsided nature of the data is misleading. Sans imports and exports, the real GDP growth over the first half of the year is approximately 1.25%. Not recessionary, but below trend growth.

What To Watch Today
Earnings

Economy

Market Trading Update
Yesterday, we discussed that the market had its third-best performance in 1928. As noted, the market has not had a +/-1% move in quite a long stretch. While stretches have previously been longer, a consideration of such an event is that low volatility tends to beget high volatility. These “buying stampedes” typically last on average about 15 trading days, so at 25 and counting, we are certainly pushing a more extended duration.

Yesterday also marked the end of July, which marks the beginning of two of the year’s historically weaker trading months. As noted earlier this week, volatility tends to increase in August and September, leading to historically lower average returns.

While all of this is historical data, none guarantees that the market will correct over the next two months. It only suggests that the probability of some corrective action is increasing. As such, we recommend that risk management become increasingly important.
With the weekly “buy signal” firmly intact after a significant reversal in April, the bull market remains in process with little ahead to deter its advance. However, relative strength is approaching increasingly overbought levels, suggesting upside may be somewhat limited without a correction phase to relieve some of that condition. As shown, a 23.6% retracement would correspond with a test of the 13-week moving average. Such a retracement is entirely normal and should be expected. However, we shouldn’t rule out a 38.2% retracement to the 34-week moving average, which should continue to act as running support for the bull market.
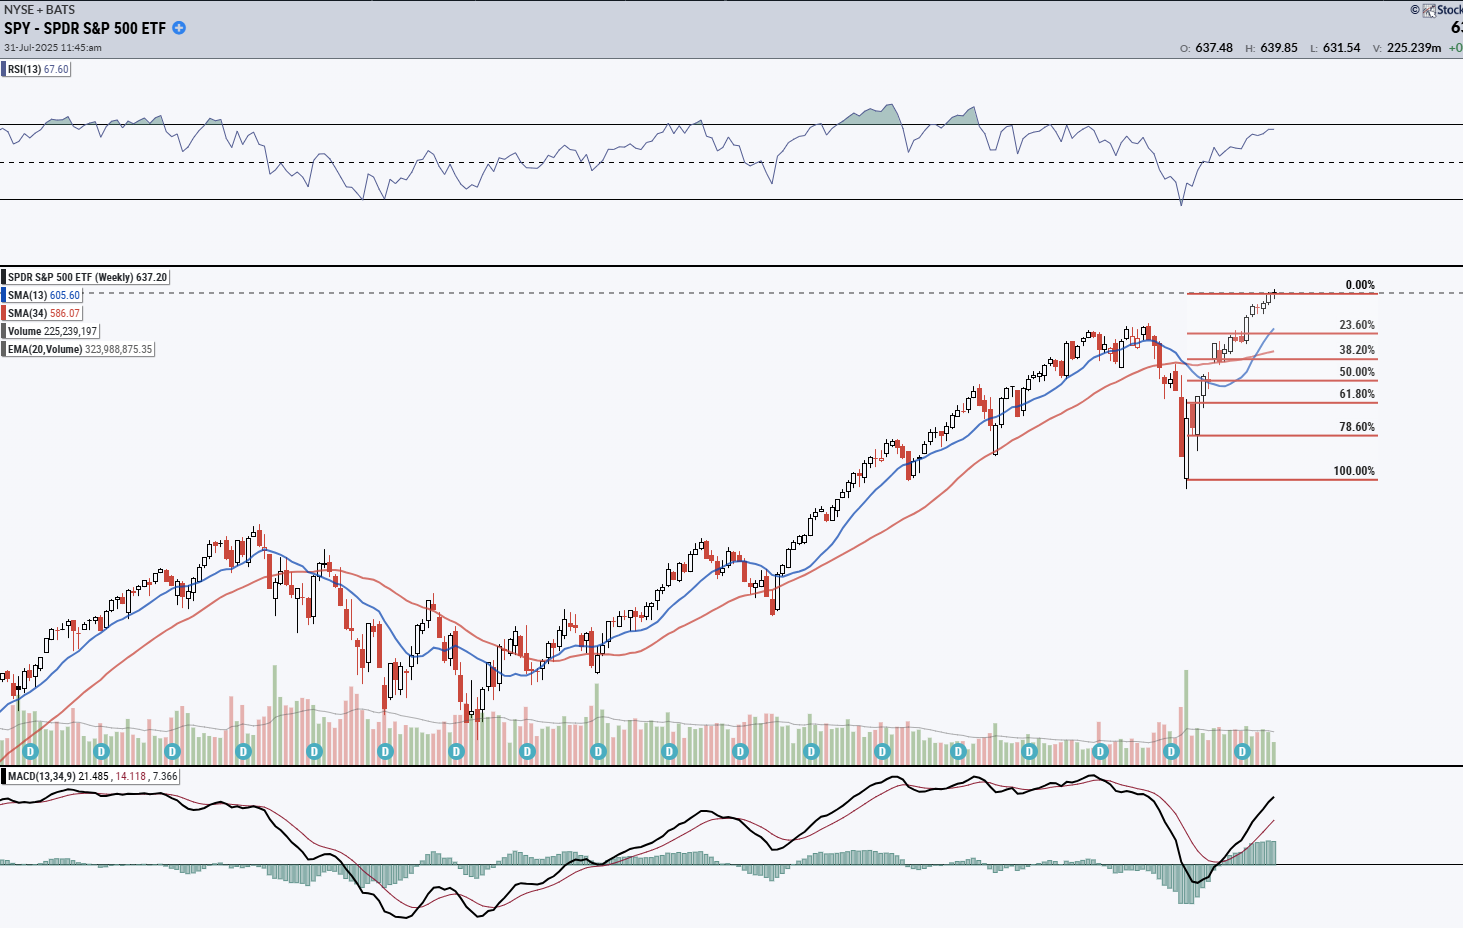
While the overall backdrop remains bullish, including stable economic growth and earnings, it is worth considering that markets don’t usually rise in a near-vertical line. It certainly happens historically, but they always eventually end, just when most begin to expect they won’t.
Trade accordingly.

Microsoft Cloud Revenue Soars
Microsoft added $4.3 billion in new cloud revenue this quarter. That’s more than double any other quarter in Microsoft’s history. Microsoft, led by its massive investments in the cloud and data centers, is booming. The following is a summary of Wednesday’s earnings report:
- Revenue at $76.4 billion beat expectations by $2.5 billion, and earnings at $3.65 were 10% higher than expectations. Equally important, the company increased its revenue guidance primarily due to better-than-forecasted cloud revenue growth.
- Capital expenditures were up 27% over the year to a whopping $24 billion in the last quarter. They expect that to grow to $30 billion this quarter. While that will weigh on earnings, it also enables Microsoft to make significant investments in driving future revenue.
The following quote from the CEO highlights its commitment to being a leading force in the cloud and AI industry:
There’s a lot of talk in the industry about building the first gigawatt and multi-gigawatt data centers. We stood up more than two gigawatts of new capacity over the past twelve months alone, and we continue to scale our own data centers faster than any other competitor.
MSFT rose nearly 10% on the news, boosting its market cap by approximately $400 billion. For context, Costco and J&J each have a market cap of roughly $400 billion!

Do PCE Prices Justify Powell’s Pause?
The Fed’s preferred inflation gauge, PCE prices, rose 0.3% on a headline and core basis. While the expectation was for a gain of 0.3%, the actual core number was +0.26%, rounded up to 0.3%. Thus, the data was a hair better than expected. However, as shown below, the 3-month annualized growth rose to 2.6%. That compares to 2.3% last year. The graph shows that inflation is leveling off and not necessarily declining. Tariffs and tariff-related pricing behaviors by companies are having a slight impact. However, it is likely to be short-lived and minimal.
The bond market reaction was not concerning. The yield curve flattened a little on the news as longer-end yields fell slightly and short-term yields were flat to slightly higher. The data, without any other considerations, argue that the Fed may not cut at the September meeting and continue to wait to see what the inflationary impact of tariffs will be. That said, there will be two employment reports and two CPI reports before that meeting.

Tweet of the Day

“Want to achieve better long-term success in managing your portfolio? Here are our 15-trading rules for managing market risks.”
Please subscribe to the daily commentary to receive these updates every morning before the opening bell.
If you found this blog useful, please send it to someone else, share it on social media, or contact us to set up a meeting.

