
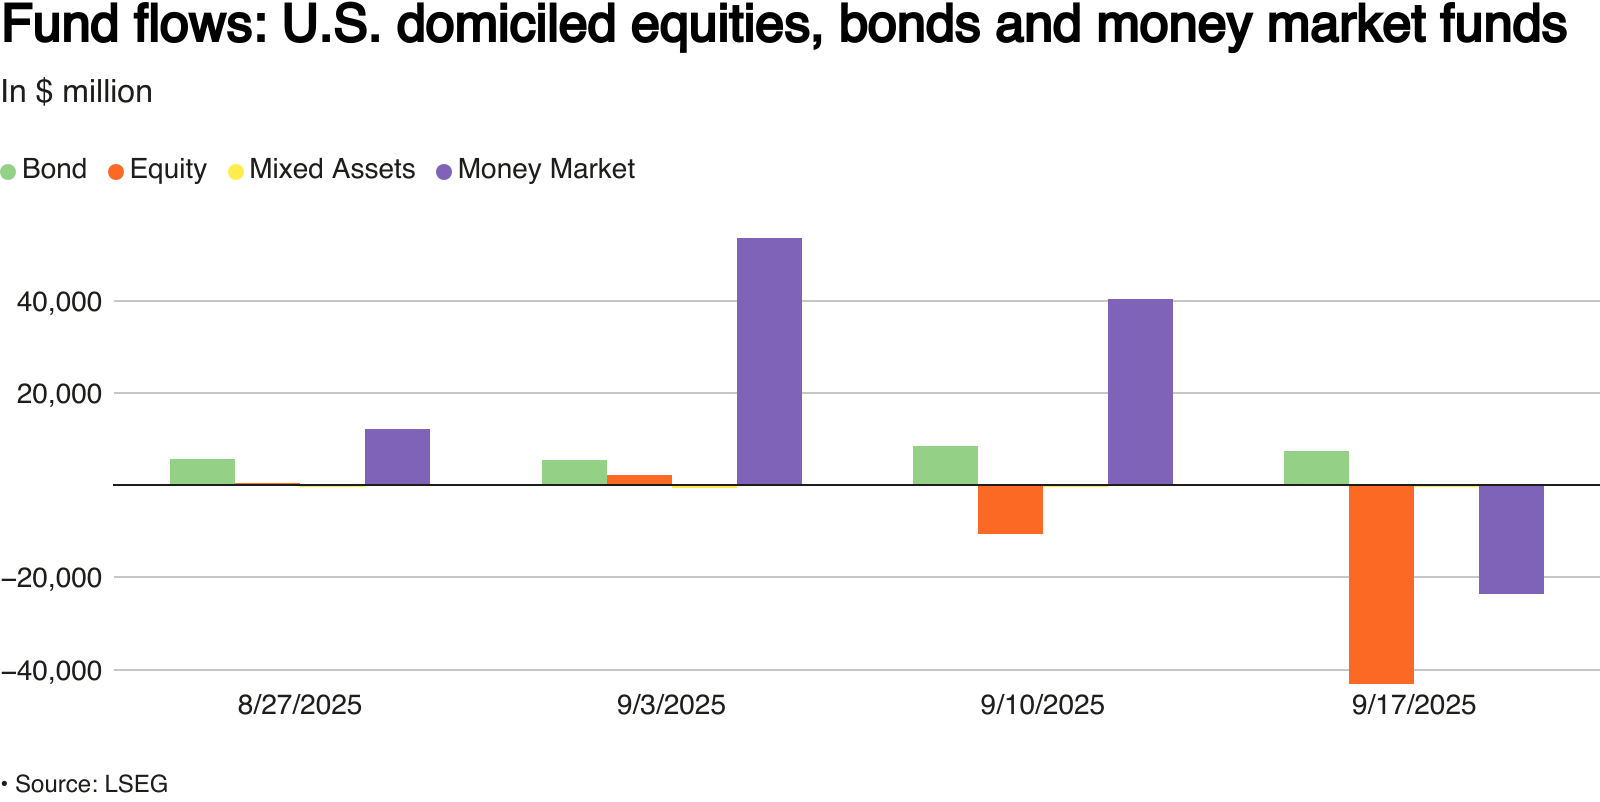
Our friend Jim Colquitt, in his Weekly Chart Review, brought to our attention a large and irregular outflow from equity funds last week. He cites a Reuters article stating that investors withdrew $43 billion from US equity funds last week. That was the largest outflow since December 2024. The graph below shows that equity fund flows were flat to slightly negative over the prior three weeks before last week’s large outflow.
Jim sums up the dilemma of this information well:
The article would suggest that investors are moving out of risk assets and towards safer assets (i.e., bonds).
Is this part of a bigger plan to de-risk, or is this just the normal course of business as we get towards quarter-end? Honest answer, I don’t know the answer.
Fund outflows are important to consider, given the increasingly dominant role that passive investing has on the market. To wit, equity fund flows generally increase week to week as new 401k money gets invested into equity funds. This steady increase has been a source of growth for the markets. While it has been dependable, there is a school of thought that thinks it will reverse due to demographics. Simply, as the baby boomers age, they will become more dependent on their retirement savings and be forced to withdraw funds. Given the size of the baby boomer cohort versus younger generations, a persistent outflow from passive funds could become the norm.
A week or two of negative flows is meaningless. For now, we will deem the equity fund outflow last week as a blip versus a warning. However, if equity fund flows continually trend negatively, that represents a change in market dynamics worth paying attention to.
What To Watch Today
Earnings

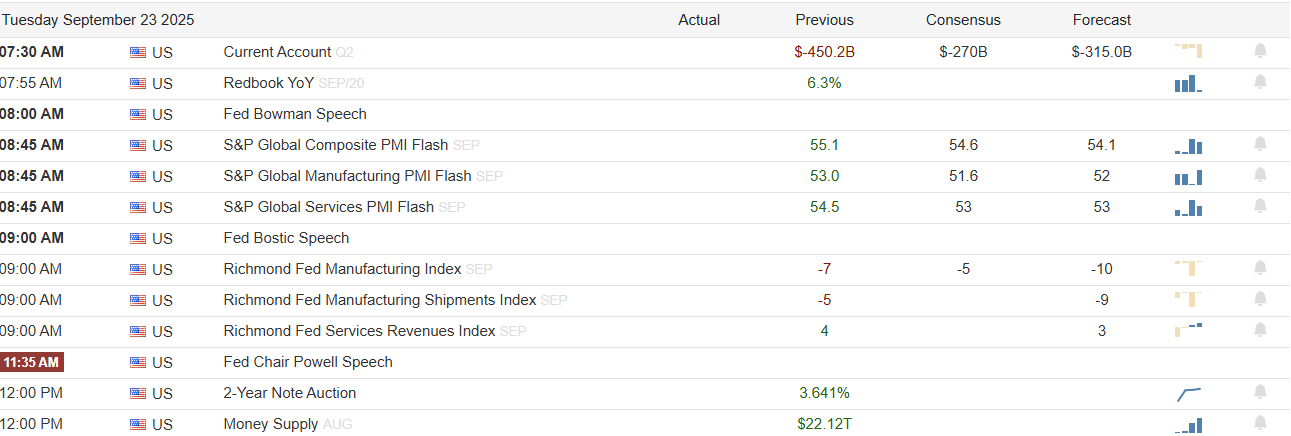
Economy
Market Trading Update
Yesterday, we detailed the technical backdrop to the market. In the linked article below, we examine the bullish and bearish cases for the market. While there are certainly some “teeth” to the bear case for equities, the current momentum and retail excitement for stocks continue to drive markets higher. Per TheMarketEar yesterday:
“MS QDS characterizes retail buying as ‘incredibly strong’ – with demand running at ~$4bn/day in August and September, ~4x the normal pace for this time of year + outsized in single names (99th %tile vs. 2016). The chart shows a basket of US stocks “that are most popularly mentioned on retail communities”. This comes and goes in waves and it would be surprising to see retail take a pause.”

As is always the case, momentum is a very hard thing to stop, but critically, it always does. It is just the timing of the event that is most important. To this point, Spencer Jakab wrote an excellent piece in the WSJ yesterday, noting the timing of bear market returns. To wit:
“‘’Im the crash guy—I remain the crash guy,’ says Mark Spitznagel, who earned $1 billion in a single day for his clients during 2015’s ‘Flash Crash.’ His hedge fund, Universa Investments, also scored major gains when Lehman collapsed and when Covid-19 sparked a meltdown. The alarming part of Spitznagel’s outlook is that he sees current conditions akin to 1929, the year of the Wall Street crash. The silver lining is that he thinks this is more like the early part of 1929 when stocks added to their roaring twenties gains.
How excited—or worried—should ordinary investors be? Understand that Spitznagel wasn’t reading the tea leaves and predicting the timing of those earlier stock swoons. Even the smartest trader couldn’t know a pandemic or a trading glitch was coming. Universa buys tail-risk derivatives that pay off hugely if a downturn is particularly sharp. Market timing is notoriously difficult. In July 2024, Spitznagel sounded a similar tune, predicting “something really, really bad,” but with a last hurrah for stocks first. The S&P has gained 23% since then.“
Timing is always key. However, as Spencer notes, there are indeed signs.
“Both individual and professional investors tend to increase their stock exposure before the top. Strategists at State Street noted last month that institutional investors’ exposure to equities just reached its highest since November 2007, just before a vicious bear market. Meanwhile, American households’ allocation to stocks has blown past its tech bubble peak. Two other signs that investors are throwing caution to the wind: The premium investors require to own investment-grade-rated bonds hit its lowest since 1998 on Friday and trading volume on U.S. stock exchanges was just shy of the April record during the Liberation Day panic.“
As shown, the stock market’s return just prior to the onset of the bear market tends to be well above historical averages, just as it is currently.
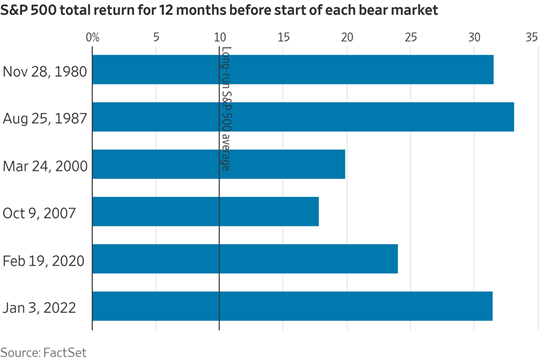
Does this mean that a bear market is about to begin? No. However, there are certainly signs of risk-building across the market spectrum.
As Spitznagel concluded:
“The markets are perverse. They exist to screw people.”

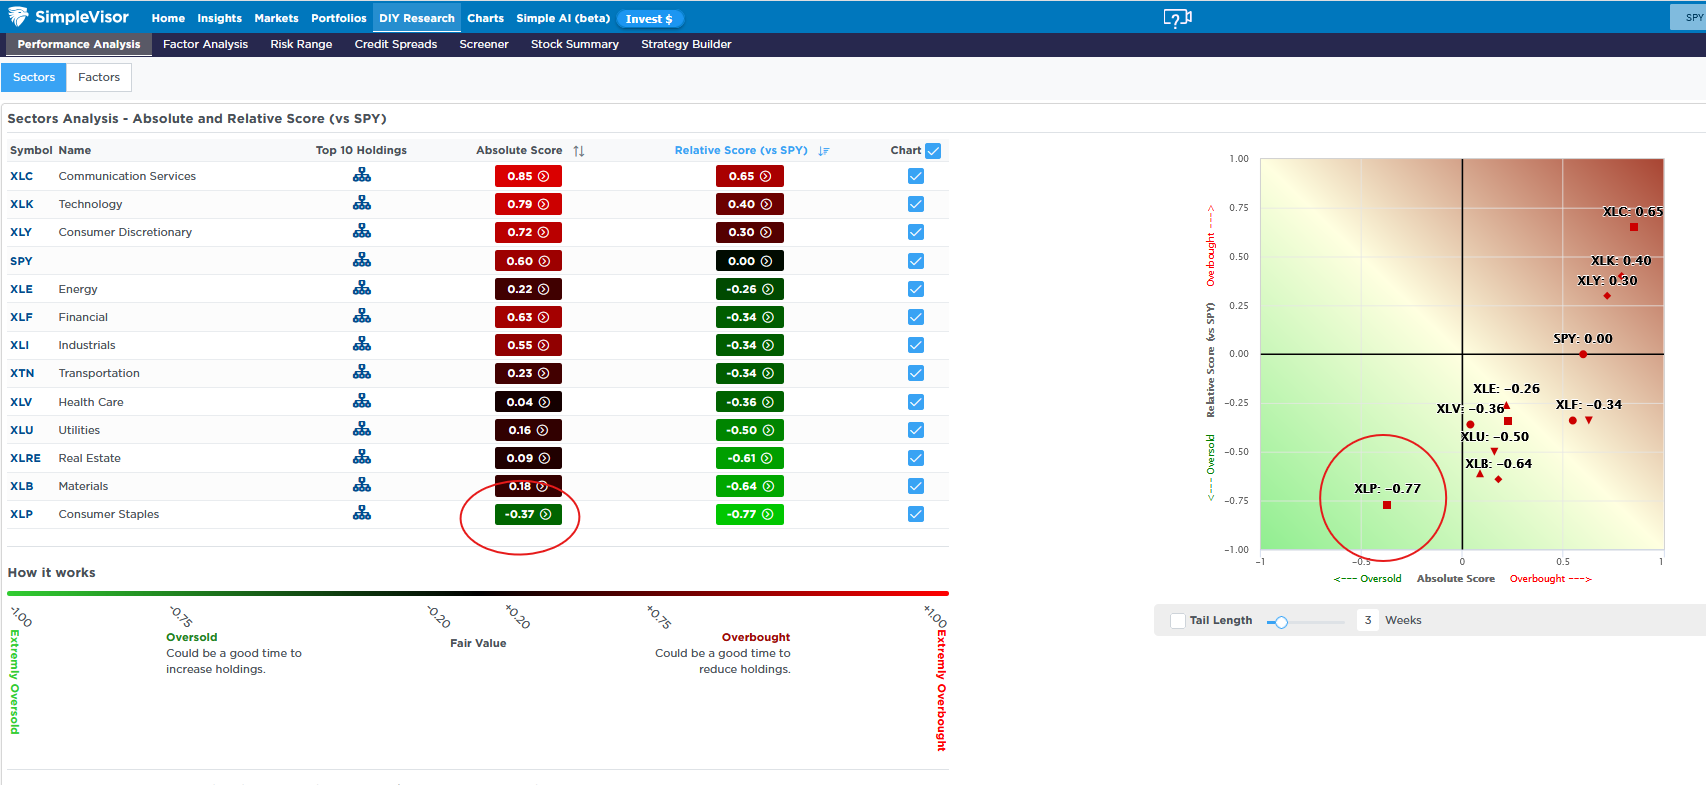
Consumer Staples Are Getting Left Behind
Over the last four weeks of trading, the Consumer Staples ETF, XLP, has declined by over 8%. That compares to the S&P 500, which is up nearly 3% and its two leading sectors, communications (+4.5%) and technology (+3.5%). Utilities, healthcare, and real estate are also significantly lagging the market over the 20-trading period, indicating that investors are shunning conservative stocks in favor of market leaders.
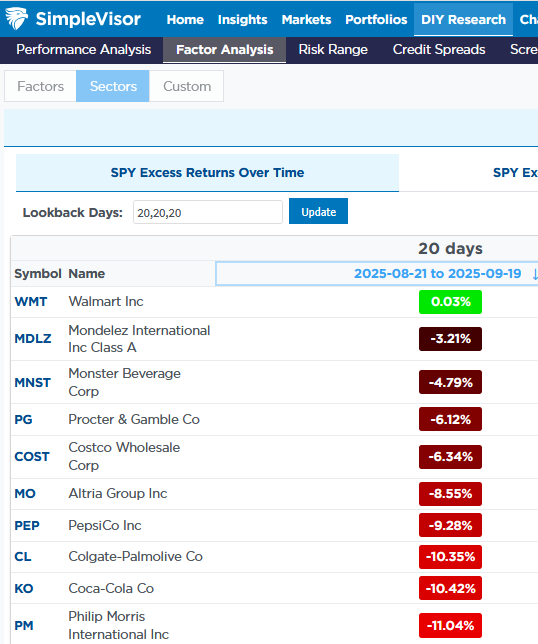
The first graphic, courtesy of SimpleVisor, shows that Walmart is the only top ten consumer staple stock that has risen over the last 20 days. And that is by a mere 0.03%! Moreover, three well-known companies —Philip Morris, Coca-Cola, and Colgate-Palmolive — are down by over 10%. The second graphic, also from SimpleVisor, shows that staples are the only sector with a negative absolute score. Additionally, at -.77, it has a very oversold relative score. The graph on the right shows that the staples sector is more oversold than the other conservative sectors, and is positioned at the opposite end of grid as the high-flying technology and communications sectors. Timing is tough, but we should expect a rotation from overbought sectors to staples and some of the other oversold sectors. This is likely to occur during a market correction.
Markets: Bullish Vs. Bearish Case
To understand where the market might go, you need to weigh both the bull case and bear case in light of what is actually priced and what risks remain unacknowledged. As noted, Scott argues that systematic flows and positioning may be nearer tipping points than many think. The data support the bull momentum case, but many components are already baked into current prices.
Some numbers to anchor where we are:
- The forward P/E of the S&P 500 is around 22‑23x. That’s near the top percentile from a long‑term historical view. UBS observes it’s among the top 5% readings since 1985.
- PMI (purchasing managers index) data still shows growth, especially in the manufacturing and tech sectors. However, there are signs of softness creeping into services.
- Earnings reports remain strong in major large caps (especially tech and AI‑exposed firms), but mid‑ and small‑caps have underperformed, with many earnings estimates getting revised downward.
So here’s the general overview:
- The bull case leans heavily on rate cuts, earnings growth (especially in AI/tech), global liquidity, and strong flow dynamics. If those hold or improve, there is room for upside.
- The bear case leans on overvaluation, deteriorating breadth (many stocks not keeping up), rising risks of macro softness (inflation rebounds, weak labor, global shocks), and the possibility that momentum—especially flow‐driven momentum—reverses sharply.
This moment is critical because many bullish assumptions are already reflected in current prices. That means the margin for error is shrinking, and any misstep, such as an inflation tick‐up, Fed caution, or earnings disappointments, could tip the balance toward a decline.
Tweet of the Day

“Want to achieve better long-term success in managing your portfolio? Here are our 15-trading rules for managing market risks.”
Please subscribe to the daily commentary to receive these updates every morning before the opening bell.
If you found this blog useful, please send it to someone else, share it on social media, or contact us to set up a meeting.

