
A reader of our Daily Commentary asked how we measure corporate credit spreads in light of the Moody’s downgrade of the USA credit rating. Specifically, “Without having a AAA benchmark to calculate the credit spread of corporate bonds against, what other measure can help me assessing stress in the corporate bond market.” First its important to note that two of the three major credit rating firms already had the US credit rating at AA before Moody’s downgrade. Second, regardless of the downgrade almost all investors still consider US Treasury securities as risk free. Therefore credit spreads versus Treasuries remain a viable stick to measure credit conditions for corporations.
However, if you think otherwise about the USA being risk-free there are other ways of assessing potential stress in the corporate credit market. In addition to measuring spreads to Treasuries, most corporate bond traders also focus on intra-rating spreads. For example, our graph below shows the yield spread between AA rated corporate bonds and junk-rated B corporate bonds. As it shows, the spread between B and AA widened briefly in April as the tariffs were announced. Since then the spread has reverted back toward its lows. Simply, upon assessing the credit spreads whether using US Treasuries or higher rated corporate bonds, corporate junk spreads show no stress.

What To Watch Today
Earnings

Economy

Market Trading Update
Yesterday, we stated that the market was overbought heading into last week and that a pullback was likely. We have previously noted that there was a lot of support building at the 200-DMA, where the 100 and 20-DMA had now converged. Unsurprisingly, news over the weekend that Trump was postponing tariffs on the EU sent stocks roaring higher, confirming an initial positive test of support. While the rally was indeed bullish, with buyers showing up across the entire market complex, last week’s sell-off did little to reduce the short-term overbought conditions of the market.

This afternoon, we will get earnings from Nvidia (NVDA), the last of the “Magnificent 7” stocks, signaling the end of Q1 earnings season. The options market is expecting a 7.5% swing in the share price depending on how Nvidia reports. As shown, Nvidia has a reasonably high bar to hurdle in revenue and earnings growth. However, the recent downturn in the stock market has reduced expectations somewhat. The question will be whether it was enough.

Lastly, as we move into June, we will lose support of earnings announcements and, most importantly, corporate share repurchases. As that buyer fades from the market until the end of July, the market may struggle somewhat, particularly with economic data still showing signs of weakness.
The bottom line is that we remain somewhat cautious about the market and are holding higher levels of cash despite Monday’s rally. Once we reverse the current overbought conditions to some degree we will begin adding back to equity exposure accordingly.

Industrials Are The Hot Sector
As the graphic below from SimpleVisor shows, Industrials now have the highest relative analysis score of all the sectors versus the S&P 500. Despite a slump in inbound port traffic and slowing in the rail and trucking industry, most other sub-sectors within industrials are trading well. The second graphic, showing the ten largest stocks in the XLI ETF, highlights that aerospace companies are leading the way. Positive earnings and relatively good news on the tariff front for their specific industries are helping those companies outperform the market. The only company of the ten that is oversold versus the market is Union Pacific, a railroad freight company.


The Stealth Bear Market
Is this a “stealth” bear market? Of course, you may be asking yourself what I mean by that.
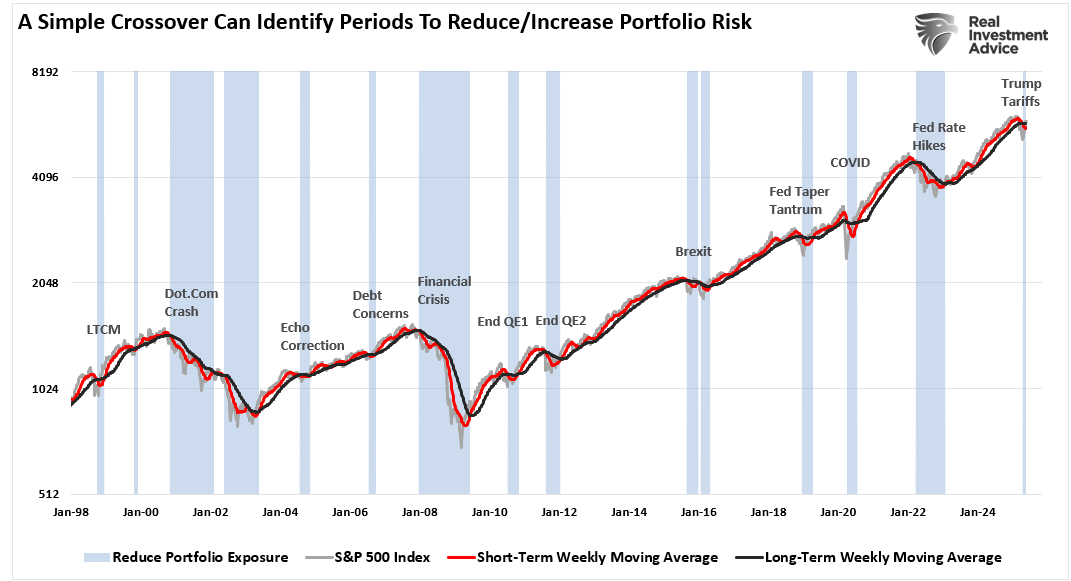
Historically, bear markets have tended to be pretty evident, as highlighted in the chart below. These bear markets are often more protracted affairs that lead to investors developing profoundly negative sentiment towards markets. This article will use a weekly moving average crossover to identify “corrections” and “bear markets.” While our definition may not “jive” with the mainstream narrative, the reasoning will be evident momentarily.
When the short-term moving average crosses below the long-term, a “sell signal” occurs. That trigger suggests that investors should reduce equity risk in portfolios. When that signal reverses, investors should increase equity risk. Since 1995, the weekly indicator has only given three “false” signals. However, those signals were quickly reversed as the bull market continued, doing little harm to investors’ total returns. The signals warned investors of critical downturns to reduce equity exposure and avoid more significant capital destruction.
Tweet of the Day
“Want to achieve better long-term success in managing your portfolio? Here are our 15-trading rules for managing market risks.”
Please subscribe to the daily commentary to receive these updates every morning before the opening bell.
If you found this blog useful, please send it to someone else, share it on social media, or contact us to set up a meeting.

