
🔎 At a Glance
- Government Shutdown – A Repeat Of The Past
- Bubble In AI: Echoes Of The Past, Lessons For The Present
- Portfolio Tactics For Next Week
- From Lance’s Desk: Promised Recession…So Where Is It? – RIA
- Portfolio updates & sector strategy shifts
- Market stats, screens, and risk indicators
💬 Ask a Question
Have a question about the markets, your portfolio, or a topic you’d like us to cover in a future newsletter?
📩 Email: lance@riaadvisors.com
🐦 Follow & DM on X: @LanceRoberts
📰 Subscribe on Substack: @LanceRoberts
We read every message and may feature your question in next week’s issue!
🏛️ Market Brief – Government Shutdown – A Repeat Of The Past
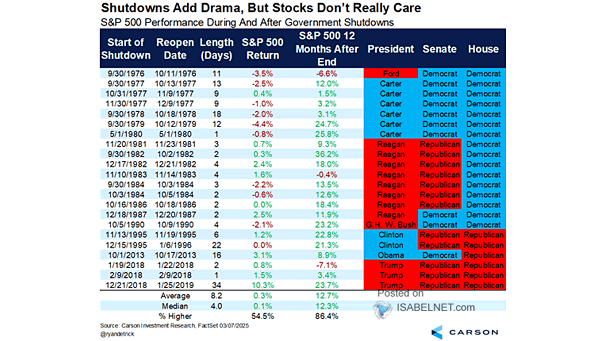
Markets closed the third quarter grappling with two competing forces: Jerome Powell’s warning that equities are “fairly highly valued,” and the uncertainty of a government shutdown that began over the weekend. The shutdown halts most economic data releases from the Bureau of Labor Statistics, including this week’s jobs report, leaving investors without the usual anchors. Historically, markets have looked through shutdowns as political theater, and so far, that has been the case this time. As shown in the table below, the markets are higher about 85% of the time.
Momentum stocks, particularly the Nasdaq and AI-linked Mega-caps, continued their impressive rallies. The markets have been higher for five consecutive months, a very long streak. Investors also are not paying much attention to warnings about valuations, which is unsurprising as momentum and sentiment trump fundamentals. However, while valuations denote periods of bullish sentiment and elevated risk, they rarely end rallies.
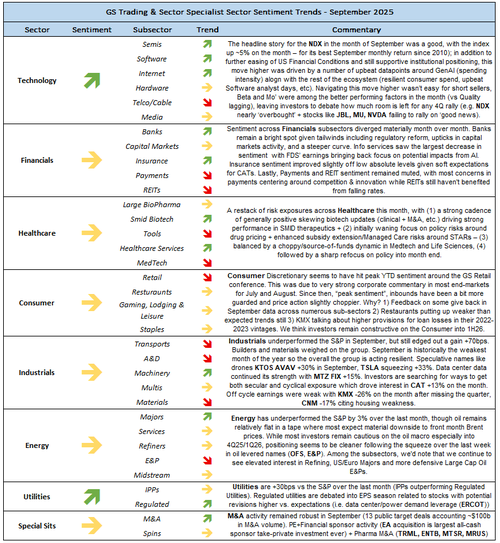
Looking forward, Goldman’s top traders expect October to be more difficult. According to their desk commentary, while flows remain constructive overall, positioning is heavy in technology and momentum names, leaving the market vulnerable to even modest shocks. Their sector view highlights caution in consumer discretionary and industrials. These areas are likely at risk of slowing economic growth. However, they expect energy and healthcare to remain relative outperformers.
Overlaying that outlook, with quarter-end rebalancing now behind us, while it is possible for October to see some volatility, it also begins the seasonally strong period of the year. Historically, October delivers ~1% average returns, but again, the month also has seen its share of corrections. However, with earnings season about to get underway, which should support asset prices, corporate buybacks returning at the end of the month, and many professional investors underweight the leading stocks and lagging performance, there is an inherent upward bias to the markets through year-end.

OUTLOOK: Neutral / Cautious: The October setup suggests higher volatility and potential corrective pressure before any year-end rally attempts. Investors should expect uneven trading and prepare for headline-driven swings as Washington gridlock collides with stretched market positioning.
📈Technical Backdrop – Here Comes October
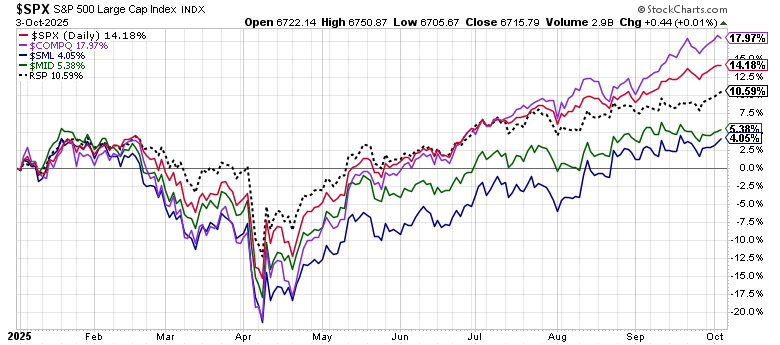
Entering October’s first complete trading week, markets remain perched near all-time highs despite stretched internal signals and a thinning data environment. The S&P 500 closed at ~6,715 on Friday, with the front-end resistance zone holding firm at ~6750 and the upper end of that band. Its 50-day and 200-day moving averages lie well below, anchoring the bullish trend and underscoring how far the price has diverged from its trend base.

Volatility has begun to stir. The VIX has climbed into the mid-teens to near 17 range, departing from the ultra-low complacency levels of recent months. That uptick suggests increasing demand for hedges, even before a sustained pullback emerges. Momentum indicators, including RSI and MACD, remain in a negative divergence from rising prices, which is also a classic sign that upside is becoming harder to sustain.
Breadth remains a concern. The rally is narrow: gains are concentrated among mega-cap and tech/momentum names, while mid- and small-cap segments lag. The equal-weight index underperformance versus cap-weighted benchmarks continues to warn of structural fragility. Meanwhile, due to the government shutdown, the lack of fresh macro data gives technical levels and sentiment flows more influence than usual.
In this environment, support and resistance zones are of oversized importance. Near-term support is established in the 6,570-6,627 range (a zone where past pullbacks found buyers). If sentiment sours, more support is potentially down toward ~6,500 (the 50-DMA). Resistance remains at this past week’s highs at ~6,750. A sustained break below support would invite more aggressive downside targeting. However, a move above recent highs will keep speculative activity alive.
Outlook: Bullishly Cautious. The trend is still intact, but the margin for error has narrowed. Given the confluence of valuation stress, narrow leadership, rising volatility, and a data blackout from the shutdown, we should expect more frequent and sharper intraweek swings. Any technical breach, especially a breakdown through support zones, would likely catalyze larger moves given the stretched state of positioning. Caution and tighter risk control are prudent as the market navigates this tension zone.
🔑 Key Catalysts Next Week
With the government shutdown potentially entering a second week, investors face a unique challenge: a thinner stream of official data just as markets grapple with stretched valuations and quarter-end rebalancing pressures. Without the usual labor and inflation reports, even secondary releases, consumer sentiment, trade flows, and credit demand take on outsized importance. Add a fresh look at the Fed’s thinking through the upcoming FOMC minutes, and the narrative for October could swing quickly. Traders should be prepared for headline-driven volatility, where Washington developments and corporate earnings guidance may matter as much as the macro calendar.

OUTLOOK: Elevated Volatility Risk. This week’s calendar is light on marquee macro data, but that may heighten the market’s sensitivity to everything released, particularly earnings commentary, fiscal statements, and government shutdown developments. The Fed’s minutes may substitute for absent data, giving investors a window into the policy path in a data-starved environment. Given stretched positioning in mega-caps and narrow leadership, any negative surprise or hawkish tone will likely be met with outsized intraweek swings. Traders should monitor flows, volatility behavior, and sector dispersion; a subtle shift in tone could dictate who gets rewarded or punished as October unfolds.
Need Help With Your Investing Strategy?
Are you looking for complete financial, insurance, and estate planning? Need a risk-managed portfolio management strategy to grow and protect your savings? Whatever your needs are, we are here to help.

💰 AI Bubble: Echoes Of The Past, Lessons For The Present
If you want to understand the engine under this market’s hood, follow the capital. A recent article by Michael Cembalest frames today’s AI boom as a “vendor-financing circle.” This circle occurs when capital raised by one set of companies (via stock, convertibles, or bonds) is recycled into other companies, and so on. In today’s market, that is where AI-related companies are raising capital to make massive AI capex investments, which become revenue for a handful of infrastructure suppliers (GPUs, networking, power, and data centers). Those reported revenues, in turn, help justify still more capital raises, higher valuations, and even bigger build-outs. It looks and feels like reflexivity in real time.
You can see the loop in the tape. With sequential growth powered by AI demand, Nvidia’s data-center cycle has produced staggering top-line figures: $30B for Q2 FY2025 and $46.7B for Q2 FY2026. Those dollars don’t appear out of thin air; they are funded by hyperscalers and “neoclouds” expanding footprints at breakneck speed.
Meanwhile, capital formation downstream has accelerated. Citigroup projects AI infrastructure outlays to reach roughly $490B by 2026 and $2.8T by 2029.

Oracle’s $18B bond sale, a jumbo deal, was explicitly tied to building AI cloud capacity for large customers. And OpenAI’s “Stargate” initiative targets a stunning $500B to deploy ~10 GW of compute across sites, with partners and suppliers intertwined through equity stakes, long-dated supply agreements, and chip-leasing constructs. When suppliers invest in customers who then pre-order supplier hardware, you’re not just seeing demand but circular demand.
For example, Oracle doesn’t have the money to pay for this spending surge, which is projected to last well into the 2030s (This also assumes that there is NO RECESSION between now and then). While vendor financing with cash from operations is one thing, vendor financing with cash from debt is something totally different. As Cembalest noted, we have now evolved into a “circular economy” of AI, where growth depends on a narrow group of companies. As he noted:
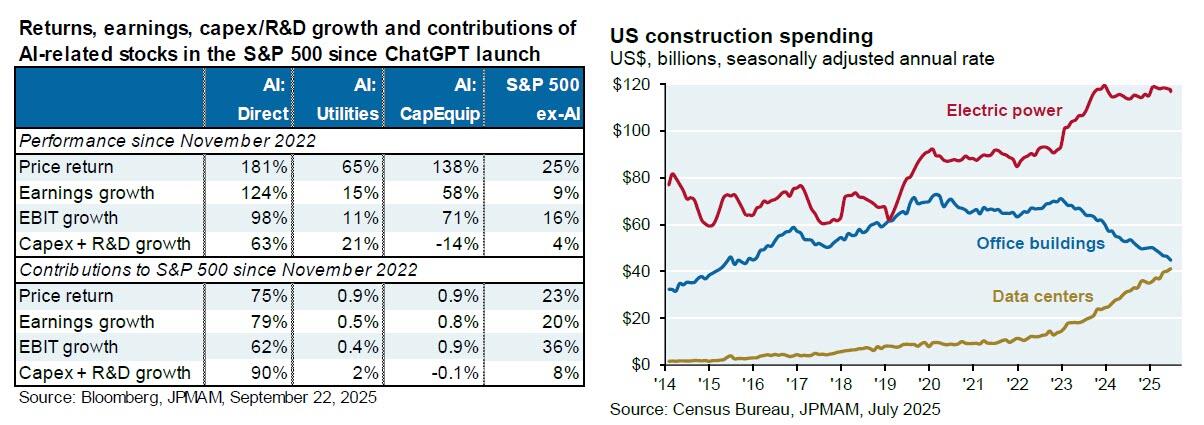
“I think this is well understood, but just to reinforce the point: AI related stocks (1) have accounted for 75% of S&P 500 returns, 80% of earnings growth and 90% of capital spending growth since ChatGPT launched in November 2022. AI is showing up other places as well. Data centers are eclipsing office construction spending and are coming under increased scrutiny for their impact on power grids and rising electricity prices.”
But here is his real eye-opening statement:
“Other recent AI news: Oracle’s stock jumped by 25% after being promised $60 billion a year from OpenAI, an amount of money OpenAI doesn’t earn yet, to provide cloud computing facilities that Oracle hasn’t built yet, and which will require 4.5 GW of power (the equivalent of 2.25 Hoover Dams or four nuclear plants), as well as increased borrowing by Oracle whose debt to equity ratio is already 500% compared to 50% for Amazon, 30% for Microsoft and even less at Meta and Google. In other words, the tech capital cycle may be about to change.”
This pattern has historical rhyme. During the late-1990s telecom boom, equipment makers extended aggressive credit (“vendor financing”) to carriers, effectively funding the purchase orders that produced the vendors’ reported revenues. By mid-2001, the Wall Street Journal tallied at least $25.6B of such loans across major vendors; for one cohort, that financing equaled 123% of combined pretax earnings in 1999. Vendors wrote down receivables when customers defaulted, and the virtuous loop snapped.
The takeaway isn’t that today’s AI spend is fake; the ecosystem itself reflexively finances some portion of revenue. While that completely supports the market while the “music plays,” it becomes problematic if cash returns lag capex for too long, power and supply constraints slow utilization, or financing windows narrow.
Is AI a bubble? Maybe.
The AI Bubble Today: Similarities and Differences from the Late ’90s
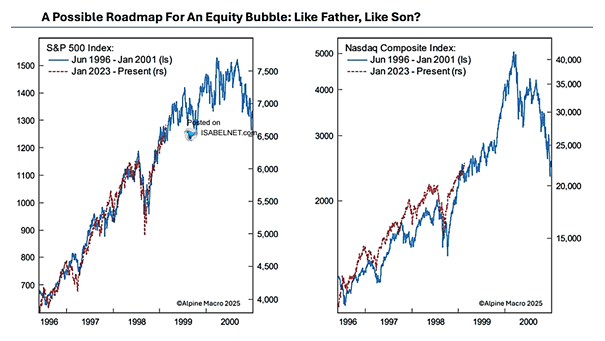
Every bubble has a story at its core. In 1999, that story was the internet: a transformational technology that would reshape commerce, communications, and culture. Investors saw the future, bid prices into the stratosphere, and assumed profits would inevitably follow. In 2025, the story is artificial intelligence, which carries the same irresistible promise of reshaping industries, creating productivity booms, and unlocking new frontiers. The parallels are hard to miss, along with the current price action.
Like the dot-com era, today’s market is being driven by breathtaking growth assumptions. Back then, Cisco traded north of 100x earnings on the belief it was selling the “backbone of the internet.” Pets.com and Webvan raised hundreds of millions, only to collapse when business models proved unsustainable. The psychology, then and now, is driven by the “fear of missing out.” Investors rush in because the narrative is too powerful to ignore: However, “if AI changes everything, you can’t afford not to own it.“
But while the similarities are striking, the differences are equally significant. Unlike the dot-com darlings of the 1990s, today’s AI leaders are not pre-revenue companies burning cash with no path to profitability. Nvidia generates tens of billions in quarterly revenue from its GPU dominance. Microsoft, Amazon, and Alphabet have deep operating businesses producing free cash flow to fund their AI bets. These are not speculative shell companies; they are some of history’s largest, most profitable corporations.
That distinction matters. In the late ’90s, investors piled capital into companies with no earnings or customers. Today, investors are bidding up firms with massive revenues, entrenched customer bases, and operating leverage. The risk, however, is that investors are again extrapolating linear revenue growth into the future without considering bottlenecks, power constraints, monetization limits, and slowing marginal returns on AI spend.
So while today’s AI ecosystem is more grounded than the dot-com startups of 1999, the underlying behavior is the same: valuations are being stretched on the assumption that a revolutionary technology will deliver exponential profits.
History reminds us that transformative technologies often succeed over decades, but the first wave of companies and their investors rarely capture the full promise implied in their stock prices.
Bubble Length and Eventual Endings
Timing is the cruel part. As shown above, is this Alan Greenspan’s “irrational exuberance” moment in December 1996? Or, are we much later in the cycle? Honestly, I have no idea. But in 1996, the Nasdaq peaked more than three years later, suggesting that amid the “inflation of a bubble,” inflation can last longer than seems logical. We see that through all previous bubbles in history.

The critical issue for investors, both then and now, was that many were “right” about the Dot.com bubble. However, they were so early in their warnings that they were wrong in their portfolios. The same warning applies currently. Is there a bubble in AI? Maybe. But, I would even suggest that it is pretty likely. As investors, we must realize that during the “inflation” phase of the bubble, there is a lot of money to be made, but the cycle will eventually end.
That’s why fighting parabolic moves can be so problematic. As Peter Lynch once stated:
“Far more money has been lost by investors preparing for corrections, or trying to anticipate corrections, than has been lost in the corrections themselves.”
Read that again.
We are likely closer to a top than not, but that top could be months, quarters, or even one or two years away. That is why the better frame for investors to consider is “cycle math.” Focus on liquidity, policy, indexation, and corporate incentives, as they can extend manias far beyond fundamental comfort. However, eventually, those cycles begin to reverse, and what previously ended speculative bubbles begin to “rhyme.”
- Financing tightens;
- ROI disappoints;
- Accounting adjustments reveal how much growth was pulled forward, not run-rate, and
- Leadership concentration flips from strength to fragility as forced sellers meet illiquidity.
From 2000 to 2002, the telecom sector unwind delivered all of the above from defaults, receivable write-offs, and serial guidance cuts. Replace “fiber overbuild” with “compute and power overbuild,” and you have a credible left-tail scenario if demand monetization trails supply for too long. Ratings agencies and sell-side shops have noticed, flagging the leverage and power constraints embedded in the current build cycle, even as they acknowledge substantial real use cases.
Today, it is the same, but in a different form. As Roger McNamee recently wrote for The Guardian:
“Investors have assumed that every major US player in [large language models (“LLMs”)] will be a winner. This assumption is essential, as the monopolies that power big tech – such as Microsoft’s Office suite, Google Search, Gmail, and Docs, and Meta’s Facebook – are, without exception, approaching the end of their useful lives. The vast majority of customers believe that these products have gotten worse – and made users less productive – over the past decade or more. Each big tech company needs a global monopoly in AI to sustain their success and market value. They are not all going to get one.
The former General Electric CEO Jack Welch made famous the notion that only two players can be profitable in a competitive industry. Below the top two, it is a struggle to survive. That means that at least three, and perhaps more, of the current players will be forced to write off their investments in LLMs. Each of the big tech companies has invested in the range of $100bn through this year, and by next year that number could easily double. If LLM technology does not improve rapidly, their corporate customers will also face write-offs.
The day may come sooner than many expect when shareholders, directors and executives will demand evidence that the massive investment in LLM technology will generate an adequate return for them. The answer will be no for many, if not most, players, and the reckoning will [be] ugly for everyone.“
Such reminds me of Charles Kindleberger’s old line:
“If something cannot go on forever, it will stop.”
Critically, I am not suggesting that the AI bubble is about to burst tomorrow. We have many of those particular stocks in our portfolios, from Google to Meta to Nvidia and others. Furthermore, my discussion here is not intended to be a timing tool but rather a budgeting tool. Don’t expect the current market to underwrite infinite carry from a finite financing window. That mindset kept investors alive in 1999–2002 and again in 2007–2009. It applies again in 2025.
📒 Portfolio Tactics – Navigating A Market Bubble
Let me conclude by stating that my intention is not to dunk on innovation; it’s to manage risk amid it. The practical playbook in bubbles is more carpentry than heroics.
First, separate plumbing from promises. Infrastructure winners can post extraordinary revenue growth if the financing loop remains open. That’s tradable momentum but not the same as durable, end-customer ROI. In your underwriting, prioritize evidence of cash demand (contracted workloads with measurable payback) over capital demand (pre-buys and option-like contracts funded by equity or fresh debt). Until the monetization bridge is built, capex dependence is a risk factor, not a moat.
Second, let prices do the heavy lifting. When leadership is this extended, mean-reversion is a feature, not a bug. Use predefined rebalancing bands to trim exposure into vertical rallies and add on resets to rising 50/100-DMAs instead of chasing exhaustion gaps. That keeps you involved (because bubbles can run) while turning volatility into a source of discipline rather than damage.
Third, demand balance-sheet realism. In the late ’90s, vendor financing and receivables quality were the tell. Watch interest coverage after new bond deals, capex as a share of operating cash flow, and disclosure around take-or-pay or utilization guarantees. If the ecosystem is cross-subsidizing itself (supplier invests in the customer who pre-orders the supplier’s gear), discount the apparent “visibility.” The more circular the revenue, the more fragile the flywheel when financing costs rise. Recent deals around Stargate and supplier co-investments are a case in point.
Fourth, think in barbells and play defense in the middle. On one end, maintain a measured exposure to proven cash generators that genuinely benefit from AI (unit-level margins, network effects, or distribution that converts AI into pricing power). On the other hand, hold high-quality ballast, short-duration Treasuries, or cash equivalents, to fund drawdowns and keep optionality. In between, be choosy with capital-intensive stories where the cash-in date sits far beyond the cash-out date. As the Dallas Fed and Goldman work suggests, productivity gains likely build over years—not quarters—so leave yourself time.
Finally, accept that you won’t nail the top. That’s okay. Successful navigation is less about calling a date and more about insisting on process: valuation awareness, position sizing, staged entries/exits, and the humility to let price action confirm your thesis. Bubbles end the same way, financing tightens, a few high-profile misses flip psychology, and cash becomes king. Have some.
Trade accordingly.

🖊️ From Lance’s Desk
This week’s #MacroView blog examines various leading economic indicators and their current meaning regarding the economy’s strength.

Also Posted This Week:
- Miran Says Rates Are Too High: Politics Or Reality? – by Michael Lebowitz
- RSI (Relative Strength Index): Timing The Next Correction – by Lance Roberts
📹 Watch & Listen
What does October tell us about seasonal market performance as we start the new month and quarter?
Subscribe To Our YouTube Channel To Get Notified Of All Our Videos
📊 Market Statistics & Analysis
Weekly technical overview across key sectors, risk indicators, and market internals

💸 Market & Sector X-Ray: Pullback To Support
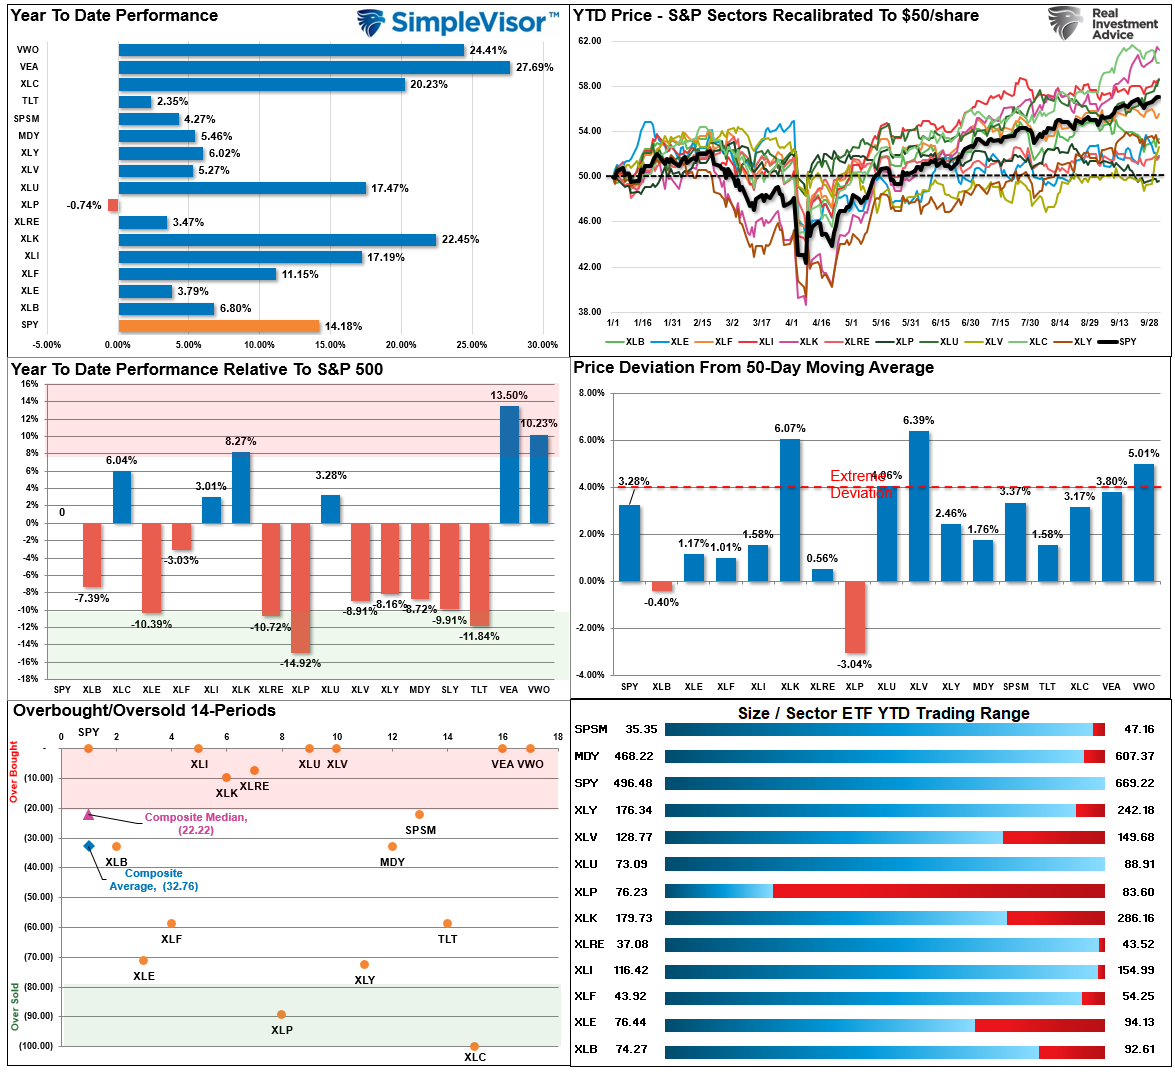
Despite the lack of Government data, investors continued to push markets higher this week. The overall market is back to more overbought levels, along with Industrials, Technology, Real Estate, Utilities, Healthcare, and International and Emerging markets. Look for short-term corrections to reverse some excess, but remain long equities heading into year-end.
📐 Technical Composite: 90.98 – Extreme Overbought
The overall technical condition increased further this week and has now captured the 90-level. Such readings are somewhat rare, and while they don’t suggest an immediate correction, they do tend to indicate environments where corrections become more likely. As such, the upside is likely limited.

🤑 Fear/Greed Index: 74.04 – Pushing Back Towards Extreme Greed
Investors’ allocations, sentiment, and positioning continue to support the current bullish backdrop to the market. There is little “fear” registering across measures, including options positioning, equity allocation levels, and overall biases. The fear/greed index is not at levels consistent with more notable market peaks, but is elevated enough for short-term corrective actions.

🔁 Relative Sector Performance
This past week, technology has moved into an extreme overbought condition on an absolute and relative basis. Previous such extremes saw at least short-term corrections. Staples has become very oversold and will likely lead to a rotation in a risk-off environment.

📊 Most Oversold Sector Holdings
As noted, Staples is the most oversold sector, with COST, PG, PM, and CL being the most oversold in the group. We will likely see flows into these more defensive names in a risk-off rotation.

📊 Sector Model & Risk Ranges
As we noted last week, the S&P 500 is very extended and is 11% above its long-term mean. With many sectors and markets, particularly Gold Miners, trading at double-digits above long-term averages, risk management remains key in this environment. Corrections will not only be swift, but very broad across markets when they occur.

Have a great week.
Lance Roberts, CIO, RIA Advisors

