Inside This Week’s Bull Bear Report
- The Momentum Chase Is On
- How We Are Trading It
- Research Report –Could AI Resolve Our Debt Problem?
- Youtube – Before The Bell
- Market Statistics
- Stock Screens
- Portfolio Trades This Week
Economy Slows And Market Slips
Last week, we discussed consumer data suggesting the economy was weakening. This past week, downward revisions to Q1 GDP and weak personal consumption expenditures (PCE) reports confirmed that suspicion.
The U.S. economy’s growth in the first quarter was revised to an annualized rate of 1.3% from the previously estimated 1.6%, reflecting weaker consumer spending and equipment investment. This slowdown contrasts sharply with the 3.4% growth rate in the final quarter 2023. Inflation for the first quarter was also slightly revised down to 3.3%.
On Friday, PCE, which is roughly 70% of GDP growth, also came in under expectations, adding more concerns to a growing list of economic data that has recently weakened.
In an interesting turn of events, “bad news” seemed to matter to the markets this week. Of course, the reality was that the market was overbought and needed a correction. Wall Street just needed a reason to liquidate some positions.
As noted last week, the 20-DMA crossed above the 50-DMA. On Friday, that support level held, and the market bounced off it, keeping the current consolidation process intact. If the 20-DMA fails, the 50-DMA is the next logical support level. Below is the 100-DMA that provided support during the April correction.

Crucially, the market has now registered a “sell signal,” which will limit any rallies in the near term. Therefore, investors should continue to use bounces to reduce exposure and rebalance portfolios as needed. The upside to the market is likely constrained to recent highs.
While we expect another correction sometime this year, likely before the election, the market will likely provide early warnings of that event. As noted, failures at the 20- and 50-DMA will be such warnings. Also, a failure of the momentum trade that began in November will be worth watching, and it is the subject of this week’s newsletter.
Need Help With Your Investing Strategy?
Are you looking for complete financial, insurance, and estate planning? Need a risk-managed portfolio management strategy to grow and protect your savings? Whatever your needs are, we are here to help.

The Momentum Chase
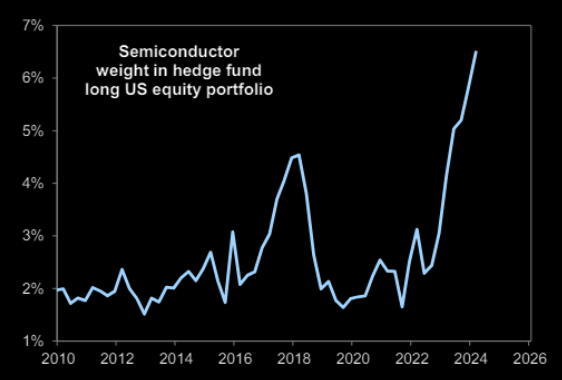
It is an interesting market environment. Each day, investors parse every piece of economic or financial data for what it may mean to Fed policy. Will the Fed begin cutting rates and restarting monetary accommodation? Such is all that seems to matter. At the same time, investors continue to chase stocks higher based on the current theme. In 2020, it was disrupter stocks. Today, it is artificial intelligence and semiconductor providers.
It doesn’t help that media headlines are filled with meaningless commentary while ignoring fundamentals or valuations. In other words, such quaint ideas of buying value have become relics of an age long ago. Of course, this should all be unsurprising.
Today, the markets have evolved into a “get rich quick” industry, where Wall Street creates products to fill hungry investors’ demand for the next “hot opportunity.” Such has been a boon for the index ETF industry, financial applications, and trading websites. As such, the momentum investing issue should be no surprise, given that investors learned to “buy risk” when the Federal Reserve increased monetary accommodation. As discussed previously, the influence of monetary accommodation on asset prices was astounding. To wit:
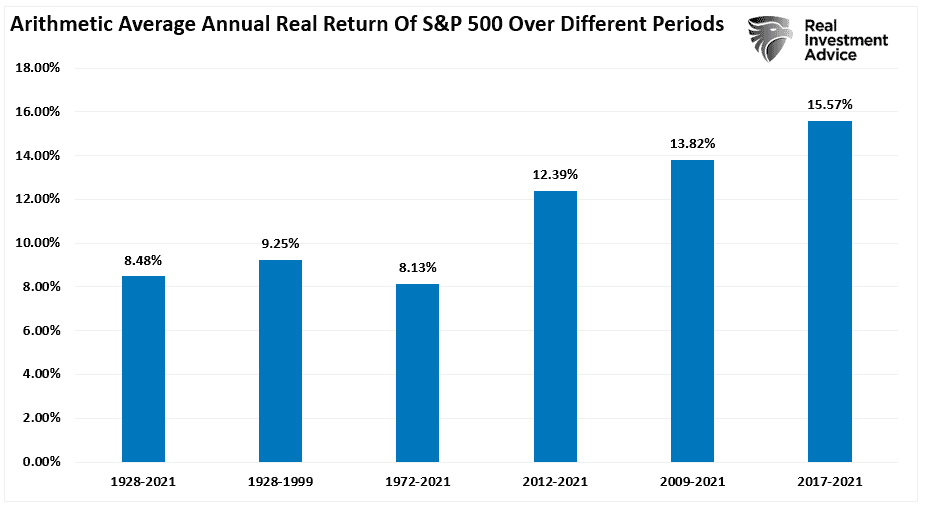
“The chart below shows the average annual inflation-adjusted total returns (dividends included) since 1928. I used the total return data from Aswath Damodaran, a Stern School of Business professor at New York University. The chart shows that from 1928 to 2021, the market returned 8.48% after inflation. However, notice that after the financial crisis in 2008, returns jumped by an average of four percentage points for the various periods.
After more than a decade, many investors have become complacent in expecting elevated rates of return from the financial markets. However, can those expectations continue to get met in the future?”
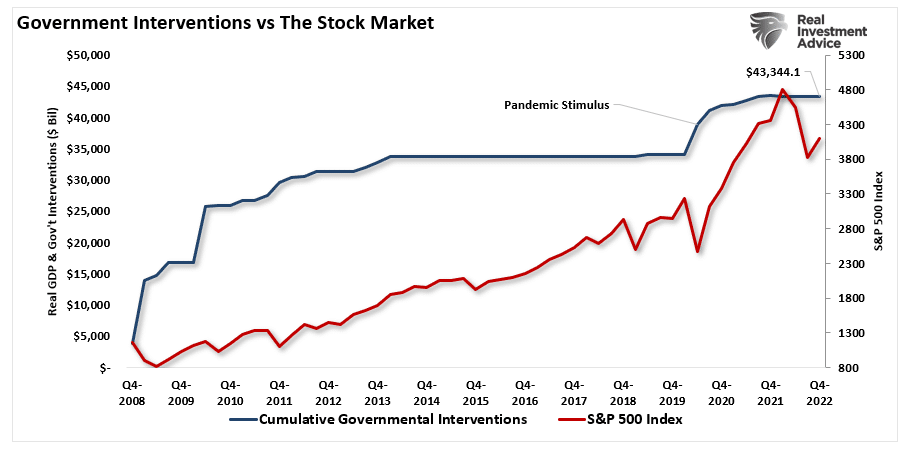
“Of course, those excess returns were driven by the massive floods of liquidity from the Government and the Federal Reserve, including trillions in corporate share buybacks and zero interest rates. Since 2009, there has been more than $43 Trillion in various liquidity supports. To put that into perspective, the inputs exceed underlying economic growth by more than 10-fold.”
After more than a decade, investors are now complacent in expecting elevated rates of return from the financial markets. In other words, the abnormally high returns created by massive doses of liquidity became seemingly ordinary. During this decade-long liquidity period, investors developed many rationalizations to chase momentum.
The Potential Problem
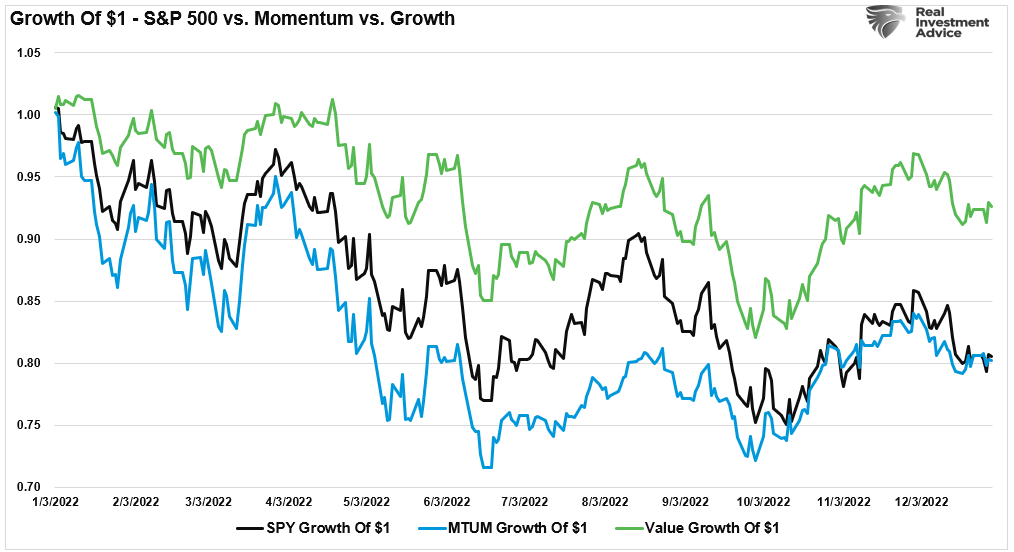
Chasing momentum has problems. We will use the following 3-ETFs from 2014 to the present to simplify our analysis. (2014 is the earliest date that all 3-ETFs have performance data.)
- SPDR S&P 500 ETF (SPY) as the “buy and hold” proxy,
- IShares Momentum ETF (MTUM) as the “momentum” proxy; and,
- IShares Value ETF (IVE) as the “value” proxy.
For our analysis, we calculated the growth of $1 invested in each ETF from January 2014 on a nominal capital appreciation basis only. Over that time frame, momentum is the obvious choice for investors compared to the S&P 500 or value.
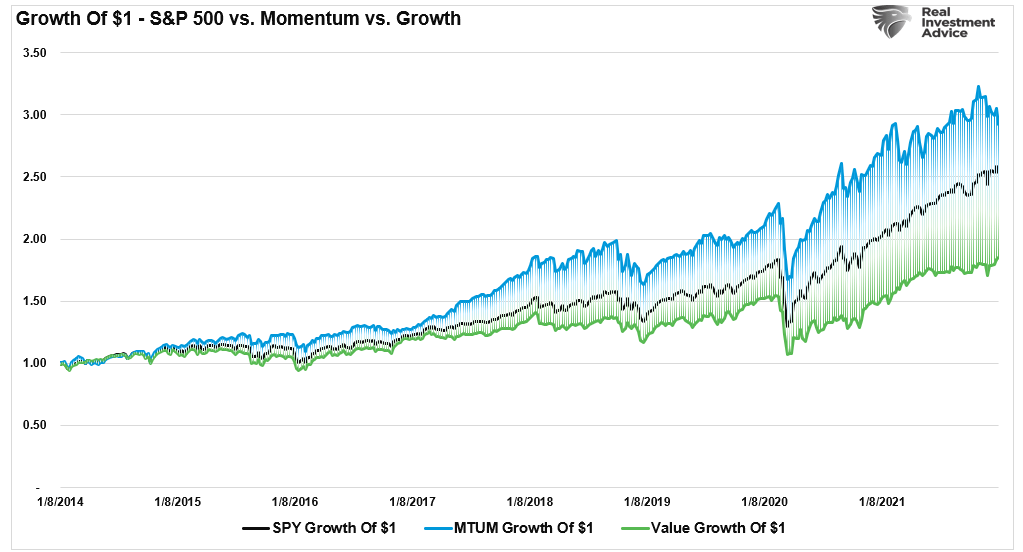
However, there is a problem with chasing momentum that isn’t readily visible in the chart above. Momentum is a double-edged sword. While momentum provides an advantage in a rising market, it has an obvious disadvantage in a declining market. If we break the comparative performance down into specific periods, the value of the momentum strategy gets lost.
In 2105 and 2016, momentum provided no hedge against the Fed’s “taper” and Brexit.

Similarly, in 2018, relative performance, peak-to-trough, was worse than the benchmark during the Fed’s “taper tantrum.”

Momentum provided little protection during the 2022 correction as the Federal Reserve hiked rates and reduced its balance sheet.
The problem for most investors is that they get swept up in the moment of rising asset prices and the thrill of making money. However, as is always the case, what seems to be working today does not mean it will work indefinitely.
Choosing The Right Strategy At The Right Time
As a strategy, momentum investing works well when correctly applied to a portfolio of individual securities.
“One of the most interesting aspects of this portfolio though is not only that it has a lot of hard numbers backing it up, but that it is in theory accessible to any ordinary investor who can screen stocks by monthly performance.” – Brett Arends
He is correct, and we provide this at SimpleVisor daily, in screens of relative strength, fundamental and technical rankings, and more.
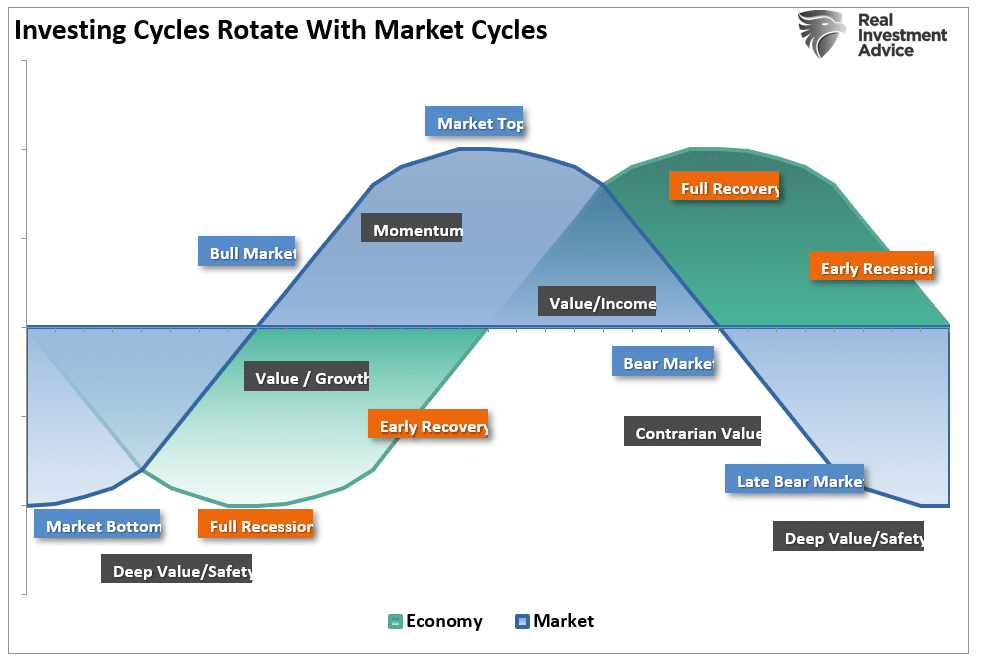
What is crucial is that momentum, as an investing strategy, works exceptionally well in a strongly trending bull market. However, strategies will change during a corrective or bear market cycle. As shown below, market cycles lead the economic cycle. As a result, it should be unsurprising that investment strategies also vary accordingly.
While it may seem like the current advance will continue indefinitely, abandoning decades of investment history would be unwise. As Howard Marks once stated:
“Rule No. 1: Most things will prove to be cyclical.
Rule No. 2: Some of the most exceptional opportunities for gain and loss come when other people forget Rule No. 1.”
The realization that nothing lasts forever is crucial to long-term investing. To “buy low,” one must first “sell high.” Understanding that all things are cyclical suggests that investment strategies must also change.
The rotation from “momentum” to “value” is inevitable. It will occur against a backdrop of devastation for investors quietly lulled into the extreme sense of complacency following years of monetary interventions.
“Relative valuations are in the far tail of the historical distribution. If, as history suggests, there is any tendency for mean reversion, the expected future returns for value are elevated by almost any definition.” – Research Affiliates
The only question is whether you will be the buyer of “value” when everyone else is selling “momentum?”
How We Are Trading It
We certainly understand the importance of momentum in relation to portfolio performance. As portfolio managers, we must generate a return for our clients; therefore, we must participate in those stocks that create that performance.
Yes, we realize that the current momentum chase will eventually end. When it does, we must rotate our portfolios from “offense” to “defense.” We continue to monitor the technical analysis of the broad market and sector rotations, which should provide sufficient warnings for making changes accordingly.
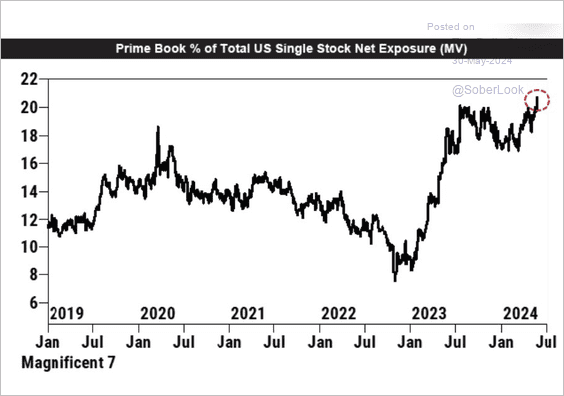
However, the market’s current “momentum chase” requires us to maintain exposure to those “Magnificent 7” market members. The recent correction has started to reverse the market’s previous overbought condition, but nothing suggests the bull market trend from November is at risk. Therefore, continue to use corrections and consolidations to add equity exposure as needed.
Our portfolios are well-positioned for the current market environment. However, we will continue managing exposure and risk as needed.
(You can track those portfolios in real time by subscribing to the newly redesigned SimpleVisor platform.)
Have a great week.
Research Report

Subscribe To “Before The Bell” For Daily Trading Updates
We have set up a separate channel JUST for our short daily market updates. Please subscribe to THIS CHANNEL to receive daily notifications before the market opens.
Click Here And Then Click The SUBSCRIBE Button
Subscribe To Our YouTube Channel To Get Notified Of All Our Videos
Bull Bear Report Market Statistics & Screens

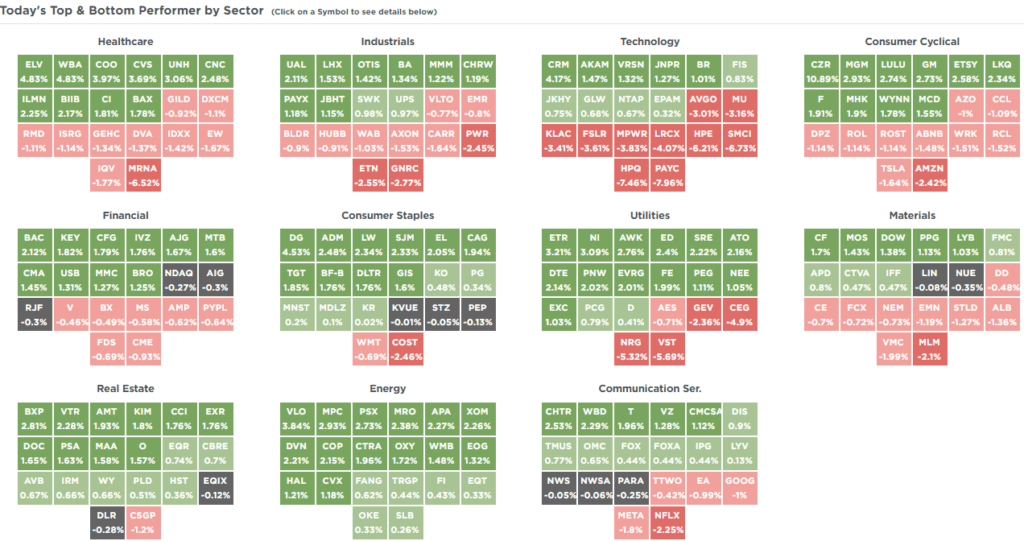
SimpleVisor Top & Bottom Performers By Sector
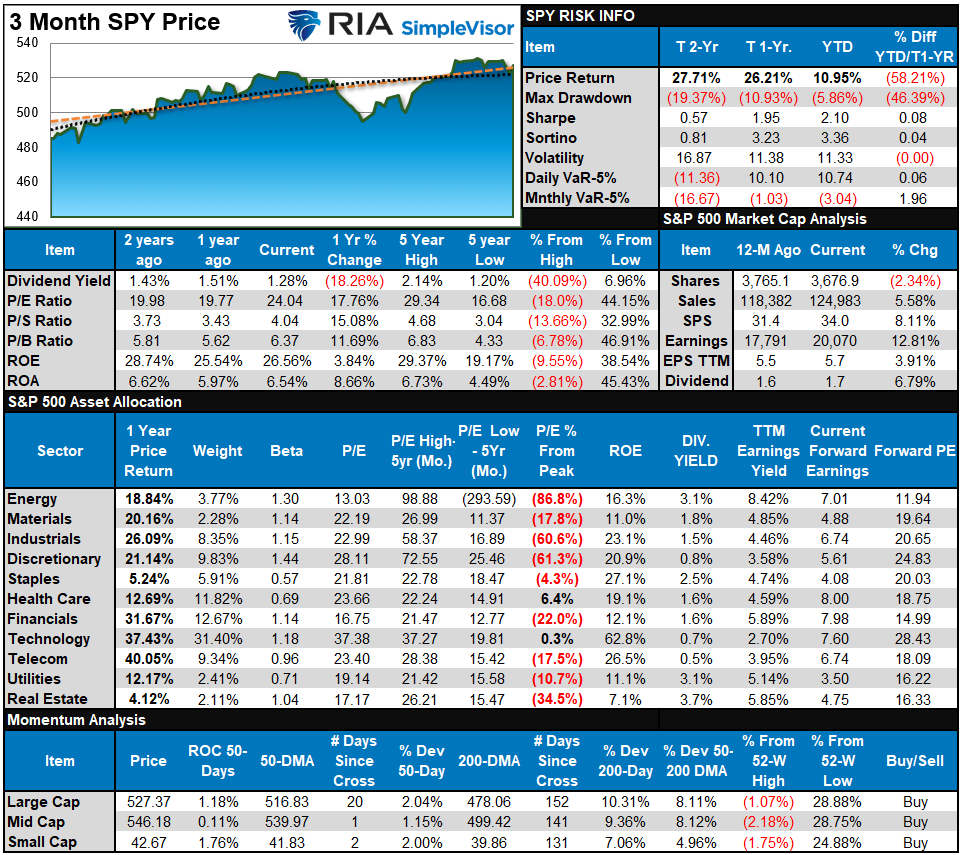
S&P 500 Weekly Tear Sheet
Relative Performance Analysis
Last week, we noted:
“With most sectors and markets short-term overbought, we could see some selling pressure next week as traders profit from the recent rally.”
This past week, that occurred, reducing the more extreme short-term overbought conditions. However, with that process not yet complete, the market could remain somewhat range-bound next week as it continues. The bullish trends remain intact, and portfolios should remain near target equity weightings.

Technical Composite
The technical overbought/sold gauge comprises several price indicators (R.S.I., Williams %R, etc.), measured using “weekly” closing price data. Readings above “80” are considered overbought, and below “20” are oversold. The market peaks when those readings are 80 or above, suggesting prudent profit-taking and risk management. The best buying opportunities exist when those readings are 20 or below.
The current reading is 86.70 out of a possible 100.

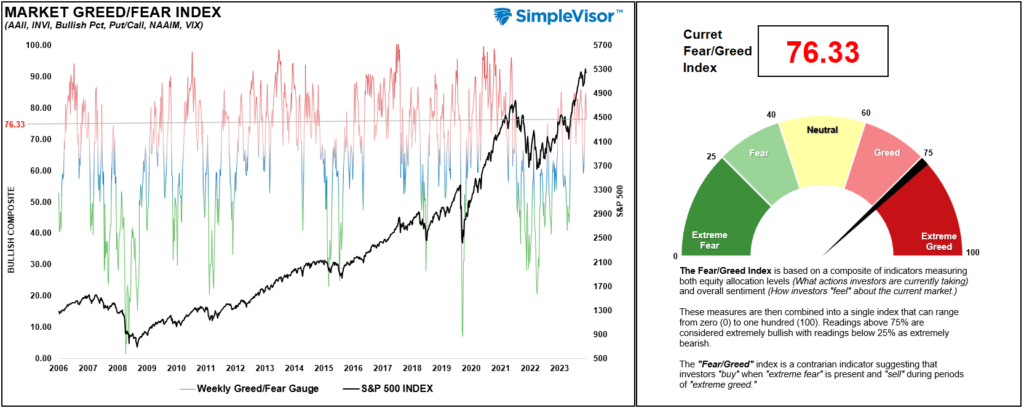
Portfolio Positioning “Fear / Greed” Gauge
The “Fear/Greed” gauge is how individual and professional investors are “positioning” themselves in the market based on their equity exposure. From a contrarian position, the higher the allocation to equities, the more likely the market is closer to a correction than not. The gauge uses weekly closing data.
NOTE: The Fear/Greed Index measures risk from 0 to 100. It is a rarity that it reaches levels above 90. The current reading is 76.33 out of a possible 100.
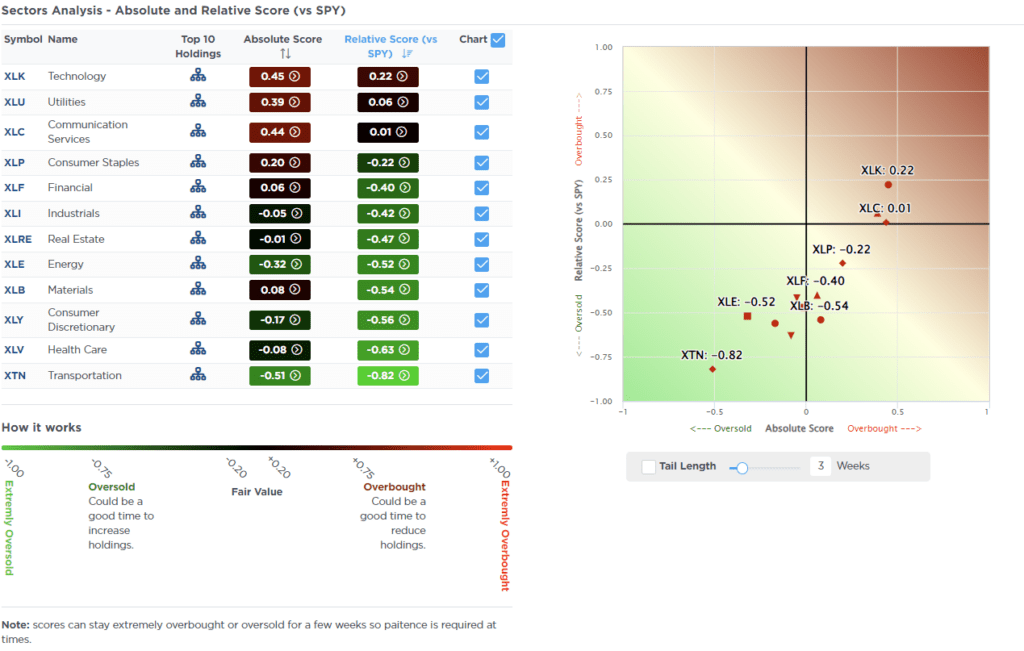
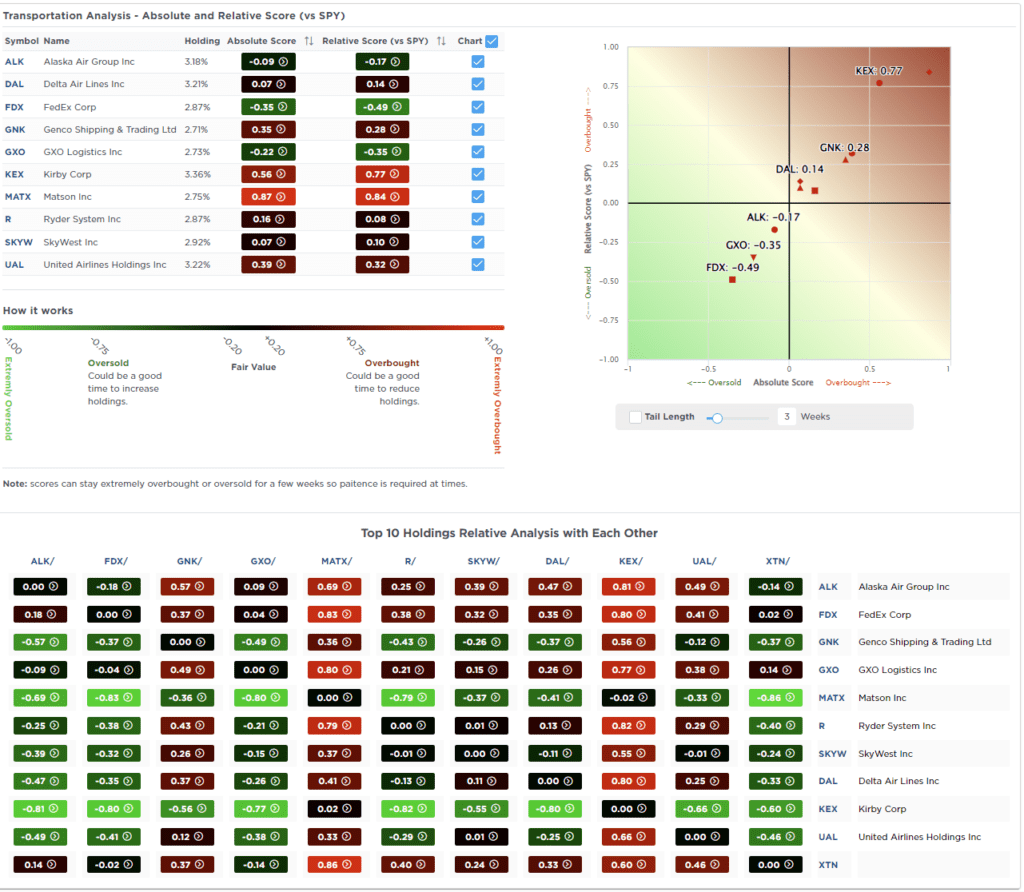
Relative Sector Analysis

Most Oversold Sector Analysis
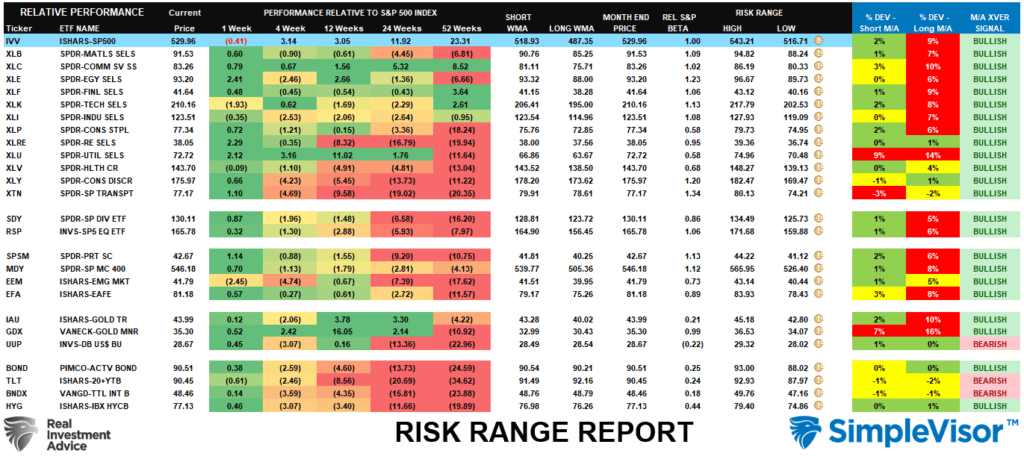
Sector Model Analysis & Risk Ranges
How To Read This Table
- The table compares the relative performance of each sector and market to the S&P 500 index.
- “MA XVER” (Moving Average Crossover) is determined by the short-term weekly moving average crossing positively or negatively with the long-term weekly moving average.
- The risk range is a function of the month-end closing price and the “beta” of the sector or market. (Ranges reset on the 1st of each month)
- The table shows the price deviation above and below the weekly moving averages.
Last week, we noted that:
“As we head into the end of the month, the more extreme overbought readings in many markets and sectors will likely cap any rally attempt into the month’s end.”
Such was the case this past week. With deviations from longer-term moving averages still high for many sectors, we could continue to see some further consolidation. Given that the “risk/range” report resets on the first day of each month, we must wait until next week for further analysis of individual sectors and markets.
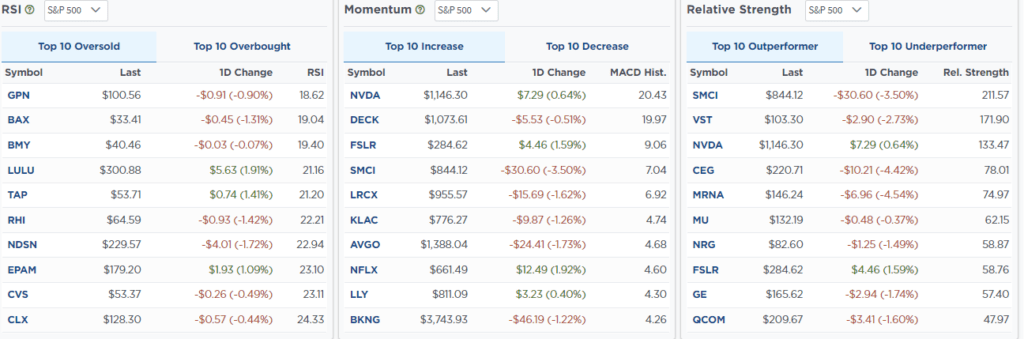
Weekly SimpleVisor Stock Screens
We provide three stock screens each week from SimpleVisor.
This week, we are searching for the Top 20:
- Relative Strength Stocks
- Momentum Stocks
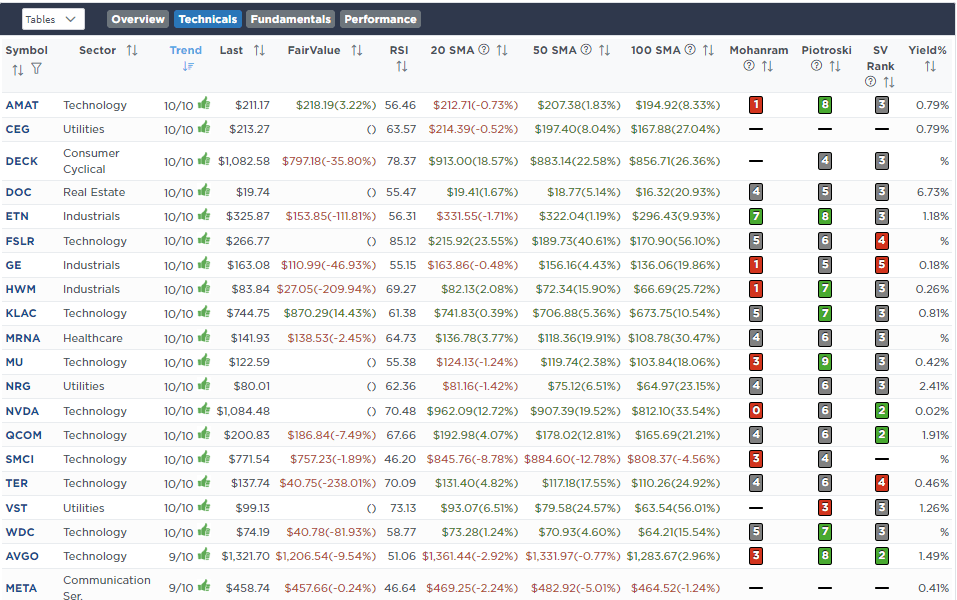
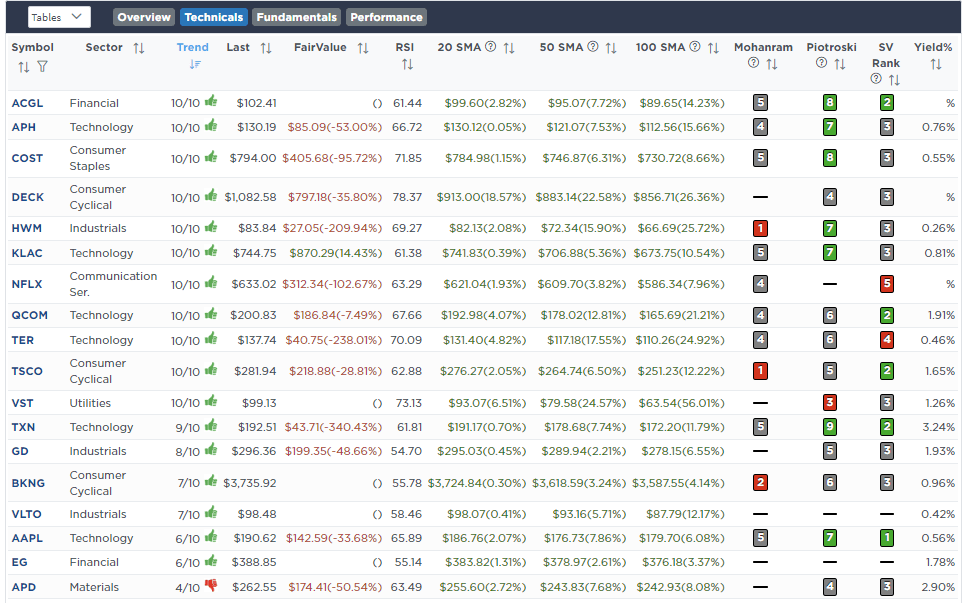
- Fundamental & Technical Strength W/ Dividends
(Click Images To Enlarge)
RSI Screen
Momentum Screen

Fundamental & Technical Screen
SimpleVisor Portfolio Changes
We post all of our portfolio changes as they occur at SimpleVisor:
May 28th
“On Thursday, Costco (COST) will announce earnings. The stock has had a huge run and is pushing 2-standard deviations overbought. It is 4% in our model but over 4.5% in the portfolio. We are reducing the position back to the target model weight today. Even good earnings may not be enough to push the stock markedly higher from current levels. We will add back to the position when the stock corrects in price.”
Equity Model
- Reduce Costco (COST) back to target portfolio weight of 4%.

Lance Roberts, C.I.O.
Have a great week!

