
On Friday, February 24th, the most recent reading of the University of Michigan Consumer Sentiment Index was released. It came in at 67.0 for February, an increase from January’s reading of 64.9.
As the name implies, the University of Michigan Consumer Sentiment Index measures consumer “sentiment” in the United States. Higher numbers suggest a more positive sentiment; lower numbers indicate a more pessimistic view.
Investopedia notes the following regarding the University of Michigan Consumer Sentiment Index:
“Consumer sentiment is a statistical measurement of the overall health of the economy as determined by consumer opinion. It takes into account people’s feelings toward their current financial health, the health of the economy in the short term, and the prospects for longer-term economic growth, and is widely considered to be a useful economic indicator.”
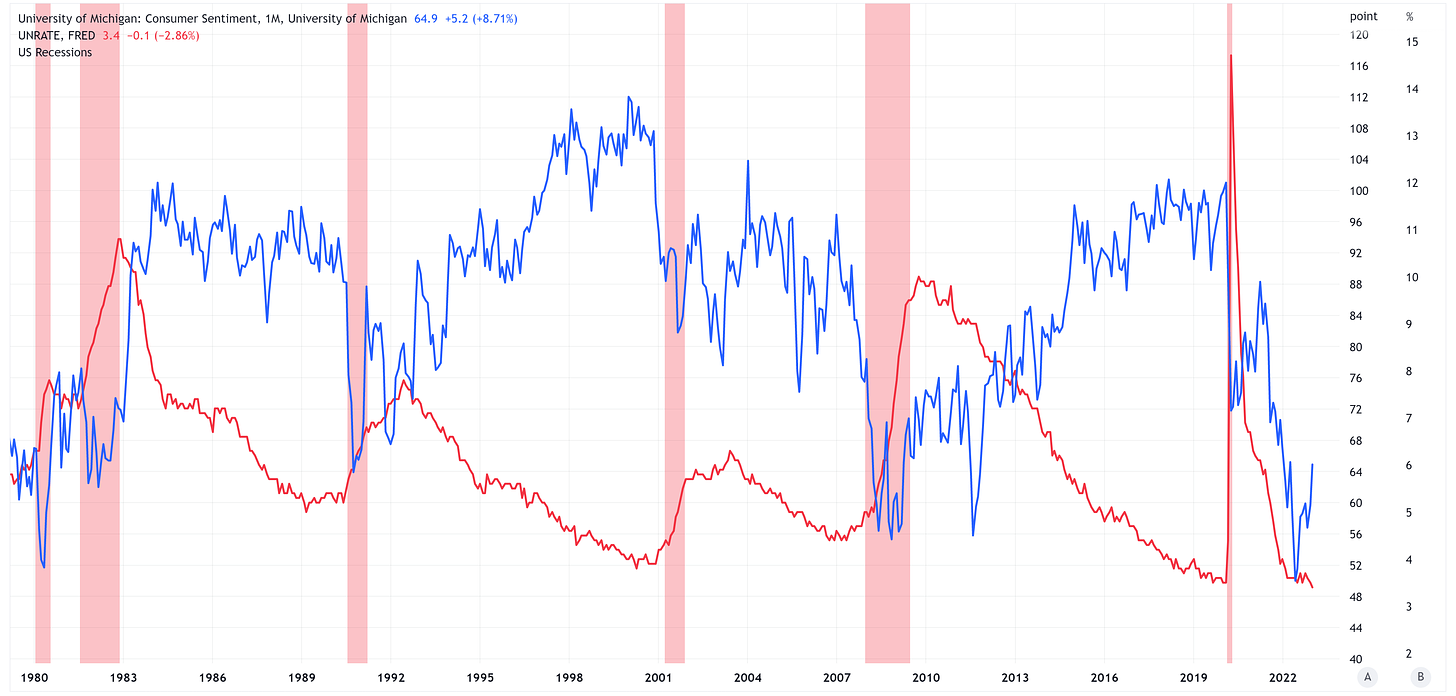
The chart below shows the University of Michigan Consumer Sentiment Index and the Unemployment Rate from the 1980s (Note: the red vertical bars denote US recessionary periods).

Two Observations
There are two observations to take away from this data.
- Both metrics trend over time, but the University of Michigan Consumer Sentiment Index appears to be extremely noisy in the process.
- There appears to be a negative correlation (i.e., when one goes up, the other one goes down) between the two metrics.
To strip out some of the “noise” in the chart below, I am displaying the 24-month moving average for the University of Michigan Consumer Sentiment Index (blue line). Additionally, I have inverted the University of Michigan Consumer Sentiment Index values to observe if the two metrics are negatively correlated.
When we do this, we find that while not a perfect match, they tend to track one another quite nicely.
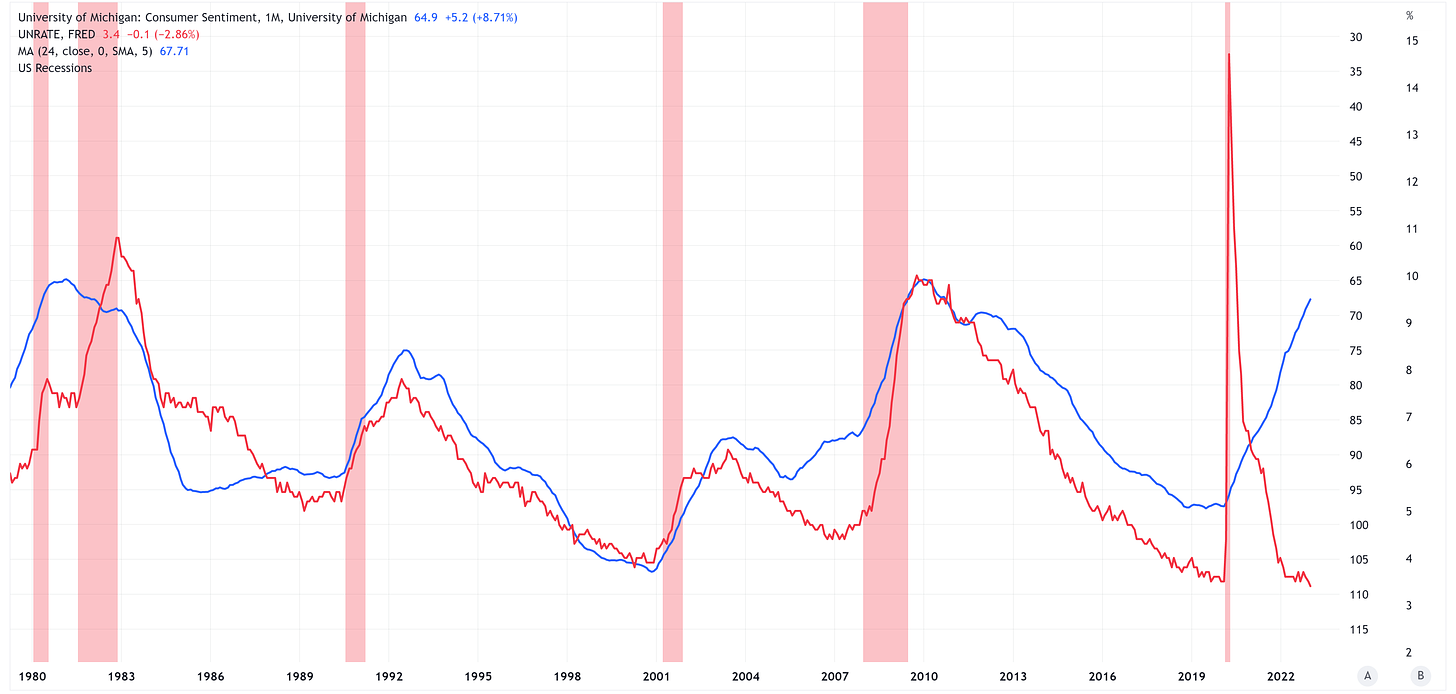
Because the two metrics tend to move in tandem with one another, this would suggest they are “coincident.” However, there are a few observations (green arrows in the chart below) where the University of Michigan Consumer Sentiment Index appears to be a “leading” indicator for the Unemployment Rate.
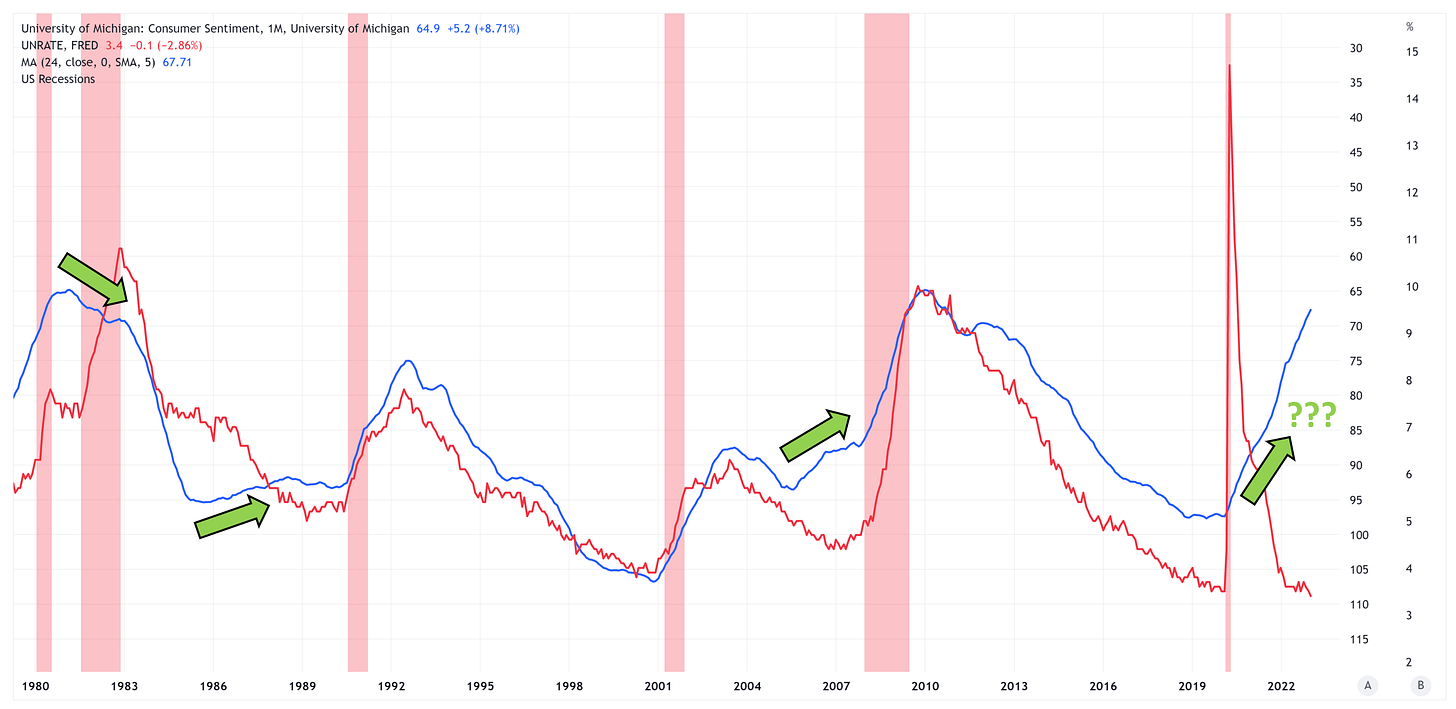
Another Way To Analyze The Data
Looking at the most recent green arrow in the chart above…is the University of Michigan Consumer Sentiment Index suggesting that the Unemployment Rate is about to start trending higher?
The chart below shows a scatter plot of the values from the previous graphs. The downward-sloping red line suggests a negative correlation between the two metrics.
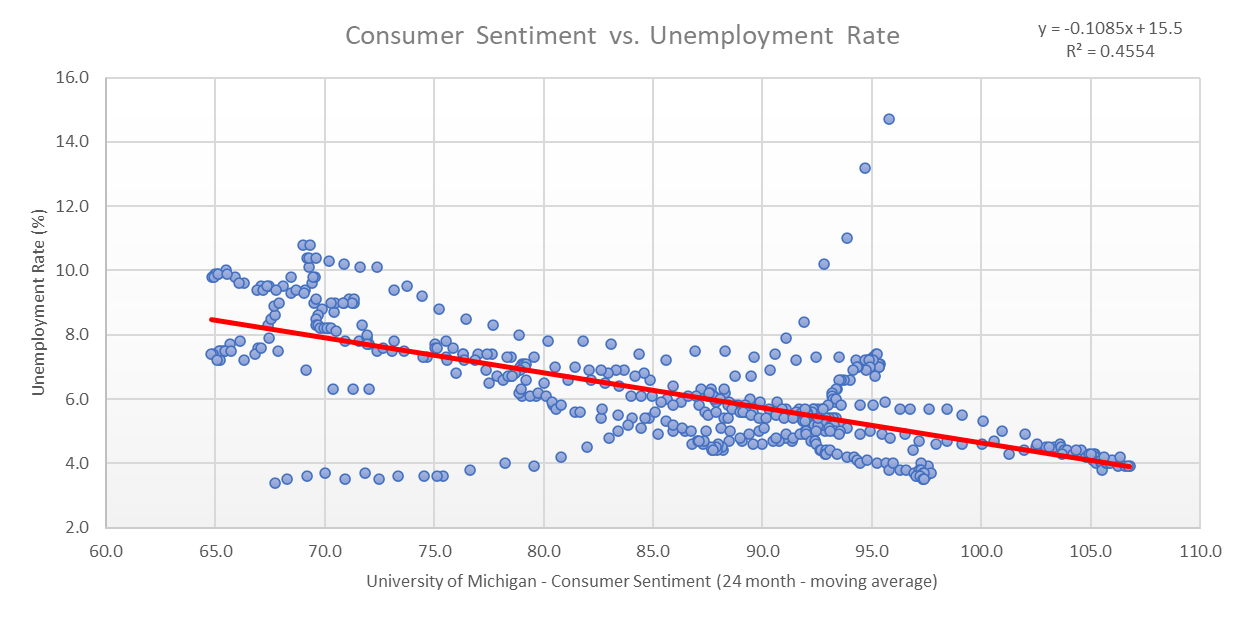
Another note from the chart above is that there appear to be two periods with outlying observations, which I’ve highlighted in the chart below.
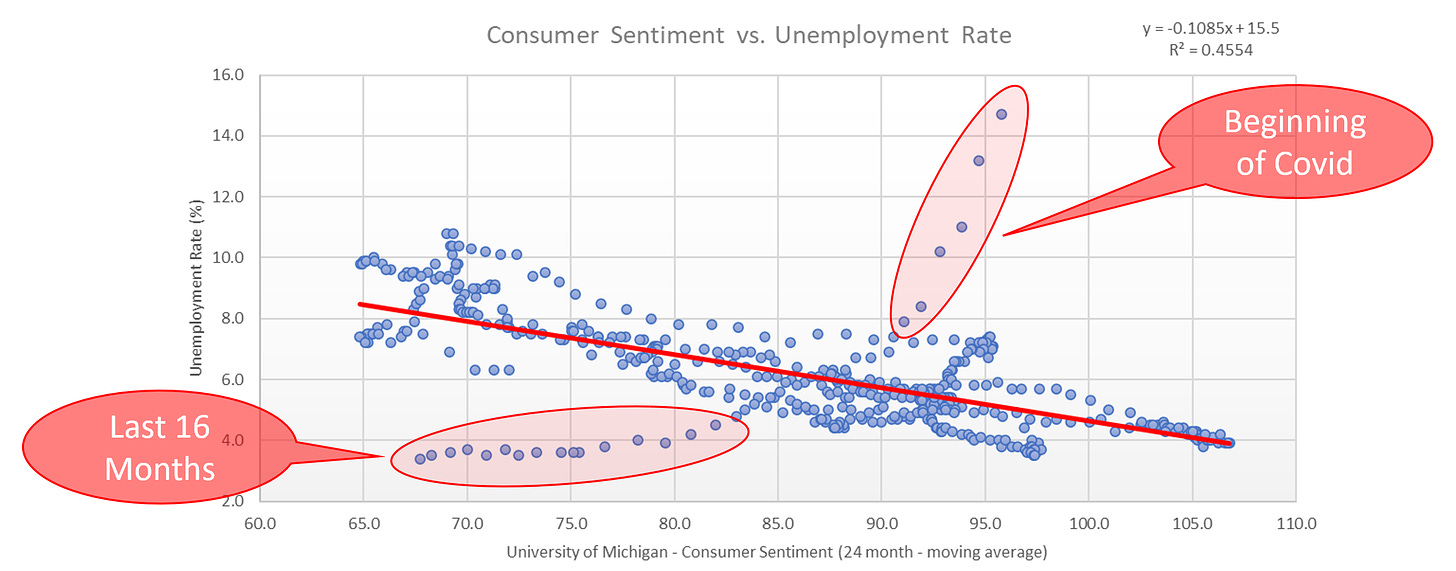
If we dive deeper into the origin of these anomalies, we find that one likely caused the other, which is often the case when we see the pendulum swing from one extreme to another.

Why Is This Important?
The first “distortion” results from the period immediately following the beginning of Covid, where the Unemployment Rate spiked, yet we didn’t see a massive drop-off in consumer sentiment.
Fast forward, and we see the pendulum swing in the opposite direction, as evidenced by the last 16 months. During this time, we’ve witnessed record-low levels of unemployment even though “sentiment” in the US economy has begun to sour.
It’s common to see dramatic swings like this from one extreme to another until the market returns to equilibrium.
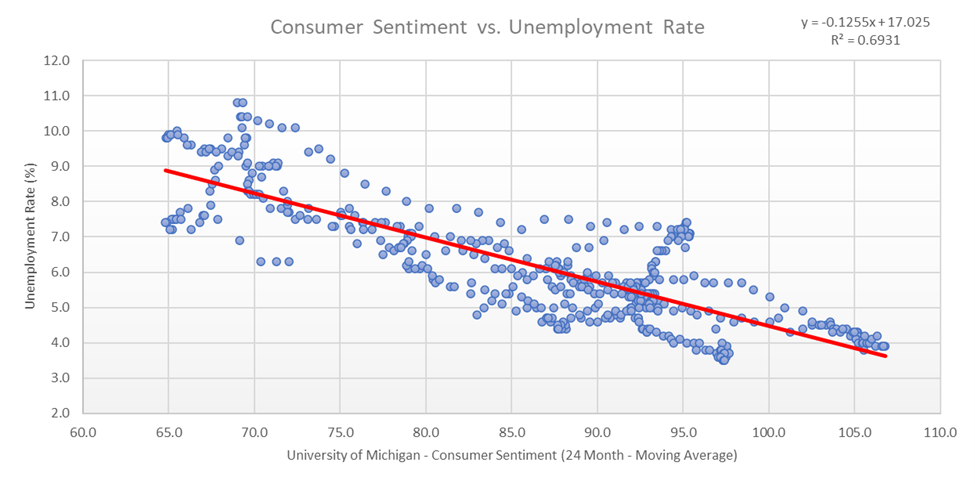
We get the scatter plot below if we strip out these two outlier periods. Note that this scatter plot has an r-squared value of 0.6931 which is statistically very strong, thus suggesting a reasonably tight relationship between these two metrics.
The current value for the University of Michigan Consumer Sentiment Index – 24 Month Moving Average (67.3) suggests that the current Unemployment Rate should be between 7.0% and 10.0%.
In my piece, Layoffs…What Are They Telling Us? I made the case that even the FOMC believes that the Unemployment Rate will increase, as they foreshadowed in their “Summary of Economic Projections” released in December.

How High Will The Unemployment Rate Go?
I don’t know how high the unemployment rate will go. However, as noted above, the current reading for the University of Michigan Consumer Sentiment Index – 24 Month Moving Average would suggest that the Unemployment Rate should be somewhere in the 7.0% – 10.0% range.
Alternatively, what if, in the coming months, we see a dramatic improvement in the University of Michigan Consumer Sentiment Index – 24 Month Moving Average, somewhere directionally towards its long-term average of ~86? You can see from the chart above that a value of 86 has historically corresponded to an unemployment rate of 5.0% – 7.0%.
Given that the Unemployment Rate is currently 3.4%, the University of Michigan Consumer Sentiment Index would suggest it “needs” to go higher. Is it going to 7.0% – 10.0%? I certainly hope not, but the high end for the FOMC’s range of outcomes for 2023 is 5.3%, so maybe the 5.0% – 7.0% range is at least within the realm of possibilities.
As noted in “Layoffs…What Are They Telling Us?”:
“Since the 1950’s, every time the unemployment rate had a sustained increase above its 12-month moving average, a recession has occurred.”
I followed by saying:
“The current unemployment rate is 3.4% and the current 12-month moving average is 3.59%. If the FOMC is even directionally correct in their assessment of where the unemployment rate is heading in 2023, and subsequent years, the unemployment rate will easily cross above its 12-month moving average and will likely be sustained there for a period of time.”
Not to be draconian, but the takeaway is that we’re heading for a recession, and the University of Michigan Consumer Sentiment Index gives you advanced notice.
The question then becomes, “What should I do with this information?”.
I would remind you of this historical fact:
“If we look at history, we find that since the 1960’s, the S&P 500 has always made a new low once a recession began and the average decline from the start of a recession to the market trough is -29.2%. Further, if we look at this same time period, we find that the average decline from the first FOMC rate cut to the market trough is -27.7%.”
It’s not too late to prepare for this potential outcome.
Until next time…

