Inside This Week’s Bull Bear Report
- Technical Analysis Of The Market
- How We Are Trading It
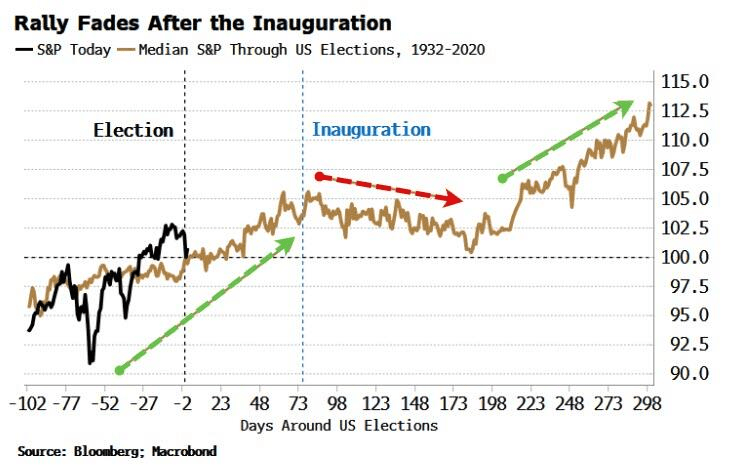
- Research Report –Election Opportunities For Investors
- Youtube – Before The Bell
- Market Statistics
- Stock Screens
- Portfolio Trades This Week
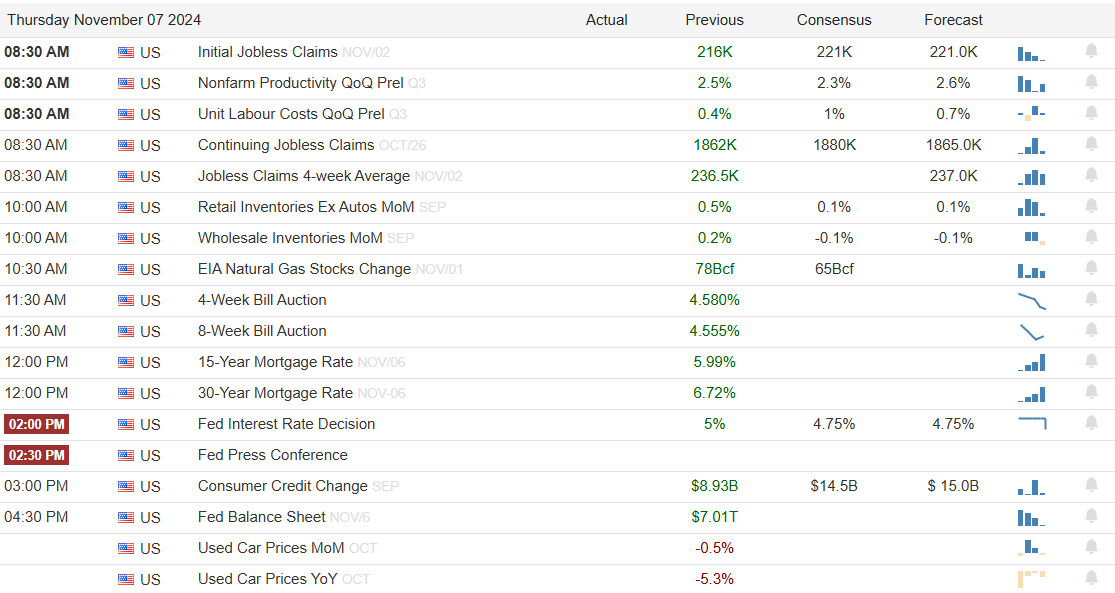
Employment Report Stronger Than Expected
Last week, we discussed the decline in consumer confidence as economic growth continues to slow. As we showed, whenever the spread between present and future expectations surges, such has historically coincided with the onset of a recession.

However, on Friday, the latest employment report from the Bureau of Labor Statistics (BLS) quelled any concerns of a near-term recession. While overall employment printed an astonishing 245,000 jobs, a massive chunk of those jobs were from Government hiring and seasonal adjustments.
“In September, the number of government workers as tracked by the Household Survey soared by 785K, from 21.421 million to 22.216 million, both seasonally adjusted (source: Table A8 from the jobs report). This was the biggest monthly surge in government workers on record (excluding the outlier print in June 2020, which was a reversal of the record plunge from the previous Covid collapse).” – Zerohedge

Nonetheless, the increase in employment suggests the economy continues to grow, and the risk of a recessionary downturn remains muted. Unfortunately, it also eliminates the possibility of another 50-bps rate cut by the Federal Reserve next month. The current probability for a 25-bps cut is now 99%.
While the markets have recently risen in anticipation of a more aggressive rate-cutting cycle, recent data may start to reverse some of that optimism. Such could already be in process, as the market struggled after setting new highs last week.
Notably, with the “Dockworkers” strike at least temporarily behind us, such allows traders to begin focusing their attention on the upcoming Presidential election, not to mention earnings season starting next week.
Let’s review the technical analysis behind the current market environment.
Need Help With Your Investing Strategy?
Are you looking for complete financial, insurance, and estate planning? Need a risk-managed portfolio management strategy to grow and protect your savings? Whatever your needs are, we are here to help.

Millennial Earnings Season Begins
Before we discuss the bullish and bearish cases for the S&P 500 based solely on technical analysis, I would be remiss not to mention that “Millennial Earnings Season” will be a significant market driver over the next month.
“As we have discussed, it will be unsurprising that we will see a high percentage of companies ‘beat’ Wall Street estimates. Of course, the high beat rate is always the case due to the sharp downward revisions in analysts’ estimates as the reporting period begins.”
The chart below shows the changes for the Q3 earnings period from when analysts provided their first estimates in March 2023. Analysts have slashed estimates over the last 30 days, dropping estimates by roughly $3.40/share, but nearly $18 lower than their initial estimate.
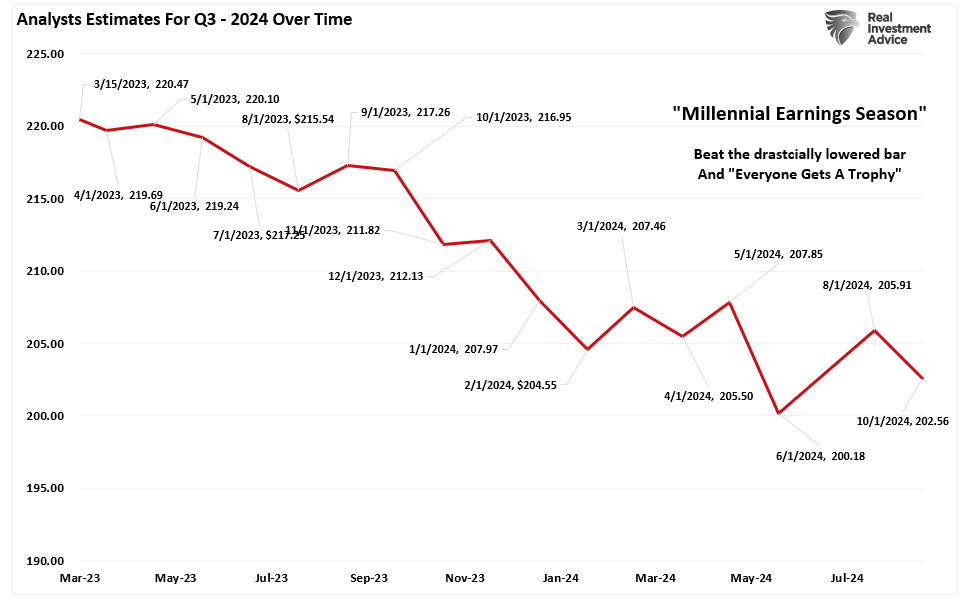
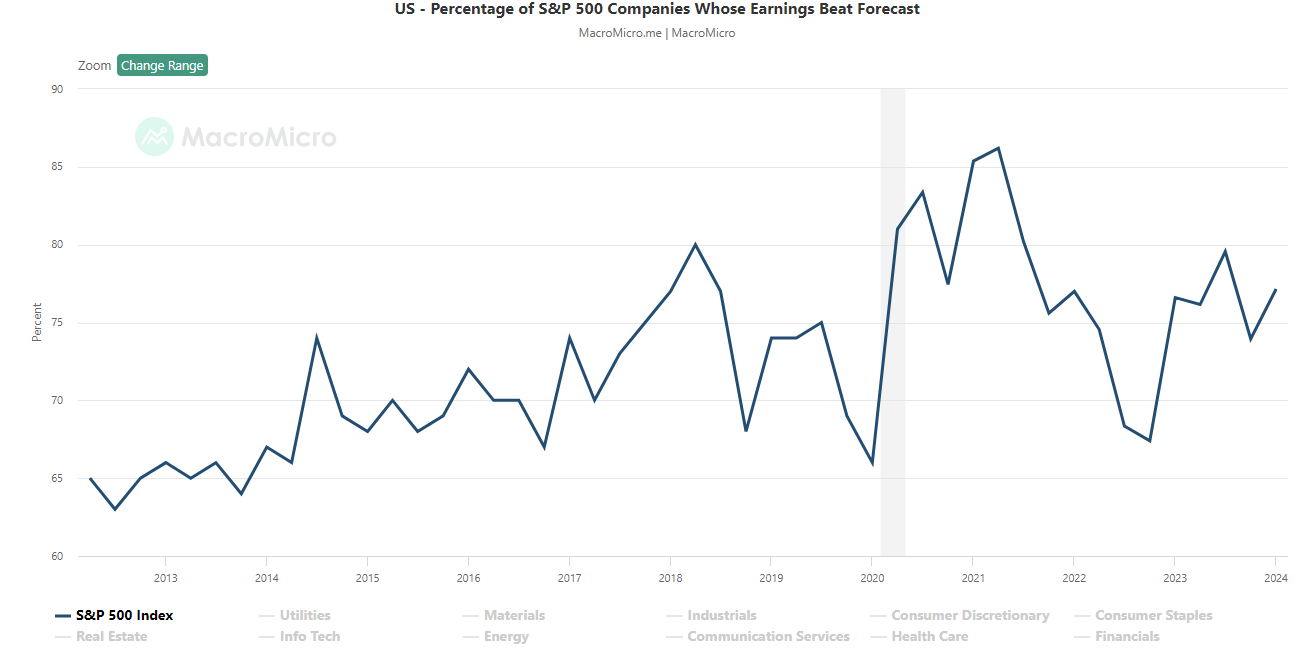
That is why we call it “Millennial Earnings Season.” Wall Street continuously lowers estimates as the reporting period approaches so “everyone gets a trophy.” An easy way to see this is the number of companies beating estimates each quarter, regardless of economic and financial conditions. Since 2000, roughly 70% of companies regularly beat estimates by 5%, but since 2017, that average has risen to approximately 75%. Again, that “beat rate” would be substantially lower if investors held analysts to their original estimates.
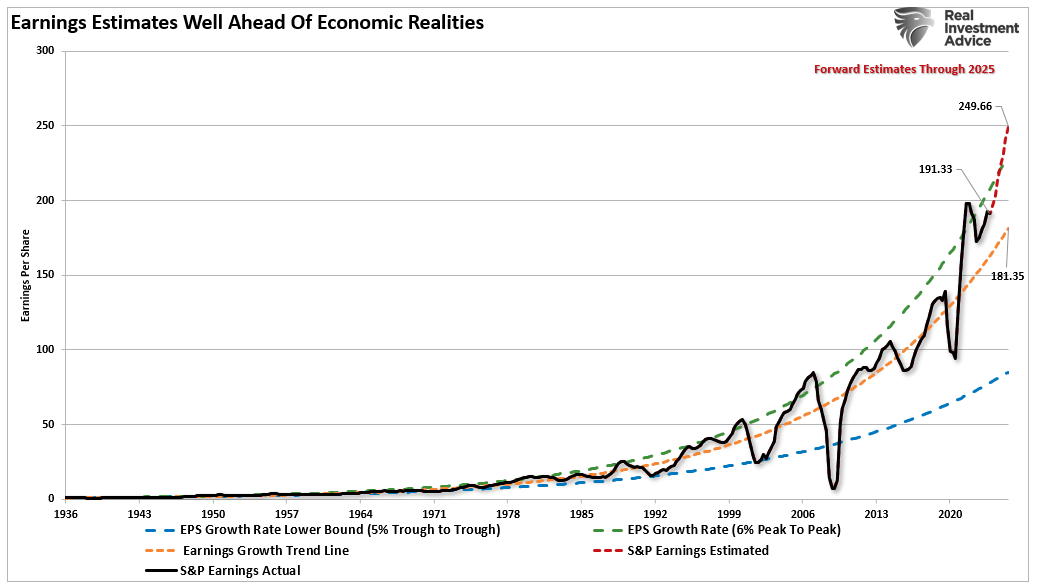
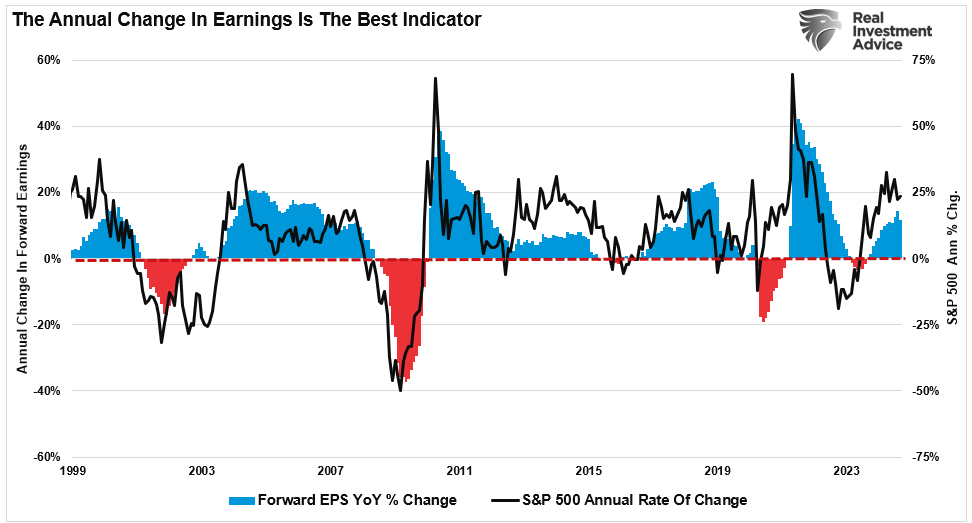
While stock markets are hitting all-time highs, and analysts are very optimistic about earnings into 2025, actual earnings have fallen well short of previous estimates. In other words, investors have overpaid for promised earnings growth that was not delivered.

However, even with the earnings bar lowered going forward, earnings estimates remain detached from the long-term growth trend.
As discussed previously, economic growth, from which companies derive revenue and earnings, must also strongly grow for earnings to grow at such an expected pace.
Since 1947, earnings per share have grown at 7.72%, while the economy has expanded by 6.35% annually. That close relationship in growth rates is logical, given the significant role that consumer spending has in the GDP equation. However, while nominal stock prices have averaged 9.35% (including dividends), reversions to underlying economic growth will eventually occur. Such is because corporate earnings are a function of consumptive spending, corporate investments, imports, and exports. The same goes for corporate profits, where stock prices have significantly deviated.
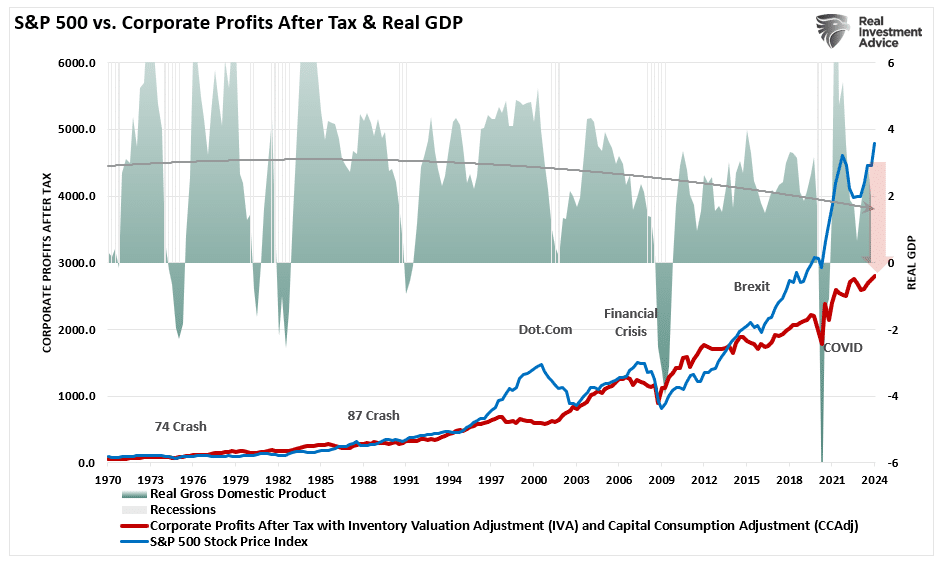
Such is essential to investors due to the coming impact on “valuations.”
Given current economic assessments from Wall Street to the Federal Reserve, strong growth rates are unlikely. The data also suggest a reversion to the mean is entirely possible.
Which is where technical analysis is worth reviewing.
Technical Analysis Of The S&P 500
As we enter the final quarter of 2024, the S&P 500 recently touched a new all-time high of 5760. While this surge has many investors feeling optimistic, technical analysis shows some risks to the rally. This week, we will explore three technical bullish indicators that suggest further upward momentum and three bearish patterns that could signal potential downside risks before year-end. As always, this analysis is rooted purely in the charts, without any fundamental biases, and is intended to help you make more informed, short-term investment decisions.
Note: We are fundamental investors looking for long-term investment opportunities at RIA Advisors. Therefore, we use very simplistic technical analysis to manage short-term market risks in our portfolios. We have found through experience that the more complicated we make the technical analysis, the worse decisions we make due to “analysis paralysis.” As is always the case, everyone approaches investing differently. This is just how we do it.
The Bullish Case for the S&P 500
1. Breakout Above Key Resistance Level
The most compelling bullish argument lies in the recent breakout above the 5700–5750 resistance zone. This region has historically been a psychological barrier for the market, and breaking through this level is a sign of strong buying momentum. When resistance levels are breached, it often signals further upside, as previous sellers give way to new buyers stepping in. According to technical theory, a breakout at such high levels often triggers a “buy the breakout” mentality, drawing more capital into the market and driving prices higher. A pullback to retest that previous breakout level is needed to confirm the breakout’s validity. The current correction is working through that process, and with recent support holding, a move to new record highs will confirm the breakout.
Furthermore, as discussed last week, the breakout to new highs also completed a short-term technical “cup and handle” pattern, which suggests further upside with a year-end target of 6000. To wit:
“That pattern seems quite evident in the following chart of the S&P 500 index. With the breakout of the “cup and handle” formation in place, a further rally into year-end seems to be the logical next step. Such suggests that any near-term correction to relieve overbought conditions should remain confined to the bullish trend. In other words, investors should consider buying any near-term declines.”
That formation tends to be bullish, and given the continued increase in investor sentiment, further highs are likely.
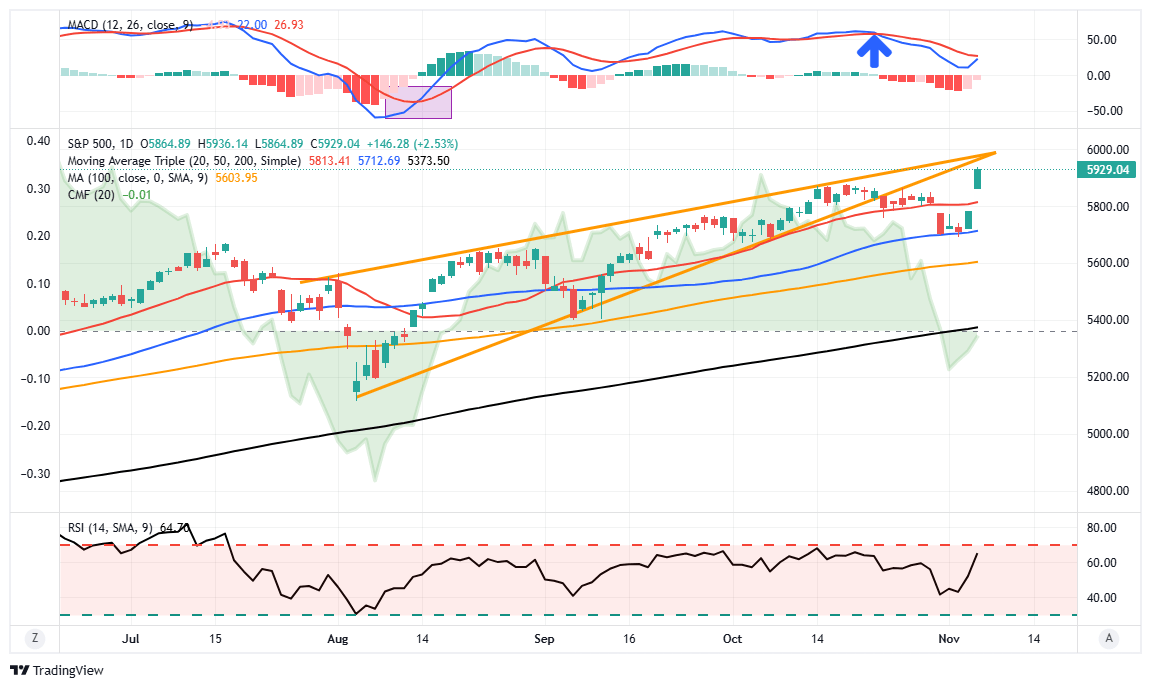
2. Ascending Triangle Pattern
An ascending triangle is forming on the daily charts, another bullish pattern that typically signals further upward movement. In this case, we’ve seen a series of higher lows in recent weeks, indicating buyers are stepping in earlier during each pullback. The flatter upper trendline from the previous to the recent all-time high indicates an ongoing increase in buying pressure.

In the current environment, pullbacks should be confined to the rising trend line from the previous lows, with the 20-DMA and the August rally highs acting as key support levels for any pullback. However, there is a bearish side to this pattern as well, where a break below that rising trendline would suggest a deeper pullback is underway. More on that in a moment.
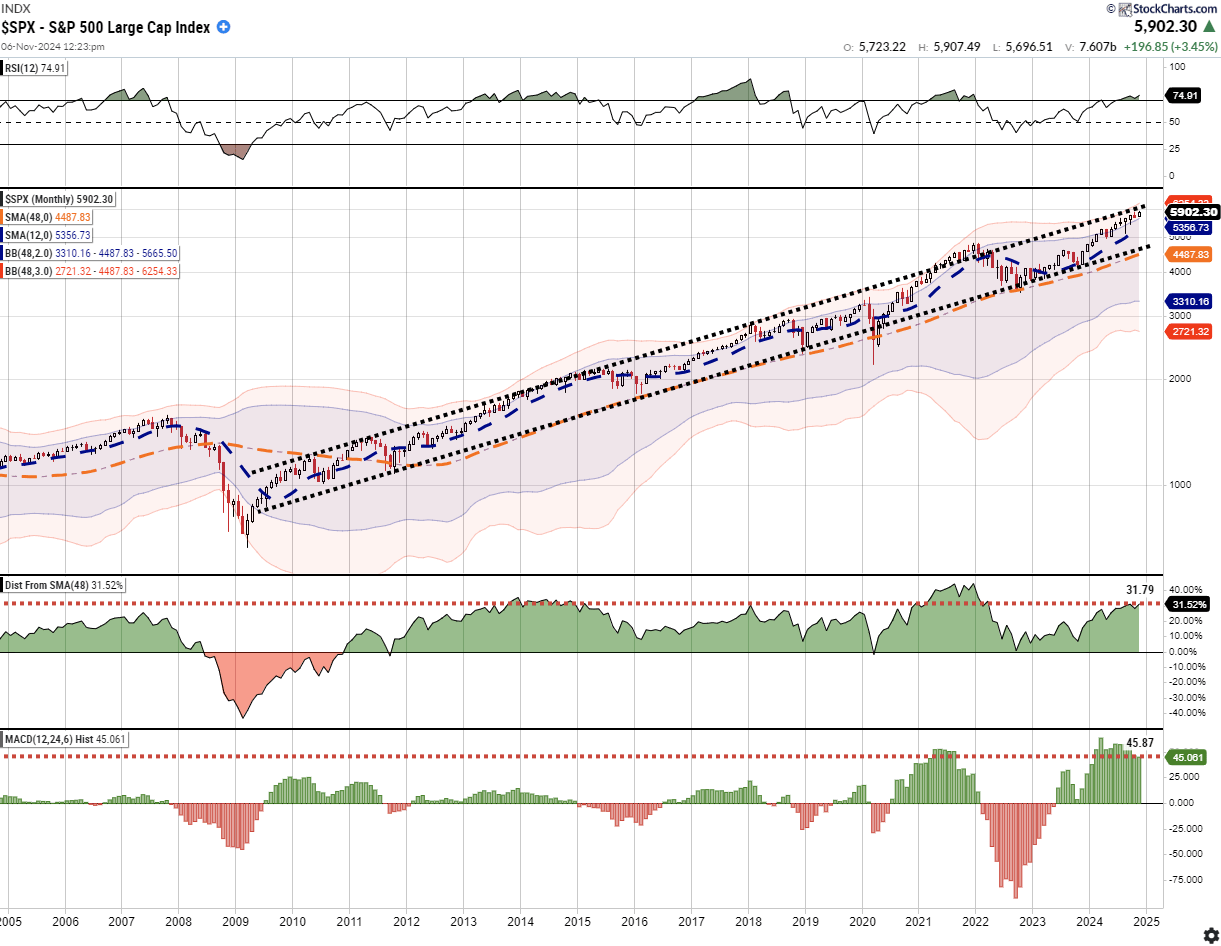
3. Positive Divergence on RSI and MACD
Lastly, another important bullish signal comes from momentum indicators, specifically the Relative Strength Index (RSI) and Moving Average Convergence Divergence (MACD). Over the past few weeks, the S&P 500 has seen positive divergence on both indicators. While price action has continued to grind higher, the RSI and MACD have been making higher lows, suggesting that underlying strength is building despite some minor pullbacks in the index.
This positive divergence is typically an early signal of continued upward momentum. When momentum indicators show strength while the market consolidates or pulls back slightly, it often precedes a larger move higher. If this divergence holds, it should support a post-election rally towards our year-end price target of 6000.
That is the bullish case. Let’s now review the bearish case.
The Bearish Case for the S&P 500
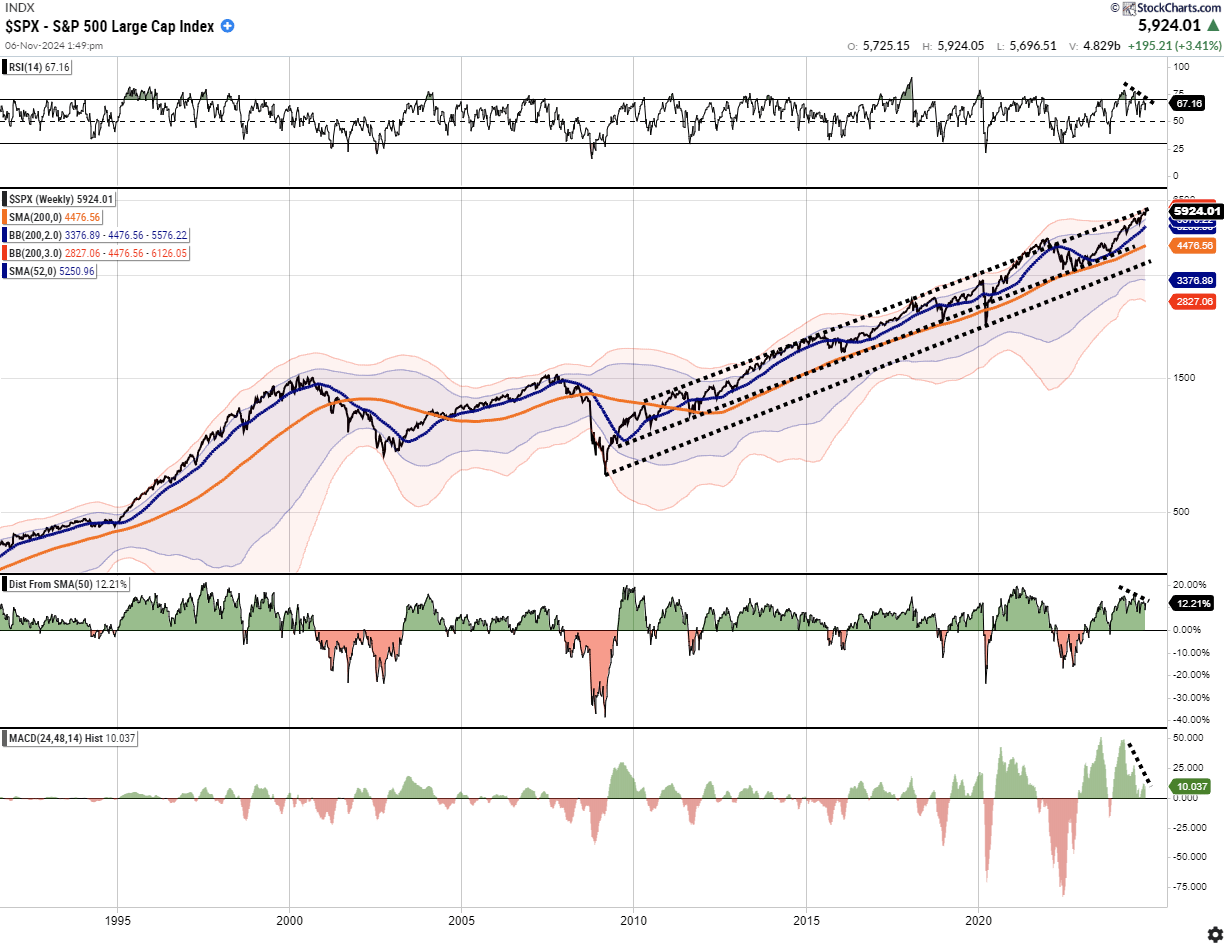
1. Negative Divergence On The Weekly RSI
While momentum and relative strength indicators show a positive divergence using daily technical analysis, the RSI (Relative Strength Index) also signals some caution with a negative weekly divergence. While the market has risen, weekly relative strength measures have declined, suggesting an underlying deterioration. Historically, such negative divergences precede short—to intermediate-term corrections.
In June, we discussed this same concern just before the August decline.
“As discussed, these negative divergences have often preceded short to intermediate-term corrective market actions. At this point, investors tend to make two mistakes. The first is overreacting to these technical signals, thinking a more severe correction is coming. The second is taking action too soon.
Yes, these signals often precede corrections, but there are also periods of consolidation when the market trades sideways. Secondly, reversals of overbought conditions tend to be shallow in a momentum-driven bullish market. These corrections often find support at the 20 and 50-day moving averages (DMA), but the 100 and 200-DMAs are not outside regular corrective periods.“
As noted above, there are two important lessons about technical analysis. While negative divergences often precede corrections, they are short-lived before markets resume their upward trend. Therefore, using weekly technical analysis, such a pullback would likely be contained, as it has been, to the 20-week moving average, which currently resides at 5600, or the 50-week moving average, which resides at 5200.
2. Bearish Divergence in Volume
While volume confirmed the initial breakout above resistance, recent price action has been accompanied by declining volume—a classic bearish divergence signal. In technical analysis, when price moves higher but volume trends lower, it suggests that fewer participants are pushing the market upward. This type of divergence often precedes reversals, as the lack of volume suggests a weakening in buyer conviction.

As we discussed last week in the “Everything Market:”
“The stock market is always a function of buyers and sellers, each negotiating to make a transaction. While there is a buyer for every seller, the question is always at “what price?”
In the current bull market, few people are willing to sell, so buyers must keep bidding up prices to attract a seller to make a transaction. As long as this remains the case and exuberance exceeds logic, buyers will continue to pay higher prices to get into the positions they want to own.
Such is the very definition of the “greater fool” theory.“
In other words, “Sellers live higher. Buyers live lower. “
If volume continues to decline, it could signal that the current rally is running out of steam. In this case, we could see a “bull trap,” where prices temporarily spike higher before reversing sharply. Traders and investors should closely watch volume trends over the next few weeks for confirmation of this potential bearish setup.
3. MACD Closing In On A Sell Signal
In the short term, the Moving Average Convergence Divergence (MACD) is close to triggering a sell signal. Such is unsurprising given the bearish divergence concerning volume as buyers become exhausted. While the sell signal does not mean a major correction is at hand, it does suggest a pick-up in volatility is likely, and a retracement to previous support levels is likely.
If the market breaks down, there is a risk that the S&P 500 will retreat to test its previous support at 5500, where the 100-DMA currently resides. A pullback of that magnitude will reset the current overbought conditions and provide the backdrop for a year-end rally.
Navigating the Market Between Now and Year-End
The S&P 500’s previous all-time high of 5760 presents opportunity and risk. On the bullish side, the market has broken through significant resistance, is forming a strong ascending triangle pattern, and is supported by positive momentum divergence. On the bearish side, weekly negative RSI and bearish volume divergence suggest possible downside risks.
These mixed signals suggest that caution is warranted for investors and traders. While there may be further upside potential, the technical signs of an impending correction should not be ignored. One potential strategy could be trailing stops on long positions, ensuring that gains are locked in while allowing for upside participation. Additionally, hedging strategies or reducing exposure may be prudent for those concerned about a market pullback.
At this juncture, the market is at a critical crossroads. Will the bulls continue to drive the S&P 500 to new heights, or will the bears finally take control as overbought conditions catch up with the market? Only time—and the charts—will tell.
If you are long equities in the current market, rebalancing risk is manageable.
- Tighten up stop-loss levels to current support levels for each position.
- Hedge portfolios against major market declines.
- Take profits in positions that have been big winners
- Sell laggards and losers
- Raise cash and rebalance portfolios to target weightings.
Notice, nothing in there says “sell everything and go to cash.”
Remember, our job as investors is pretty simple – protect our investment capital from short-term destruction so we can play the long-term investment game.
Feel free to reach out if you want to navigate these uncertain waters with expert guidance. Our team specializes in helping clients make informed decisions in today’s volatile markets.
Have a great week.
Research Report
Subscribe To “Before The Bell” For Daily Trading Updates
We have set up a separate channel JUST for our short daily market updates. Please subscribe to THIS CHANNEL to receive daily notifications before the market opens.
Click Here And Then Click The SUBSCRIBE Button
Subscribe To Our YouTube Channel To Get Notified Of All Our Videos
Bull Bear Report Market Statistics & Screens

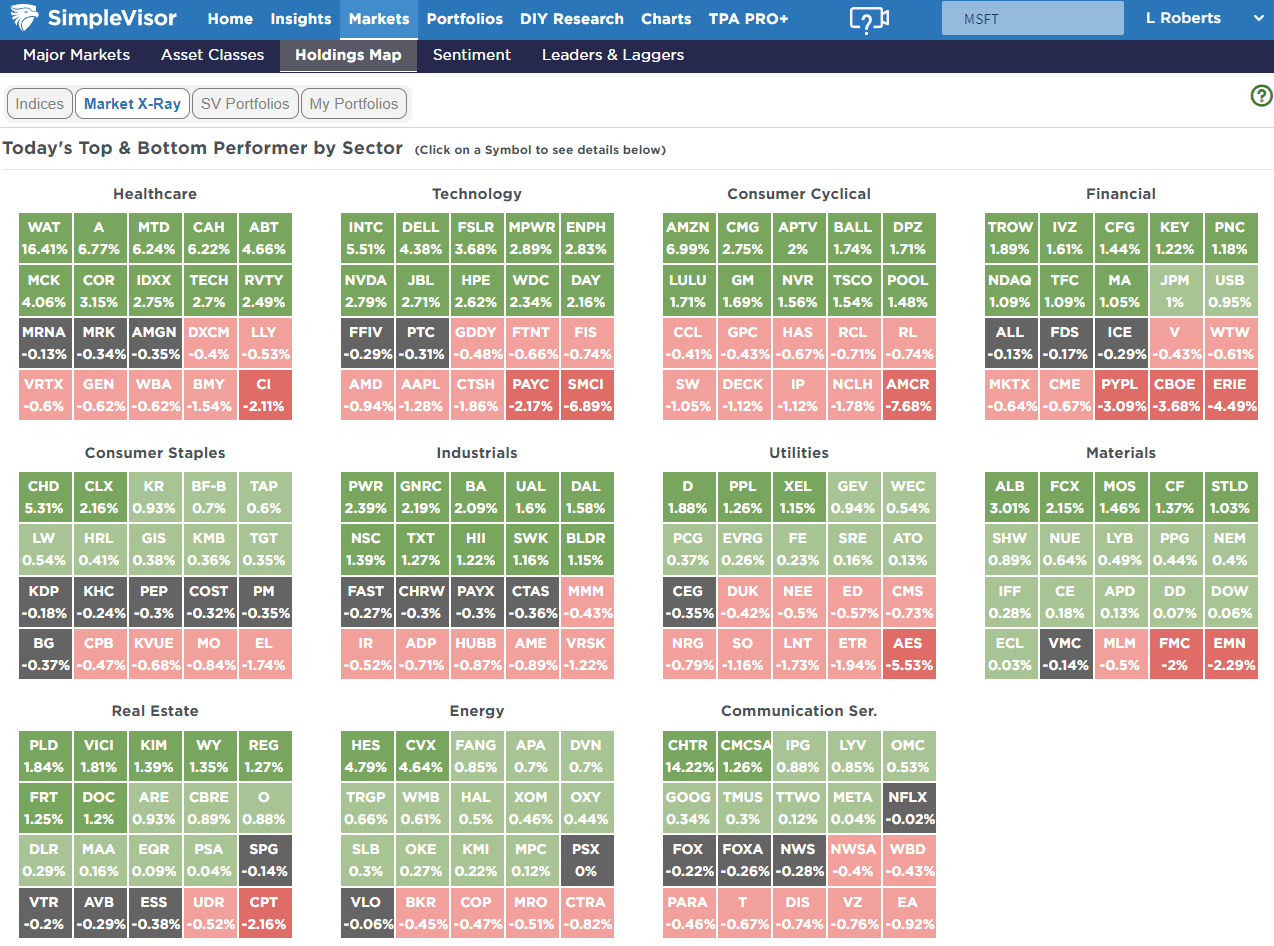
SimpleVisor Top & Bottom Performers By Sector
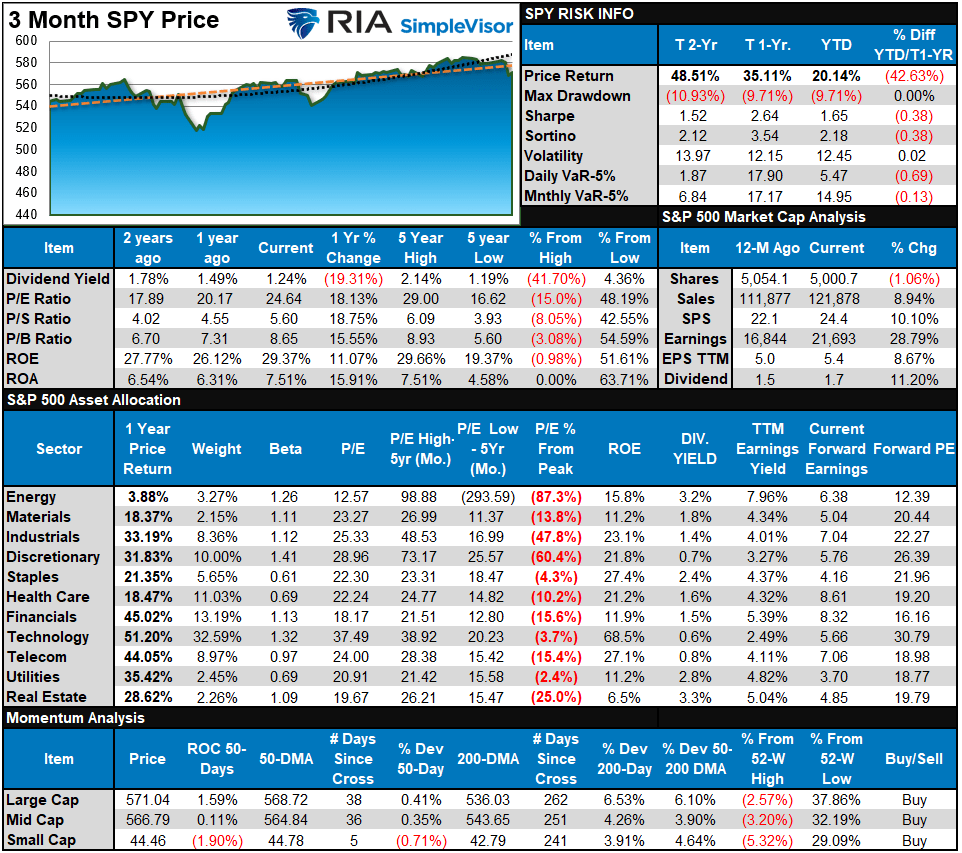
S&P 500 Weekly Tear Sheet
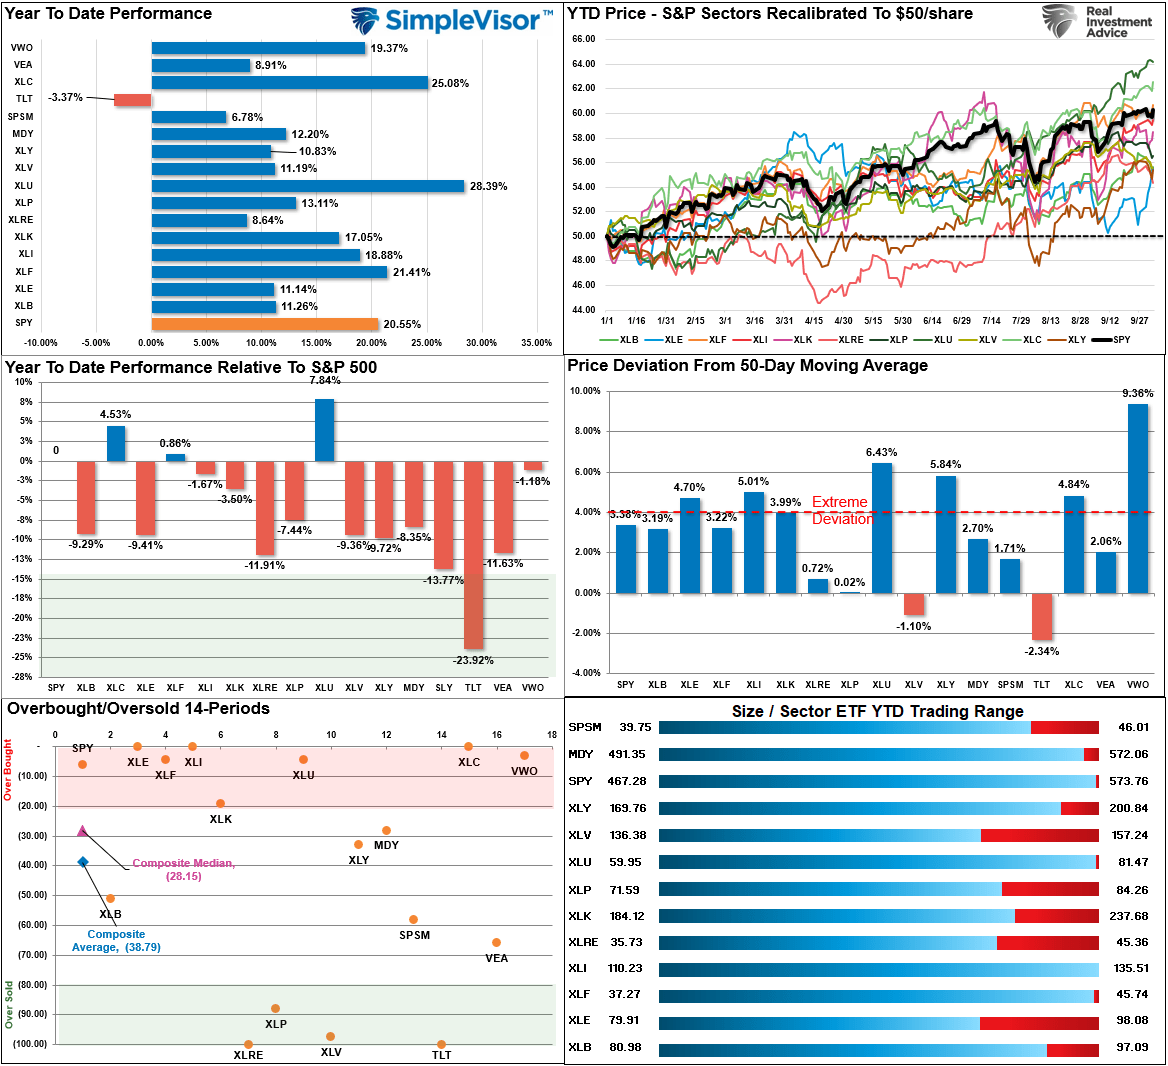
Relative Performance Analysis
We noted last week that “With the market up 20% year-to-date, I would not be surprised to see some consolidation or a small correction between today and the election.”
This past week saw a small pullback heading into the employment report on Friday, where the market bounced off the previous “breakout” levels. As noted in the technical analysis above, that confirmed breakout suggests the bullish trend remains intact. However, with many sectors in more overbought territory, we should expect to see a rotation back into bonds, staples, real estate, and healthcare, given those oversold conditions.
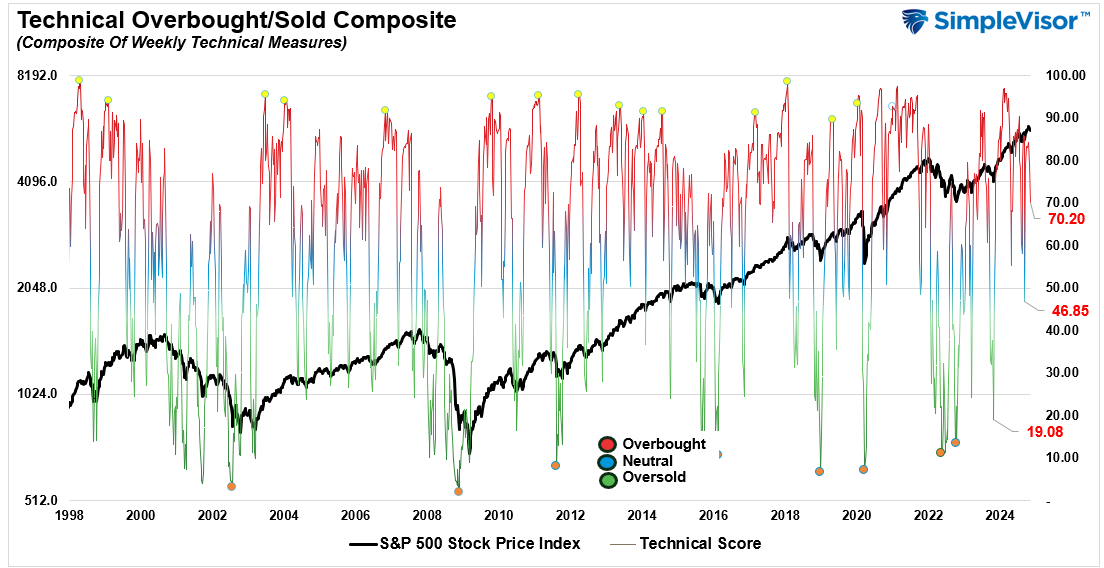
Technical Composite
The technical overbought/sold gauge comprises several price indicators (R.S.I., Williams %R, etc.), measured using “weekly” closing price data. Readings above “80” are considered overbought, and below “20” are oversold. The market peaks when those readings are 80 or above, suggesting prudent profit-taking and risk management. The best buying opportunities exist when those readings are 20 or below.
The current reading is 83.05 out of a possible 100.
Portfolio Positioning “Fear / Greed” Gauge
The “Fear/Greed” gauge is how individual and professional investors are “positioning” themselves in the market based on their equity exposure. From a contrarian position, the higher the allocation to equities, the more likely the market is closer to a correction than not. The gauge uses weekly closing data.
NOTE: The Fear/Greed Index measures risk from 0 to 100. It is a rarity that it reaches levels above 90. The current reading is 81.53 out of a possible 100.

Relative Sector Analysis
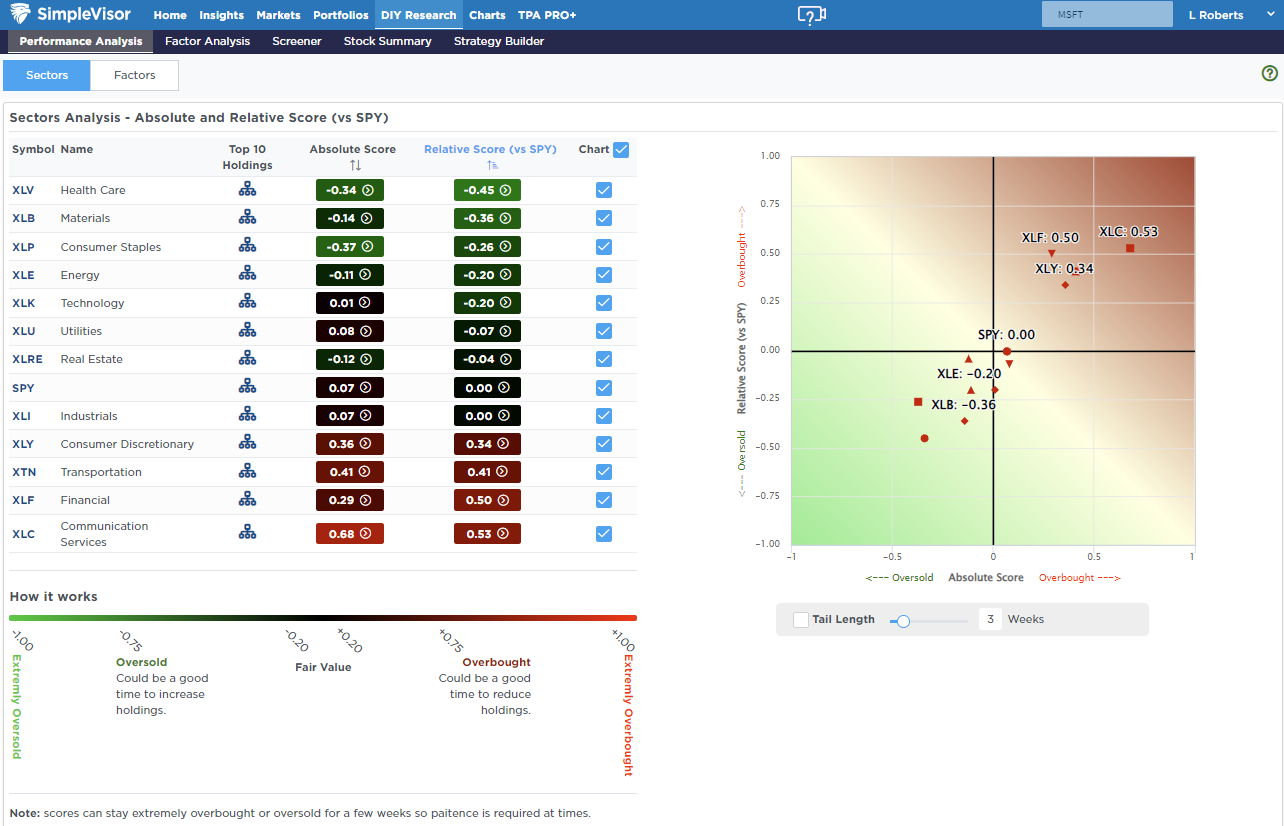
Most Oversold Sector Analysis

Sector Model Analysis & Risk Ranges
How To Read This Table
- The table compares the relative performance of each sector and market to the S&P 500 index.
- “MA XVER” (Moving Average Crossover) is determined by the short-term weekly moving average crossing positively or negatively with the long-term weekly moving average.
- The risk range is a function of the month-end closing price and the “beta” of the sector or market. (Ranges reset on the 1st of each month)
- The table shows the price deviation above and below the weekly moving averages.
As noted last week, “Utilities, Real Estate, Gold, and Gold Miners are overbought, pushing double-digit deviations. Take profits in these sectors and rebalance accordingly, as they will pull back. On the other hand, Energy is extremely oversold, and we are likely near a tradeable opportunity in that space.”
That turned out to be sage advice. The same remains true this week. While some previously overbought conditions remain, bonds and energy are becoming more attractive for trading opportunities. With almost all sectors on bullish crossovers, the bias is to the upside, so maintain equity exposure relative to your risk tolerance.

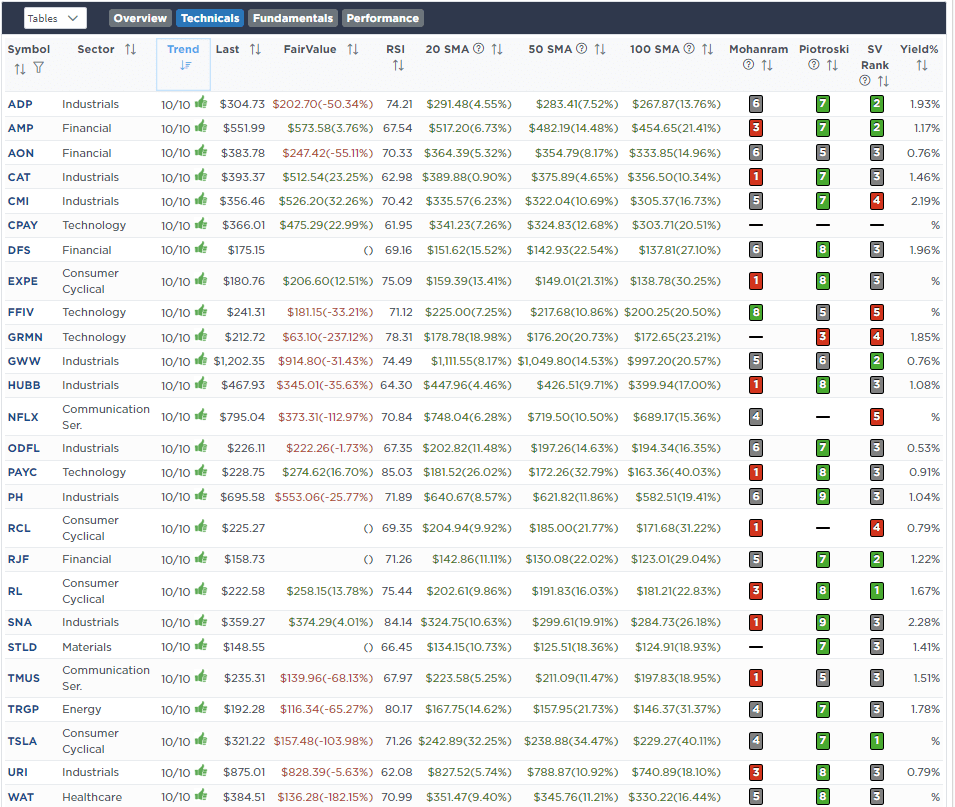
Weekly SimpleVisor Stock Screens
We provide three stock screens each week from SimpleVisor.
This week, we are searching for the Top 20:
- Relative Strength Stocks
- Momentum Stocks
- Fundamental & Technical Strength W/ Dividends
(Click Images To Enlarge)
RSI Screen

Momentum Screen

Fundamental & Technical Screen
SimpleVisor Portfolio Changes
We post all of our portfolio changes as they occur at SimpleVisor:
Oct 1st
“In August, we sold Phillip Morris (PM) due to its incredible run this year to take profits. However, PM and its sister company, Altria (MO), have made decent corrections since that sale and worked off much of that previous overbought condition. At the same time, one of the underperforming companies with a lower dividend yield also rose with the recent market rampage, allowing us to swap a 2.11% yield for a 7.9% yield in the portfolio with MO.”
Dividend Equity Model
- Sell 100% of Fastnel (FAST)
- Buy 1.5% of the portfolio in Altria (MO)
Oct 3rd
“As we discussed this morning during the RealInvestmentShow Podcast, Utilities, and Real Estate have become very overbought following the runup to the first Fed rate cut. As such, our positions have become overweight relative to our target allocations. We are going to take the opportunity to rebalance the portfolio a bit and reduce Duke Energy and the SPDR Utility ETF back to the target weight.
We are also adding to our position in Annaly (NLY), which fell in price following its recent dividend distribution. We are adding to the iShares Mortage Real Estate ETF (REM) in the ETF Model. With the Fed cutting rates and mortgage refinancing gaining some traction, the distribution decline allows us to increase our position to a target weight of 2% of the portfolio.”
Equity Model
- Reduce DUK to 3.5% of the portfolio.
- Increase NLY to 2% of the portfolio.
ETF Model
- Reduce the SPDR Utility ETF (XLU) to 3% of the portfolio.
- Increase REM To 2% of the portfolio.
Lance Roberts, C.I.O.
Have a great week!

