
🔎 At a Glance
- US Economic Growth Shows Cracks
- Fragile Prospects For The Rest Of 2025
- Portfolio Tactics For Next Week
- From Lance’s Desk: Debt & Deficits Are Not The Problem You Think
- Portfolio updates & sector strategy shifts
- Market stats, screens, and risk indicators
💬 Ask a Question
Have a question about the markets, your portfolio, or a topic you’d like us to cover in a future newsletter?
📩 Email: lance@riaadvisors.com
🐦 Follow & DM on X: @LanceRoberts
📰 Subscribe on Substack: @LanceRoberts
We read every message and may feature your question in next week’s issue!
🏛️ Market Brief
This past week, markets were driven by trade policy shocks, monetary policy developments, and solid corporate earnings, creating a push-and-pull dynamic for investor sentiment. President Trump’s announcement of sweeping “reciprocal” tariffs, doubling duties on Indian imports and imposing broad levies on semiconductors and pharmaceuticals, rekindled trade war concerns and injected fresh geopolitical risk into the outlook. However, that was offset by Apple’s announcement that it would inject $600 billion into building factories in the U.S. to bypass those tariffs. The positive response to Apple’s deal with the White House sent the stock and the Nasdaq higher on the week.
The policy backdrop shifted further when Trump nominated Stephen Miran to the Federal Reserve, a move widely interpreted as signaling a more dovish tilt and raising expectations for possible rate cuts. Overseas, the Bank of England delivered a 25-basis-point cut, dropping its rate to 4%, though its narrow 5–4 split vote underscored internal divisions and the challenges of managing policy amid stagflation pressures.
On the corporate front, earnings season is winding down but has provided pockets of support and disappointment. Earnings beats received a muted reaction. Companies beating estimates only outperformed by 55 bp vs. the 101 bp historical average. That lack of performance was likely due to overly low analyst expectations. Meanwhile, earnings misses are being punished nearly twice as much as usual.

📈Technical Backdrop
After a sharp reversal from record highs last week, the S&P 500 struggled this week with a fragile technical profile, but not yet a broken one. The index’s retreat from the 6,350 area has pulled it back inside the rising channel that has defined advance since May, after testing the bottom of that trend channel last Friday. This week was marked by a choppy, up-and-down advance with money flows remaining weak amid a decline in momentum.

Despite the pullback, the longer-term structure remains constructive. The 50-day moving average (~6,200) is still trending higher above the 200-day (~5,900), confirming the primary uptrend. So far, this correction has been modest, with retail buyers stepping in to buy every dip. So far, the market action is more about digestion than a correction. However, despite this week’s relatively bullish action, a retest of the 50-day remains a possibility over the next few weeks.
As noted, momentum signals have softened, the relative strength Index has rolled down from overbought territory and bounced off the neutral 50 level, and money flows are slowing. These signals suggest short-term risk to the bullish narrative until improvement is evident. Market breadth has also narrowed, as shown, with fewer than 60% of S&P 500 stocks above their 50 and 200-day moving averages, highlighting the reliance on mega-cap technology to prop up index levels.

Outlook: Neutral. The uptrend remains intact, but weakening breadth, fading momentum, and elevated volatility warrant a more selective approach. A decisive break below 6,150 would tilt the outlook bearish, while stabilization above that level could quickly restore the bull trend. For now, patience and disciplined risk management are essential.
🔑 Key Catalysts Next Week
After choppy trading action this past week, traders will focus on the CPI and PPI reports, retail sales, and what that means for the Federal Reserve’s monetary policy outlook.

Overall Risk Outlook: Cautiously Bearish
With CPI and PPI poised to test the Fed’s rate-cut narrative, a packed Friday data slate, and geopolitical tensions from tariff deadlines and U.S.–Russia talks, markets face an elevated risk of a pullback given the weaker underlying technicals and seasonal volatility patterns.
Need Help With Your Investing Strategy?
Are you looking for complete financial, insurance, and estate planning? Need a risk-managed portfolio management strategy to grow and protect your savings? Whatever your needs are, we are here to help.

💰 US Economic Growth Shows Cracks
July’s employment report confirmed that the slowdown in US economic growth is taking root. Nonfarm payrolls increased by a mere 73,000 jobs. Expectations were for 110,000. The bigger story is in the revisions. May and June payrolls were slashed by 258,000. That’s the second-largest two-month downward revision since the 2008 recession. When employers stop hiring and previous gains get erased, that is not a data glitch—it’s a signal.

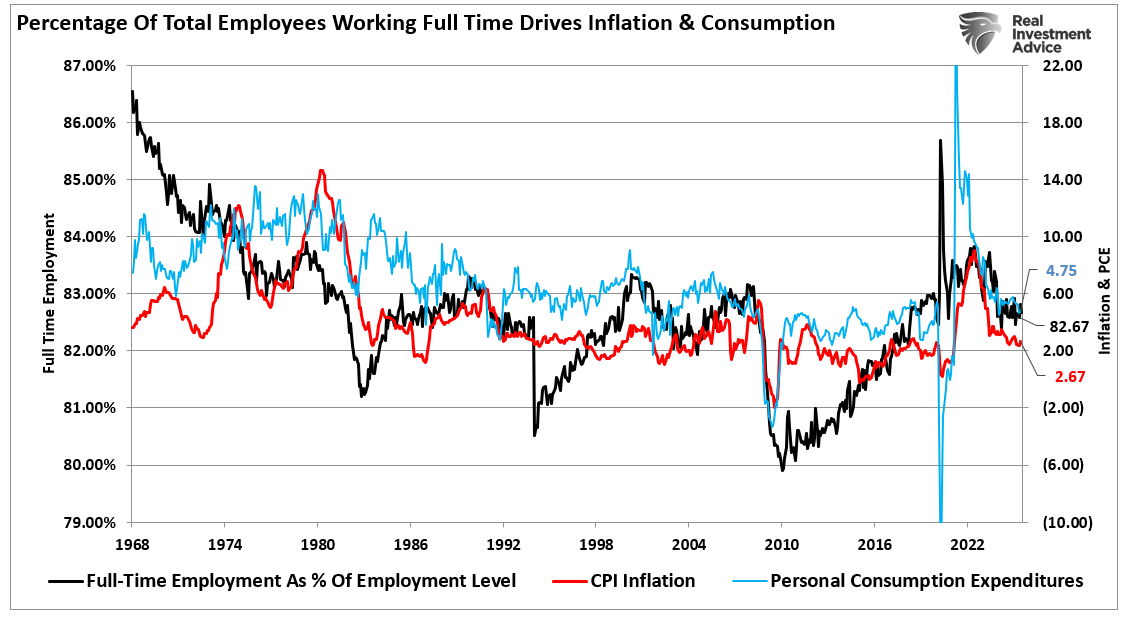
The unemployment rate increased to 4.2 percent, while labor force participation remained at 62.2 percent. While not alarming at face value, the lack of participation growth shows that the working-age population isn’t reentering the workforce in significant numbers. More importantly, full-time employment remains weak as a percentage of total employees, which correlates to the future direction of personal consumption expenditures and inflation. Such is unsurprising given that for individuals to consume at higher levels, they need full-time employment. Without increases in consumption, US economic growth and inflation will decline.
Wage growth is also losing momentum. Average hourly earnings rose 0.3 percent month-over-month, but year-over-year gains slowed to 3.9 percent. This is a problem. Inflation is still hot in services and necessities, eroding real income growth.

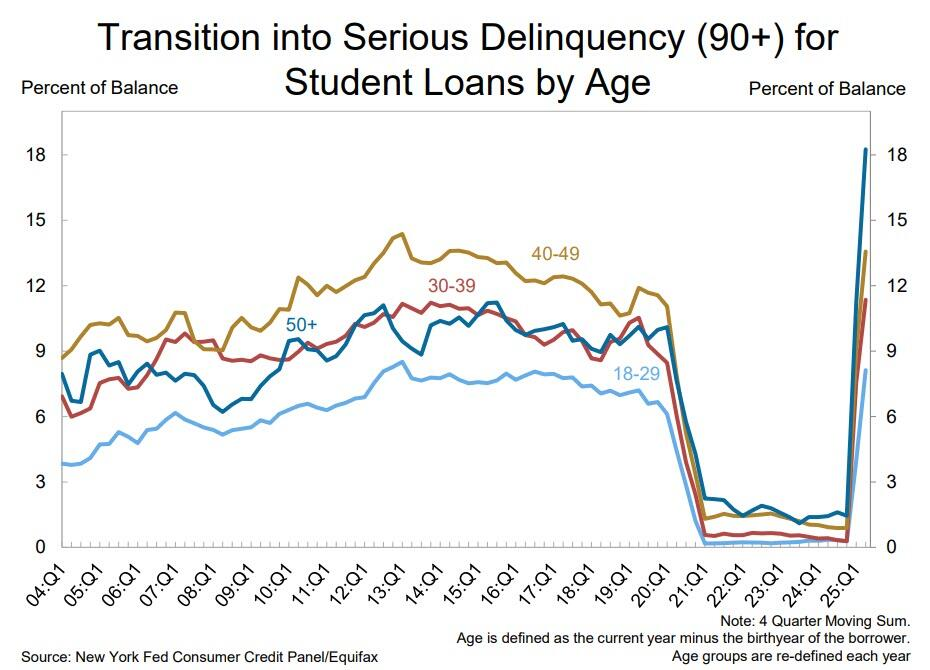
Consequently, households feel the pinch, and discretionary spending will reflect that in the second half of 2025. Such is particularly the case with rising delinquency rates, particularly in student loan debt.
The sector breakdown of job growth shows late-cycle dynamics. Healthcare and government jobs are still being added, but these are non-cyclical. Manufacturing employment declined, reflecting weaker orders and global trade slowdowns. Professional and business services hiring stalled. Furthermore, the labor market is transitioning from a phase of post-pandemic recovery to a structurally slower employment cycle. Businesses are tightening labor expenses as revenue growth slows.
This is not a short-term adjustment; it’s a reset of hiring expectations across multiple sectors. If wage growth continues to moderate and hiring slows, the consumption-driven economy will lose its primary growth engine.
Data Reveals Broad-Based Slowdown
Outside the employment report, July’s ISM Manufacturing Index fell to 48.0, marking five months of contraction. New orders were sluggish, while the employment index plummeted to 43.4 percent. This reading is significant. It indicates companies are actively reducing factory jobs, not simply slowing hiring. The problem is not isolated to manufacturing. The services sector, comprising roughly 70 percent of the U.S. economy, barely holds on. The ISM Services Index registered at 50.1 in July, down from a reading of 50.8 previously. This is technically an expansion reading, but only by the slimmest margin.
The composite index is economically weighted (70% services / 30% manufacturing). It tells us what we already suspected: that the economy is growing, albeit very slowly.

The employment component of services fell to 46.4 percent. When service firms start cutting payrolls, it signifies a more profound weakness in demand. For months, services spending was the buffer against manufacturing softness. That buffer is eroding as input costs have risen. Businesses face increasing operational expenses while revenue growth stagnates, a recipe for margin compression.
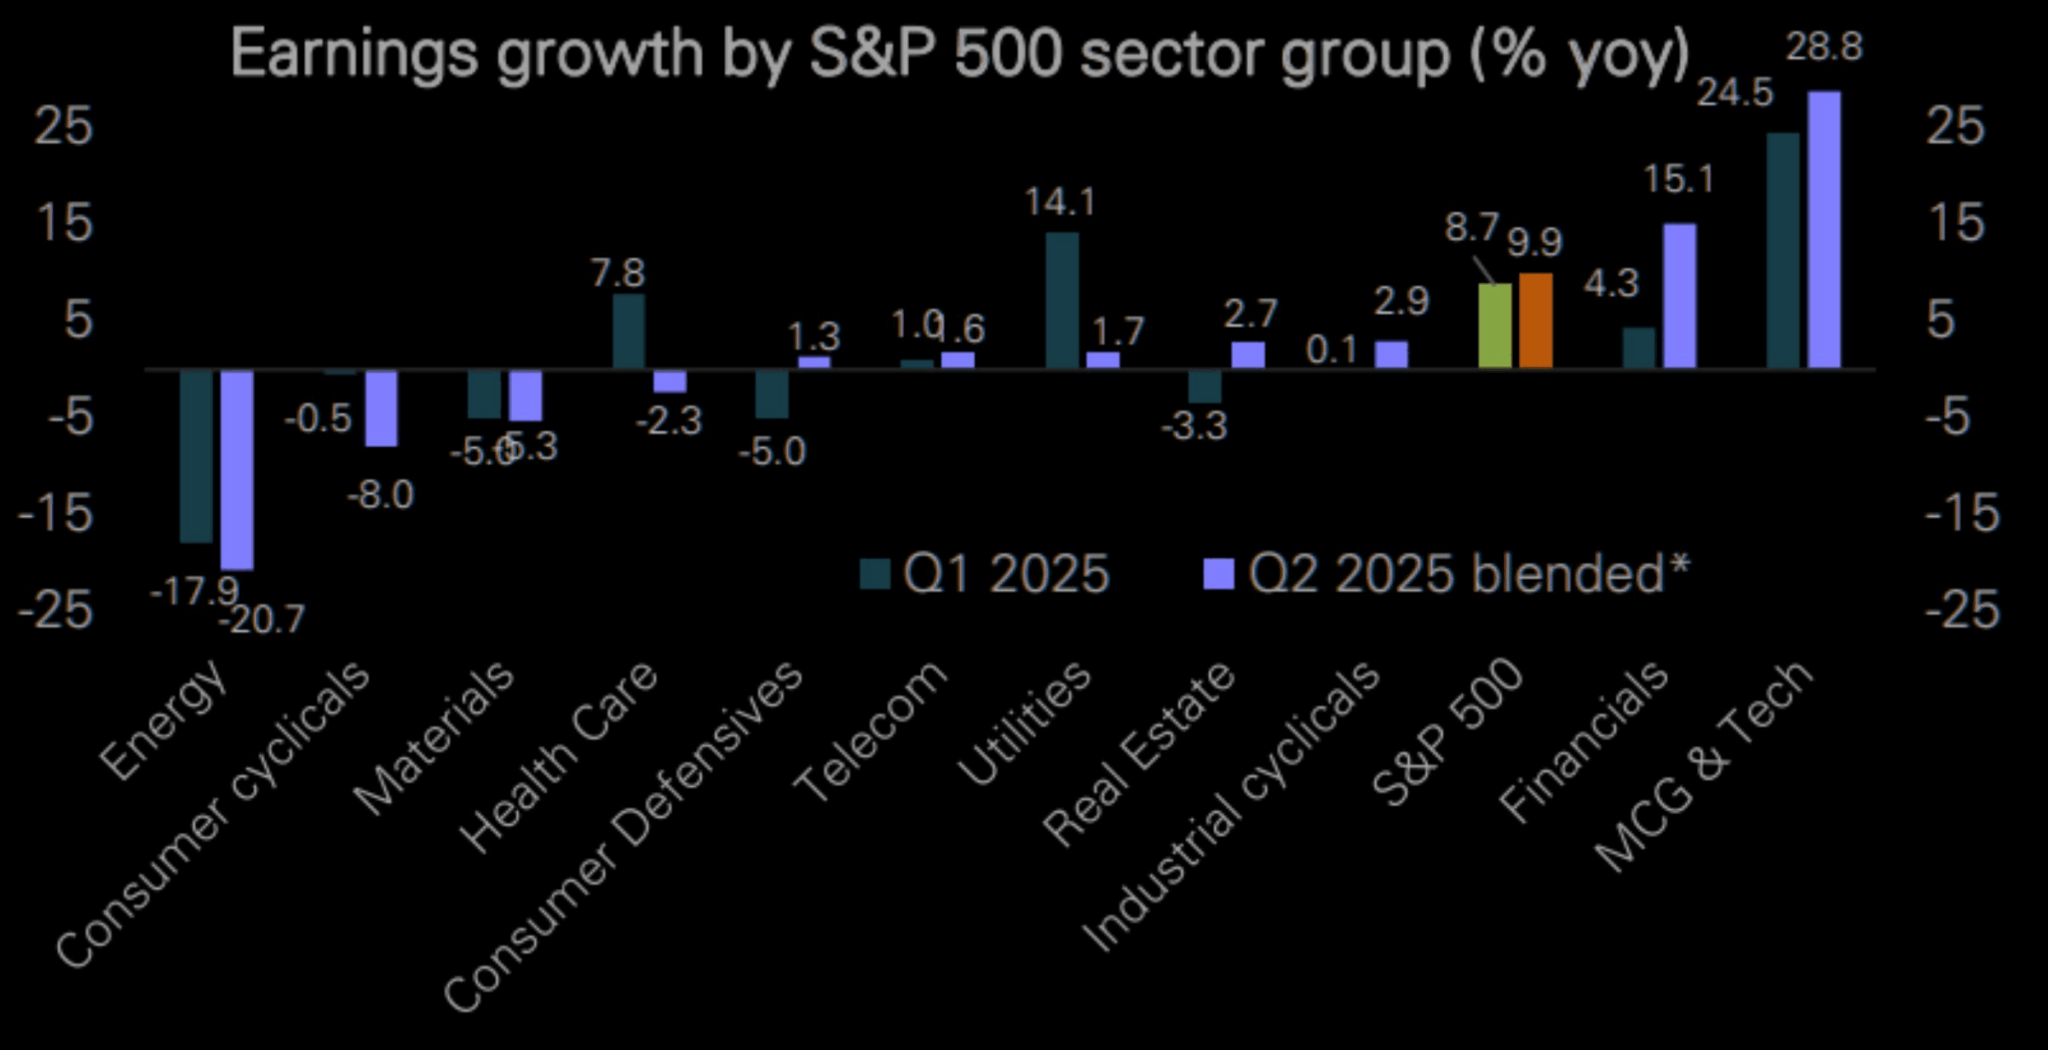
This was evident already in the Q2 earnings reporting period. Without Megacap Technology and major Wall Street banks, there would have been no earnings growth.
Industrial companies have already started guiding lower. Tariffs, higher input costs, and weakening orders are cutting into margins. Companies like Caterpillar, Deere, and 3M have issued profit warnings. Consumer-facing companies are also vulnerable. Discretionary spending is slowing, and rising input costs will further squeeze margins for retailers and service providers.
While technology and AI-driven firms have recently become bright spots, their strength cannot offset broader corporate margin pressures. In Q2, S&P 500 earnings grew 6.4%, with 80 percent of companies beating estimates. But this masks a weakening breadth of growth, where earnings beats are concentrated in essentially just two sectors.
As discussed last week, slowing economic growth will reduce earnings expectations for Q3 and Q4. Margin compression will dominate as companies with pricing power and efficient cost structures prosper while the rest struggle to meet expectations.
Investors must now consider this risk.
Fragile Growth Prospects for the Remainder of 2025
Headline economic growth rebounded to 3.0 percent in Q2 2025 after contracting 0.5 percent in Q1. At first glance, it looked like the economy was regaining strength. But the drivers of that growth tell a different story. Consumer spending rose 1.4 percent, the primary contributor. However, this increase was funded mainly through savings depletion and increased credit usage. Real wage growth remained stagnant, which means consumers were not spending more because they earned more. They borrowed and spent their savings.
Another major contributor to Q2 GDP was a sharp drop in imports. While this technically boosts GDP, it is not indicative of economic health. Imports fell because domestic demand weakened, and tariffs continued to distort trade flows. Export growth was modest, but not enough to offset the larger picture of global trade deceleration. Private fixed investment also declined in Q2, suggesting that businesses are pulling back on capital expenditures, particularly in equipment and structures. This signals reduced confidence in future demand. Inventory restocking added marginally to GDP, but with backlogs thinning and sales slowing, inventory reductions are likely in Q3 and Q4.
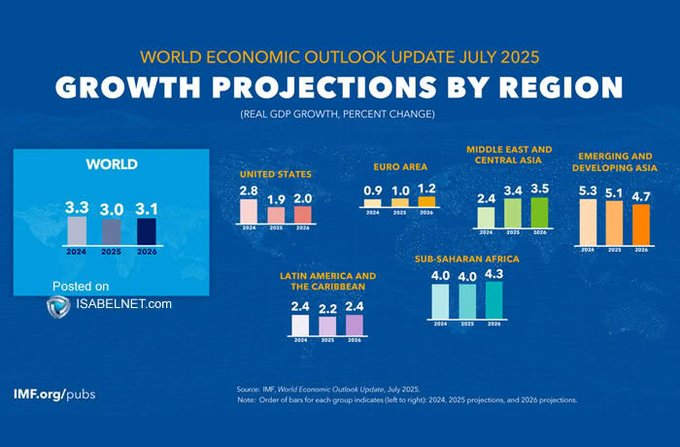
Forecasts for the remainder of 2025 are sobering. Most projections now place GDP growth at 1.5 percent or lower in the second half. By Q4, real GDP growth could slow to below 1.0 percent year-over-year. Even the IMF, which recently produced its global growth estimates, has the US barely growing at 2% for the next two years, and the Eurozone near 1%.
As discussed above, consumer spending, the primary driver of GDP, will be constrained by slowing wage growth, high debt servicing costs, and reduced access to credit. The economy lacks alternative growth engines without a pick-up in business investment or export demand.
The bottom line is that the Q2 GDP rebound was temporary. The underlying structural issues of weak labor market growth, contracting manufacturing, and rising costs all suggest economic momentum will fade as we head into year-end.
Portfolio risk management will remain a top priority for the rest of the year.
📒 Portfolio Tactics – Navigating Potential August Weakness
The July economic data confirms that economic growth momentum is fading. With employment gains stalling, manufacturing and services in or near contraction, and corporate earnings facing margin pressures as costs rise and demand slows, the Federal Reserve is stuck between sticky inflation and a weakening economy. Investors should expect more volatility as markets adjust to a slower growth environment.
This is not the time to chase broad market rallies. Instead, investors should focus on protecting capital and positioning for a lower-growth, higher-cost environment.
- Trim Exposure to Cyclical Industrials and Export-Dependent Sectors: Companies tied to global trade, capital goods, and commodities will face profit pressures. Reduce positions in industrials, materials, and discretionary sectors heavily exposed to business investment cycles.
- Shift Towards Defensive Sectors with Pricing Power: Healthcare, utilities, and consumer staples offer relative safety. Focus on companies with strong pricing power and stable demand. These sectors historically outperform during earnings slowdowns.
- Favor Cash-Flow Rich Technology Over High-Multiple Growth: Maintain selective exposure to technology, but focus on firms with recurring revenues and strong free cash flow. Avoid speculative high-multiple growth names that will struggle in a margin-compressed environment.
- Increase Cash Allocation as Dry Powder: A larger cash position provides flexibility with economic momentum fading. It allows investors to take advantage of lower entry points as volatility increases.
- Reassess Fixed Income Duration: Short-duration bonds will provide better capital preservation if the Fed holds rates longer than expected. But if growth slows faster, longer-duration bonds will benefit. A barbell approach may be prudent.
- Stay Nimble, Avoid Overcommitting: This environment calls for tactical flexibility. Keep position sizes manageable, and be prepared to rotate quickly as data evolves.
The time for passive index riding is over. Tactical positioning will protect portfolios and allow investors to exploit opportunities as the economic slowdown unfolds.
Trade accordingly.

🖊️ From Lance’s Desk
This week’s #MacroView blog delves into the debt and deficit “crisis” as portrayed by the more bearish media. The reality is, while debt is a problem, it is not the problem you think it is.

Also Posted This Week:
- The Low Beta Boom: Sidestepping The Dot.com Bust – by Michael Lebowitz
- Bull Streak Ends As August Begins – by Lance Roberts
📹 Watch & Listen
Is the recent correction over as retail investors continue to “buy the dip?”
Subscribe To Our YouTube Channel To Get Notified Of All Our Videos
📊 Market Statistics & Analysis
Weekly technical overview across key sectors, risk indicators, and market internals

💸 Market & Sector X-Ray: Overbought
Last week, we asked if the corrective process was over. We said that the answer is “maybe” if the break of short-term technical trends continued. However, the break of the 20-DMA was reversed, and support was held at that level, while relative strength improved somewhat. However, momentum and money flows remain weak, and Technology and Staples are overbought as the momentum chase continues. Be mindful of the technical deterioration. While it may seem the bull market is intact, which it is, there is a fragility to the current advance.

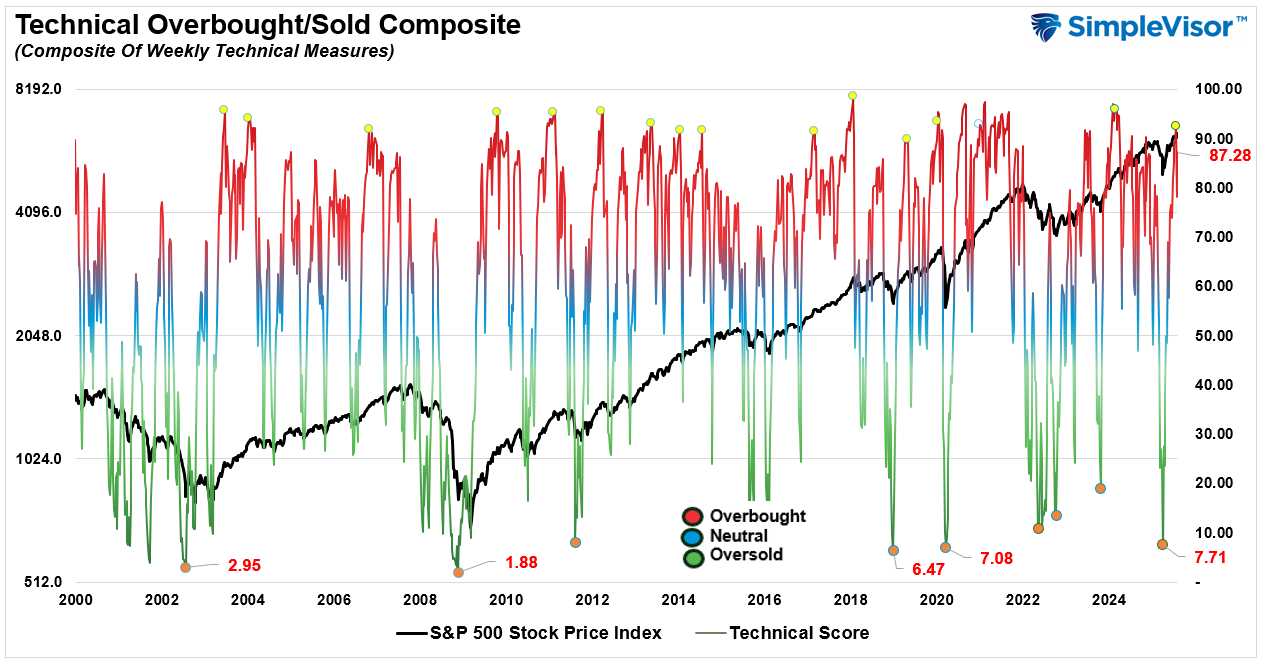
📐 Technical Composite: 87.28 – Market Rallies Back To Overbought
Last week, we noted that the pullback to support had started, which had mildly reduced the overbought condition. However, the rally last week pushed technical conditions back into more overbought territory, suggesting some limited upside over the next week.
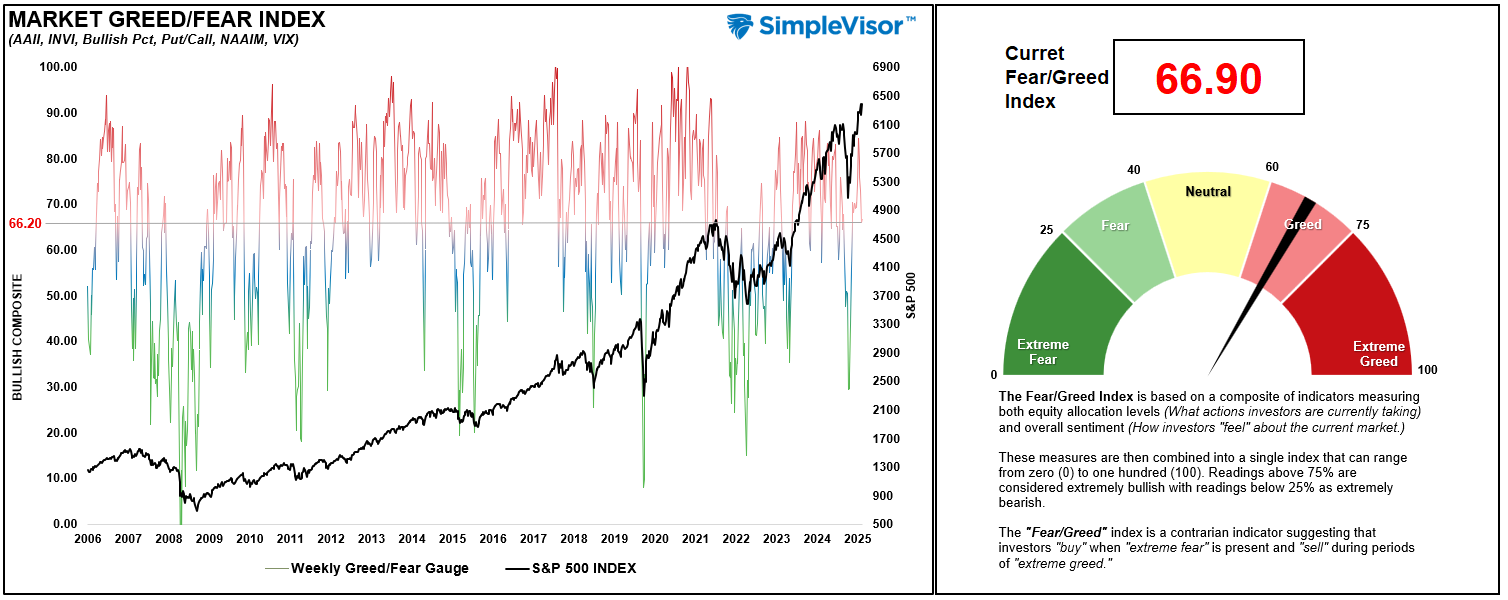
🤑 Fear/Greed Index: 66.90 – Greed Increases With Rally
Last week, the market rallied as allocation and positioning rose from last week’s level of 66.20 to 66.90. While the increase was mild, it continues to suggest a more aggressive posture by investors to the markets, which keeps a larger corrective process from occurring. In other words, investors continue to aggressively “buy dips.”
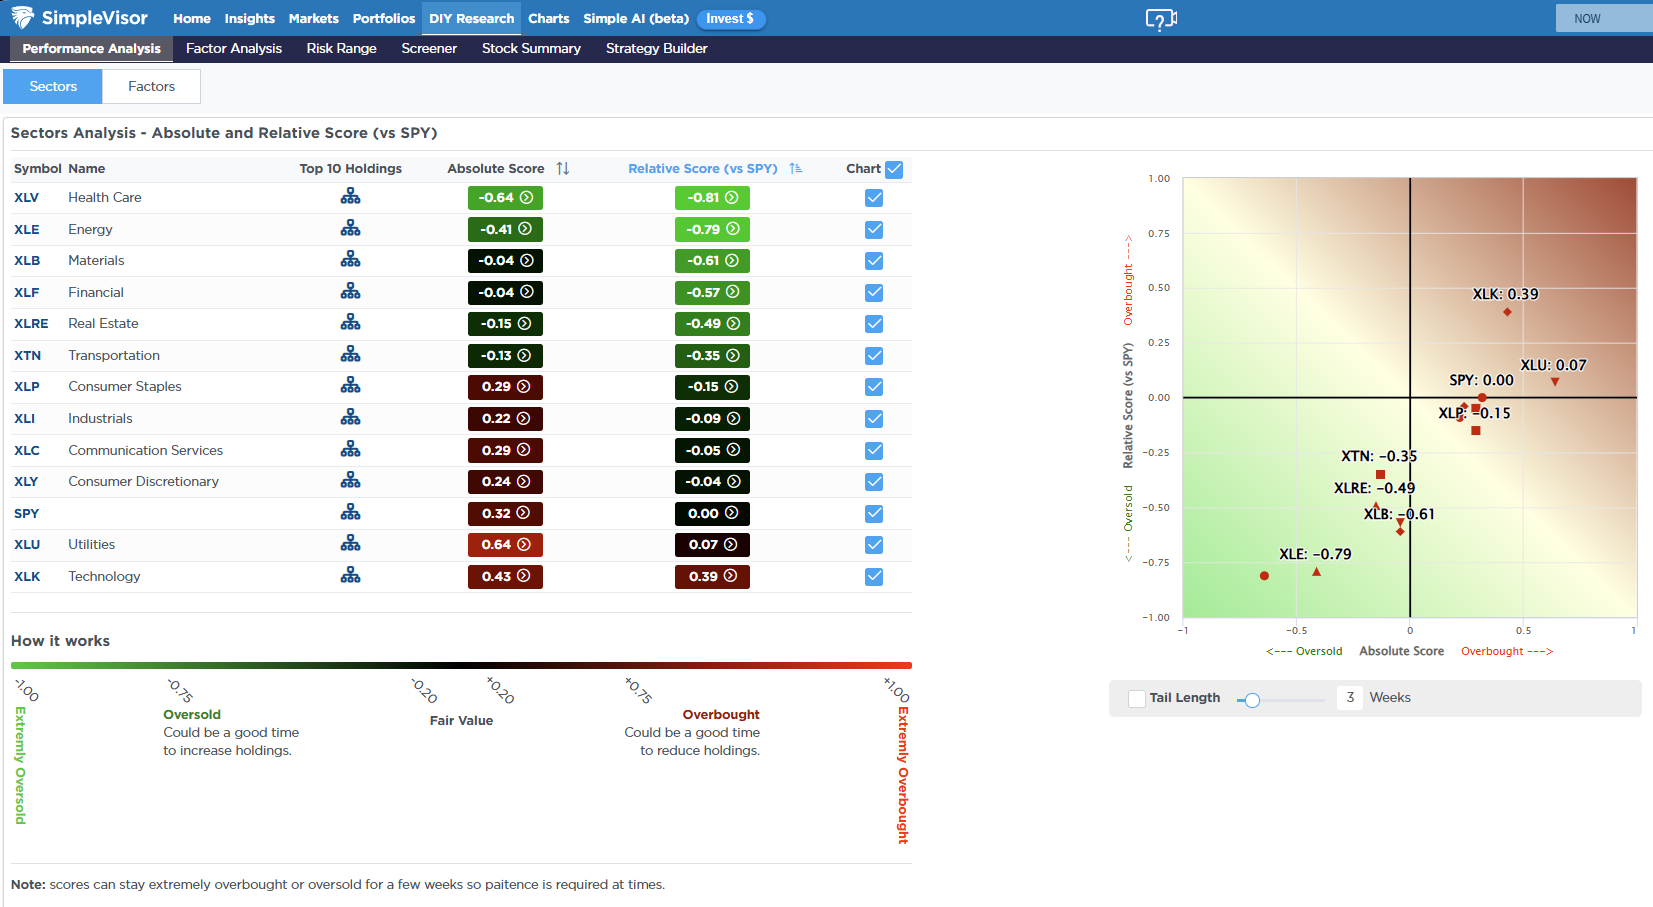
🔁 Relative Sector Performance
After a tough week, Energy and Healthcare are deeply oversold relative to the market itself. Investors continue to shun fundamentally strong companies in favor of higher beta Technology stocks, which remain overbought. A rotation will eventually occur, but these rotations can take time.
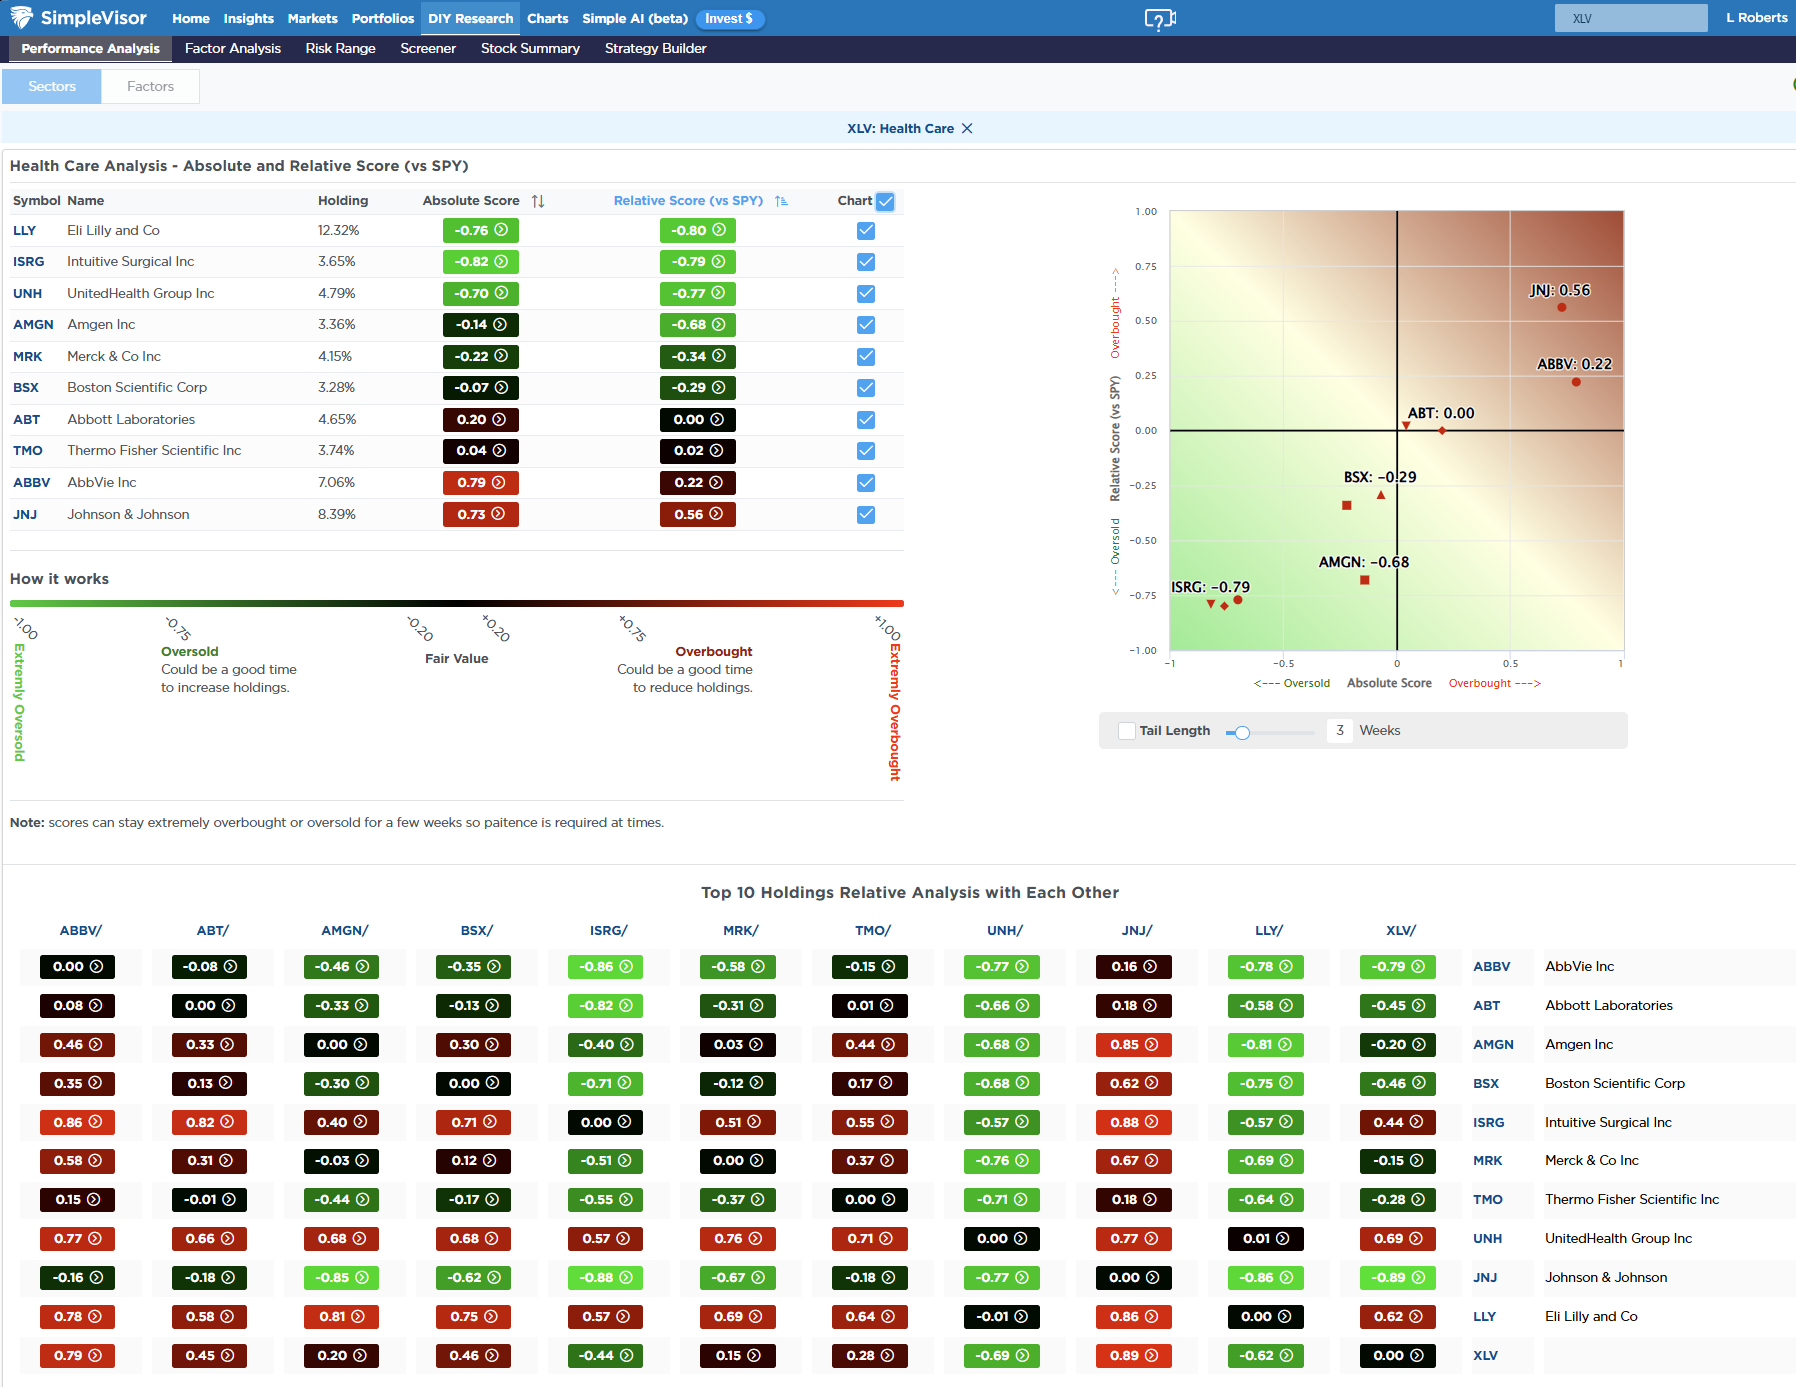
📊 Most Oversold Sectors
After this week’s performance, healthcare is very oversold with companies like ISRG, LLY, and UNH all very oversold on both an absolute and relative basis.
📊 Sector Model & Risk Ranges
Technology, Gold, and Gold Miners have significantly deviated above their long-term moving averages, typically a good signal for reducing risk and rebalancing allocations to those sectors. Conversely, Materials, Staples, Healthcare, and Transports are trading well below their long-term averages. Such a backdrop is not unusual and provides an opportunity for a rotation between those markets and sectors from a contrarian viewpoint. As noted in the relative analysis above, healthcare is deeply out of favor with strong fundamentals.

Have a great week.
Lance Roberts, CIO, RIA Advisors

