
🔎 At a Glance
- AI Earnings Not Strong Enough?
- Repo Market: Warning Or Bullish Signal
- Portfolio Tactics For Next Week
- From Lance’s Desk: “Money Printing” By The Fed: Fact Or Fiction? – RIA
- Portfolio updates & sector strategy shifts
- Market stats, screens, and risk indicators
💬 Ask a Question
Have a question about the markets, your portfolio, or a topic you’d like us to cover in a future newsletter?
📩 Email: lance@riaadvisors.com
🐦 Follow & DM on X: @LanceRoberts
📰 Subscribe on Substack: @LanceRoberts
We read every message and may feature your question in next week’s issue!
🏛️ Market Brief – AI Earnings Not Strong Enough?
This past week, markets continued to digest earnings from key technology and AI-focused companies, as well as the lingering effects of the Federal Reserve’s recent policy shift. Despite a limited macroeconomic calendar due to the ongoing government shutdown, corporate results kept investors engaged. The market struggled with ongoing narrow breadth and growing sensitivity to forward guidance. Major earnings reports from AI-related and large-cap tech firms revealed continued strength in revenue and profit growth, but fell short of overly optimistic expectations.
According to FactSet, the blended year-over-year earnings growth rate for the S&P 500 in Q3 stands at 10.7%, up from 7.9% at the start of earnings season. Revenue growth has reached 4.9%, exceeding both the five-year and ten-year averages. The Information Technology sector is leading the pack with an earnings growth rate of 26.5%. Consumer Discretionary has also rebounded to positive territory, while Communication Services lagged, weighed down by weakness from companies such as Meta, which beat revenue and earnings estimates but was impacted by a one-time tax-related charge.
Many AI-driven firms beat expectations, but markets reacted cautiously to increased capex and tempered forward guidance. Investor response has been mixed. While earnings beats remain high, several strong reports led to muted or adverse price action. This suggests markets are pricing in not just current performance but also cautious sentiment around future growth, margins, and investment intensity, particularly in AI infrastructure.
FactSet reports the forward 12-month P/E for the S&P 500 is now approximately 22.9x, above the five-year average of 19.9x and the ten-year average of 18.6x. These elevated multiples reflect high investor expectations and confidence, raising the stakes for any missteps or negative surprises in guidance. With the macro calendar limited by the federal shutdown, investor focus is firmly on earnings, capital expenditures (capex) trends, and corporate guidance. In this environment, earnings calls and management commentary matter more than usual.
Speaking of earnings, the most notable factor is the elevated expectations of earnings growth projections heading into 2026. While there are a lot of hopes for next year, the vast majority of earnings growth next year is solely dependent on the “Magnificent 7.” Expectations are currently for negative growth from the bottom 493.

This brings to light a few things that investors should be aware of:
- Earnings growth remains strong but is increasingly priced in.
- A narrow group of large-cap tech and AI stocks is leading market gains.
- Valuations are elevated, and participation remains weak.
- Guidance and capital allocation are under heavy scrutiny, especially in AI-related names.
- With macro data limited, earnings and sentiment remain the dominant short-term drivers.
Investors should remain engaged but selective. The market’s technical structure remains bullish, but fragile beneath the surface. Any disappointment in earnings, guidance, or policy could quickly shift sentiment.
📈Technical Backdrop – Breadth Tumbles
The S&P 500 closed the week at 6,728 after struggling all week to hold its ground. While the index remains in a defined uptrend and continues to trade above its 50-day and 200-day moving averages, both of which are still rising, the strength of the move is increasingly in question. Momentum remains constructive, with the MACD in a buy signal posture, and the 20-day moving average held as support. But the underlying structure of the market is weakening.
Breadth has notably deteriorated, with the number of stocks outperforming the benchmark index at levels typically associated with larger market corrective processes. Fewer stocks are participating in the upside, and internal momentum is fading. As of Friday, only 55.4% of S&P 500 components remained above their 200-day moving average, a meaningful decline from earlier levels this year. The number of stocks above their 50-day moving average has dropped even more sharply, down to just 40%, with participation narrowing in key sectors.

The market corrected about 3.5% from its all-time highs and remains above the 50-day moving average for now, keeping the bullish trend intact. However, money flow has deteriorated sharply, although we are seeing some buyers entering the market at the 50-day moving average on Friday, confirming support at that level. Relative strength has essentially reversed most of its previous overbought condition. Still, it remains in negative divergence overall, while momentum has triggered a short-term sell signal, which will keep a lid on advances for now.

Technically, the setup remains bullish based on price action alone, but structurally, it is not robust. Breadth weakness, momentum divergence, and declining volume on rallies are red flags. The rally is vulnerable to sharp reversals if broader participation does not materialize soon. A strong trend built on a narrowing foundation is inherently unstable.
Support and Resistance Levels
- Primary Resistance: ~6,850–6,900 (top of the rising trend channel and previous highs)
- Initial Resistance: ~6,767 (approximate 20‑day moving average)
- Initial Support: ~6,674 (approximate 50‑day moving average)
- Primary Support: ~6,497 (100-day moving average)
- Critical Support: ~6,134 (200-day moving average)
In this environment, investors should remain disciplined. The trend is intact, but fragility is growing. Participation in the rally is permissible, but positions should be hedged or trimmed where appropriate. Stops should be tightened on extended names. Without confirmation from broader market internals or macro data, the path forward could become more volatile.
🔑 Key Catalysts Next Week
The U.S. government shutdown persists, continuing to stall many federal economic data releases. In this environment, the market’s focus shifts sharply to those reports still expected and to key central‑bank commentary. Investors will monitor what limited data is available, along with speeches from Federal Reserve officials and corporate earnings, for directional signals.

In sum, next week offers a sparse macro calendar, making every publication and speech disproportionately important. The NFIB index will serve as one of the few viable high‑frequency signals of business sentiment. The Fed remarks by Cook and Jefferson will be scrutinised for hints of policy shift given the data blackout. With earnings still unfolding, investor attention remains on how companies navigate cost pressures, demand trends, and AI‑driven investment in a constrained economic backdrop. In such an environment, absence of negative surprises may support risk assets, but the lack of fresh data increases vulnerability to unexpected developments.
Trade accordingly.
Need Help With Your Investing Strategy?
Are you looking for comprehensive financial, insurance, and estate planning services? Need a risk-managed portfolio management strategy to grow and protect your savings? Whatever your needs are, we are here to help.

💰 What is the Repo Market?
In September 2019, a critical but obscure part of the financial system broke. Overnight borrowing rates in the repo market suddenly spiked from around 2% to over 10% in a matter of hours. Banks and dealers couldn’t get the short-term funding they needed to finance Treasury holdings or settle trades. Liquidity froze. Wall Street was caught off guard. The Federal Reserve quickly intervened, launching emergency repo operations to inject cash into the system. Within days, funding markets stabilized. Over the next few months, the Fed expanded its balance sheet again, but not for QE, they insisted, but to keep repo markets functioning. That quiet intervention helped fuel the final leg of the market’s rally into early 2020.
Currently, we are seeing cracks reemerge in this previously unknown part of the financial system. In today’s commentary, we will discuss what it is and why it matters.
The “repo” market, short for “repurchase agreement,” sits at the heart of the financial system. Critically, and why it matters to the financial markets, is that it allows banks, hedge funds, and dealers to borrow cash by using high-quality securities, typically U.S. Treasuries, as collateral. (This is also how money winds up in the financial markets when the Federal Reserve is doing “Quantitative Easing.”)
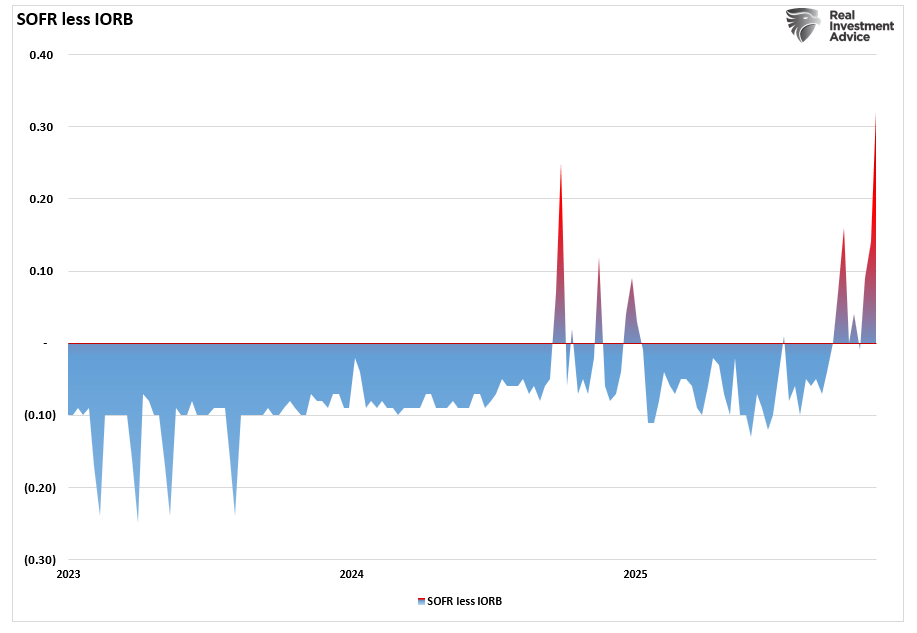
The transaction is straightforward and is an OVERNIGHT transaction. During this process, one party sells a security with a commitment to repurchase it the next day at a slightly higher price. That price difference represents the cost of borrowing. Typically, the difference between the Secured Overnight Financing Rate (SOFR) and the Interest Rate on Reserves (IOR) is slightly negative. Currently, that is not the case. Notably, this is not some niche corner of finance. It’s the lifeblood of overnight funding.
Why is this so important? Because TRILLIONS flow through this market every day, and most people have never heard about it.
However, without it, Wall Street doesn’t open.
- Dealers need it to fund their balance sheets.
- Hedge funds rely on it for leverage.
- Money market funds use it to park cash overnight.
- It’s also how the Federal Reserve transmits monetary policy.
When the repo market functions smoothly, short-term interest rates stay in line with the Fed’s targets. When it breaks, liquidity dries up fast. That creates ripple effects in credit, equities, and even Treasury markets.
If repo transactions grind to a halt, it’s not because there’s a lack of collateral or cash, but because of fear. When institutions stop trusting each other, they stop lending to one another. That’s when the financial plumbing clogs, and the consequence of that “clogged plumbing” is rising volatility, strained liquidity, and falling asset prices. The repo market isn’t just important. It’s foundational.
A Redux of 2019? What Does It Mean for the Markets?
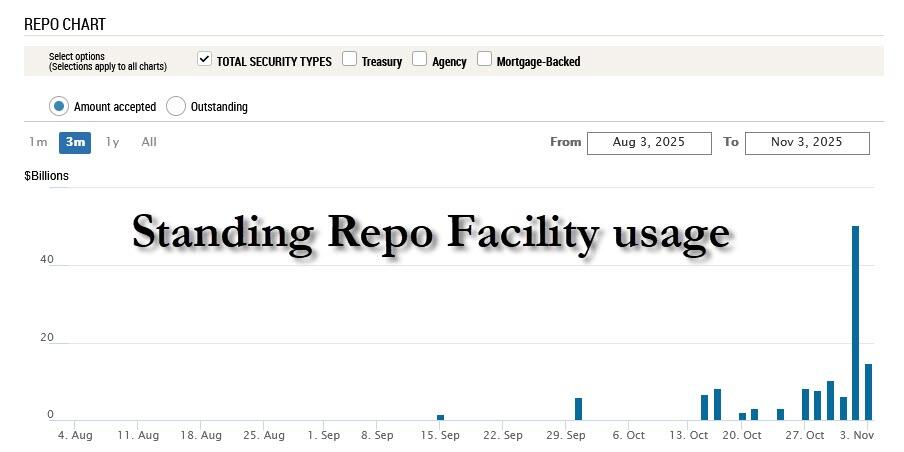
Currently, cracks are reappearing. The overnight repo rate is climbing as the use of the Fed’s Standing Repo Facility is increasing, and treasury bill issuance is ballooning.
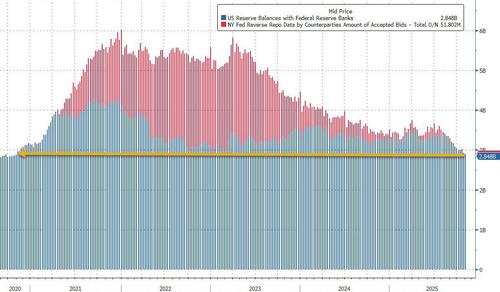
Most notably, what the Fed once deemed “abundant liquidity” has now fallen below the levels it considers “ample.” The chart shows that the Fed Reserve’s plus Reverse Repos (which, for the past three years, have served as an excess liquidity storage facility used primarily to fund purchases of T-Bills) is now at the lowest level since late 2020.
Sound familiar? It should. The current environment bears a striking resemblance to the lead-up to the September 2019 repo crisis. Back then, the repo rate suddenly spiked from around 2% to over 10% in a single day as Wall Street’s funding machine seized up. Here is an example of what happened.
You have a brand new, fully paid-for Mercedes. You go to your neighbor and ask for an overnight loan of just $10,000, offering him the title to your car as collateral. Your interest rate should be close to the Federal Reserve’s overnight rate, but instead, your neighbor says he wants 10%. That difference is a “risk premium” that is undeserved because the loan is backed by guaranteed collateral, in this case, the car.
But that is what happened in 2019, and the Fed had to intervene with emergency liquidity operations to restore stability.
Why did it happen? In 2019, a combination of tax payments and Treasury auctions drained reserves from the banking system. At the same time, dealers were loaded with collateral they couldn’t finance. Cash lenders didn’t want to step in, even at higher rates, because they were either constrained by regulation or unwilling to take the risk. The repo market, which had always been taken for granted, suddenly became the problem no one was watching.
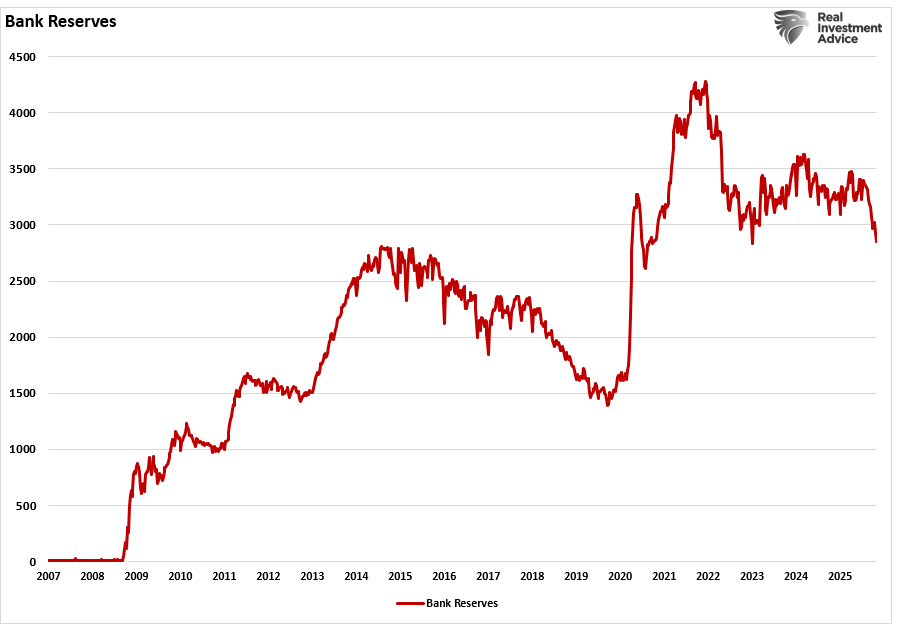
Today, we’re seeing many of the same ingredients. Heavy Treasury issuance is forcing dealers to take on more collateral, and liquidity is being withdrawn from the system due to the Fed’s quantitative tightening. The problem with the repo market is why the Fed announced it would end the shrinkage of its balance sheet at the end of November. Meanwhile, bank reserve levels have dropped sharply, adding to concerns about overall liquidity.
When stress rises in the repo market, it’s not a technical glitch, but rather a signal that the financial system is under pressure. If this stress deepens, it could lead to a broad tightening of financial conditions that will spill over into the equity and credit markets. Given the Fed’s concern about the “wealth effect” the financial markets provide to economic growth, this has become the third, and unspoken, mandate of Fed policy.
While that may sound frightening, there is a twist. If the Fed steps in to relieve repo pressure, like it did in 2019, it might trigger the opposite of a crash. In other words, the Fed’s actions to stabilize the repo market may lead to a “melt-up” in equities, where risk assets surge, not because fundamentals improve, but because liquidity returns in force. Such a conclusion is not far-fetched, as the Government shutdown has drained over $700 billion from the market, as shown by the sharp increase in the Treasury General Account.

Stealth QE on the Horizon
However, once the Government is reopened, that $700 billion increase in the Treasury General Account will flow back into the economy. That reopening will create a flood of effective stimulus as furloughed workers receive back pay, departments are reopened, and Government contract work resumes. Those dollars wind up deposited into the banking system, increasing bank liquidity. In effect, it is a “stealth QE” that could create a massive scramble for risk assets.
As such, both the end of the Government shutdown and a stabilization of the repo market could have an immediate impact on risk assets. Once dealers can fund collateral without paying punitive rates, liquidity will return, which “greases the wheels” of the entire financial system. Trading flows improve as Hedge funds can effectively re-leverage their portfolios, and credit spreads are expected to tighten.
You will notice in the chart below that this is precisely what happened after the 2019 repo scare. Once the Fed began daily operations to supply liquidity, the S&P 500 rallied to new highs. Then, of course, that liquidity went into overdrive following the onset of the pandemic. While it has since reversed somewhat, there remains, as noted above, “ample” liquidity in the financial system currently.

Just as it was in 2019, the move was not about fundamental improvements; it was simply about “too much money chasing too few assets.”
It is important to note that fixing the repo market isn’t about bailing out Wall Street. It’s about restoring the basic mechanics of financial intermediation. When overnight funding is cheap and available, institutions are willing to trade, lend, and invest. That confidence feeds through to markets. Although most investors don’t track repo rates daily, they feel the effects, as more liquidity means less volatility, tighter spreads, and rising asset prices. At least that is what we should expect in the short term.
However, the resolution needs to be more than a temporary patch. If the Fed signals it’s ready to backstop the market, investors will likely view that as a green light to increase equity risk and change the risk calculus to some degree. The problem is that stocks are already grossly detached from underlying fundamentals, and a resolution to either the Government shutdown or resolving the current repo stress will likely see investors pushing asset prices further away from those fundamentals. But that is how liquidity drives markets, especially when fundamentals look stretched.
For investors, it is worth noting that if the Fed steps in again, the upside could come quickly and substantially. For now, the repo market is the canary in the coal mine. What comes next depends on whether policymakers decide to move soon or wait until stress forces their hand.
📒 Tactical Investing Strategies for an Accommodative Fed
You should view the current repo market signals as key early‑warning indicators. Funding stress is not just a narrow dealer issue. It affects liquidity, leverage, and risk flows. If the plumbing falters, even strong fundamentals may be undermined by a lack of financing. If the plumbing is restored, you may have a fertile backdrop for the market to climb.
Therefore, until there is certainty about the next set of actions the Fed or the government will take, it is essential to remain vigilant over your portfolio.
- Monitor short‐term funding rates (SOFR, repo rates) and Fed facility usage for signs of stress or relief.
- Keep some liquidity on hand. Being too fully invested when funding dries up can increase risk.
- Favor high‐quality liquid assets in the interim: Treasuries, highly rated corporate bonds, cash equivalents. These provide optionality.
- As signs of repo market repair emerge (e.g., declining funding rates and less emergency borrowing), consider increasing exposure to risk assets, such as equities, credit, and leveraged structures.
- Avoid over‐leveraging until funding conditions clearly stabilise. The risk of surprise funding shocks remains.
- Stay flexible. Funding conditions may swing quickly. Be prepared to reduce risk if signs worsen (e.g., a sharp funding-rate spike, dealers withdrawing).
- Consider diversifying across asset classes. If risk assets rally following a liquidity fix, being diversified may allow you to capture upside while limiting placement risk.
By watching the repo market, you gain insight into the financial system’s inner workings. As an investor, you benefit by aligning with the rhythm of liquidity, not fighting it.
Trade accordingly.
🖊️ From Lance’s Desk
This week’s #MacroView blog explores the process by which the Federal Reserve creates reserves. Are they “printing money” or is something else happening in the financial system?

Also Posted This Week:
- Nvidia Deals: Round Tripping Or Vendor Financing? – RIA – by Michael Lebowitz
- Investor Dilemma: Pavlov Rings The Bell – RIA – by Lance Roberts
📹 Watch & Listen
Should you be “buying this dip” in the market, or something else?
Subscribe To Our YouTube Channel To Get Notified Of All Our Videos
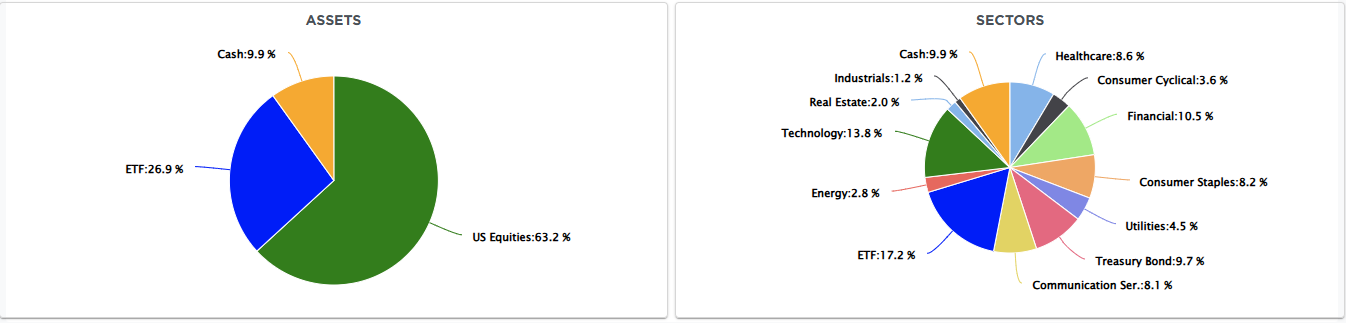
📊 Market Statistics & Analysis
Weekly technical overview across key sectors, risk indicators, and market internals

💸 Market & Sector X-Ray: Pullback To Support
Last week, we warned investors to “Look for short-term corrections to reverse some excess, but remain long equities heading into year-end.” This week, the market corrected back to the 50-day moving average for the second time since October. The good news is that the broad market is becoming increasingly oversold, setting the stage for a rally into year-end. Energy and Healthcare, which were oversold going into the sell-off, benefited from the defensive rotation. However, those sectors are now overbought, so don’t forget to take profits.

📐 Technical Composite: 78.93 – Overbought
The overall technical condition decreased modestly this past week as the market corrected. As we warned last week, conditions that are typically overbought (90 or above) increase the risk of a short-term correction. However, bullish sentiment and momentum remain very strong, keeping the bull market intact.

🤑 Fear/Greed Index: 70.36 – Greed
We noted last week that while investors’ allocations, sentiment, and positioning continue to support the current bullish market backdrop, the “Extreme Greed” reading has increased the risk of a market pullback. With some of that exuberance washed out, we will likely see “dip buyers” try to step in.

🔁 Relative Sector Performance
Basic materials remain the most oversold, but are now joined by the Communications sector, which has been under pressure over the last week. Staples and Real Estate remain weak, and Healthcare has now quietly become the most overbought.

📊 Most Oversold Sector Holdings
While the Communications sector has recently reversed from overbought to oversold, it is META that is now THE most oversold and compelling play in this sector. It is rare to see META this oversold on a relative basis while GOOG remains very overbought.

📊 Sector Model & Risk Ranges
We noted last week that many sectors were exceedingly above their long-term means, and a correction was likely to reverse those conditions. The correction this week did reduce those larger deviations somewhat. Gold, gold miners, emerging markets and technology are still at risk of a further correction or consolidation. However, they may get a technical bounce this next week. The overall bullish backdrop continues to improve with every primary market and sector, save Staples, on a bullish moving average crossover.

Have a great week.
Lance Roberts, CIO, RIA Advisors

