
🔎 At a Glance
- Stock Volatility Returns
- 3-Reasons The Market Could Rally Into Year-End
- Portfolio Tactics For Next Week
- From Lance’s Desk: The Psychology Of Investing In A Zero-Risk Illusion – RIA
- Portfolio updates & sector strategy shifts
- Market stats, screens, and risk indicators
💬 Ask a Question
Have a question about the markets, your portfolio, or a topic you’d like us to cover in a future newsletter?
📩 Email: lance@riaadvisors.com
🐦 Follow & DM on X: @LanceRoberts
📰 Subscribe on Substack: @LanceRoberts
We read every message and may feature your question in next week’s issue!
🏛️ Market Brief – Stock Volatility Returns
This past week delivered a sharp pickup in volatility and quick reversals, underlining how fragile the tape has become. Early in the week, markets were pressured by renewed trade rhetoric from former President Trump. He threatened a 100 percent tariff on Chinese imports starting November 1 in response to China’s export controls on rare earths. While rare earth stocks soared on the news, it rattled investors, igniting fears of an escalating U.S.–China trade war just as bullish momentum had built.
At the same time, along with the tariff threat came growing signs that liquidity conditions were tightening. The banking sector drew attention when regional banks disclosed exposure to loan losses, fraud allegations, and stress in credit conditions. Zions Bank flagged a $50 million loss, and Western Alliance Bank faced fraud claims, both stoking concern about contagion in regional banking. Not only that, but those pressures were exacerbated by steep borrowing from the Fed’s repo facilities. Banks tapped the Fed’s Standing Repo Facility for over $15 billion across two days, signaling stress in short-term funding markets. As we noted in our Daily Market Commentary:
“In other words, the demand for liquidity is outstripping the supply. If the SOFR rate continues to climb, the Fed will likely act via a special liquidity program, QE, and/or a lower Fed Funds rate to provide liquidity. It doesn’t want a replay of 2019, when they were late to heed the warning signs and recognize liquidity shortfalls. Given that all asset markets are being juiced by liquidity, these warning signs should be followed closely by all investors.”

Meanwhile, Fed Chair Jerome Powell’s comments added complexity. He signaled that the quantitative tightening (QT) drawdown may be nearing its end, which was well timed as regulators watch indicators of liquidity stress. That shift raised hopes that the Fed might halt QT and alleviate funding pressures, lowering long-term rates.
Nonetheless, bullish sentiment cracked, but remains unbroken. Despite the sharp fall to the 50-DMA last Friday, the market remained range-bound, oscillating between 50 and 20-DMA. Part of the support came late in the week, as Trump backpedaled somewhat, offering softer rhetoric toward China and confirming talks with Xi Jinping would still proceed. That tone shift helped relieve trade jitters. Banking names also recovered modestly after earnings from some regional banks came in better than feared. But notably, the VIX spiked to its highest levels in months before settling, and markets closed the week mixed.
Overall, the week showed how precarious confidence is. The combination of trade risk, funding stress, and valuation pressure created a volatile mix. The late-week bounce suggests some resilience, but the backdrop remains delicate as we enter a new week.
📈Technical Backdrop – Stocks Drop To Close The Week
The S&P 500 ended Friday on a positive note, despite a weak open, at 6,664.01, rising roughly 0.5% and capping a volatile week. The Dow and Nasdaq posted similar gains, helped by a late-week rebound in financials and easing rhetoric on trade. While the bounce relieved some pressure, it followed a volatile trading week.
Volatility surged as investors recalibrated risk with the Volatility Index (VIX) spiking to levels not seen since early spring, touching 28 on Friday morning before settling at 20.78. This surge marked a renewed recognition of headline risk and broader market instability. Options markets are now pricing in more violent swings, and that shift in implied volatility suggests that rallies will remain vulnerable to reversals.
Market internals also deteriorated over the week. Breadth narrowed further, with gains heavily concentrated in large-cap growth and technology stocks, particularly those tied to AI and defensives. Mid- and small-cap stocks lagged significantly. The 52-week high and low readings remained mixed even during the rebound, indicating a bifurcated market beneath the surface despite the headline strength.
As shown, momentum indicators are on a sell signal, which will likely cap gains short-term, and relative strength readings have reversed from overbought territory and are cooling off with the pullback. The rebound into Friday helped preserve near-term support at the 50-DMA, but the underlying trend has weakened. Rising correlation across risk assets suggests that macro factors, liquidity, rates, and credit dominate technical setups. However, despite the volatility this week, the market remains bullish, and the consolidative action maintains a more constructive undertone.

While credit markets added to the pressure, with high-yield spreads widening modestly and short-term funding stress flaring up again, there are reasons to be cautious. If that stress continues or spreads, it could undermine the broader equity backdrop even if technical levels hold.
The current setup is defined by a tight range with clearly defined battle lines:
- Support: 6,600–6,675 zone (critical short-term floor)
- Resistance: 6,770–6,800 zone (intermediate upside target)
- Volatility threshold: VIX above 25 indicates unstable conditions, so it is worth watching next week.
- Momentum trigger: A breakout above resistance on rising volume and improving breadth would be a good sign.
As long as support holds, tactical buying remains viable, but the market operates on thinner margins. If price breaks below support, momentum-driven selling may accelerate, especially if accompanied by rising credit stress. Conversely, a clean breakout above resistance would re-engage trend-following flows but require volume and breadth confirmation. With volatility elevated, every move must be respected and hedged accordingly.
🔑 Key Catalysts Next Week
Markets will enter next week on edge. The recent bounce helped ease near-term fears, but the ongoing shutdown and a heavy slate of earnings will move the markets. Liquidity, credit quality, and macro data will be in sharp focus. Powell’s comments hinting at the end of QT may relieve some pressure, and the Government will release the CPI data next Friday, before the Fed’s next policy meeting the following week.

The week sets up as a test for sentiment and market direction. Equities could continue their rebound if regional banks post stable earnings and the Fed signals more liquidity support. Strong macro data might strengthen the rally if it comes with disinflationary signs, but any surprise in trade policy or signs of renewed credit tightening would reignite volatility. Investors should prepare for more two-way price action as markets digest a complex mix of catalysts.
Risk management remains key next week.
Need Help With Your Investing Strategy?
Are you looking for complete financial, insurance, and estate planning? Need a risk-managed portfolio management strategy to grow and protect your savings? Whatever your needs are, we are here to help.

💰 Market Rally Into Year-End?
Despite the recent pickup in market volatility this week, the rally from the April lows has been breathtaking. As such, the current correction certainly has further to go. Maybe that is the case; however, while I don’t know with certainty what will happen, it is unsurprising that investors are questioning how much further it can run. The concerns are many and logical. Stocks have pushed too far, too fast. On a longer-term basis, the S&P 500 and Nasdaq are trading near technically overbought levels, and the Relative Strength Index (RSI) on major indexes remains elevated, a threshold that often signals exhaustion in bull trends. Lastly, market breadth remains weak as leadership narrows to a handful of mega-cap tech names, etc. These are all the previous arguments we have presented in the #BullBearReport, and those risks remain.
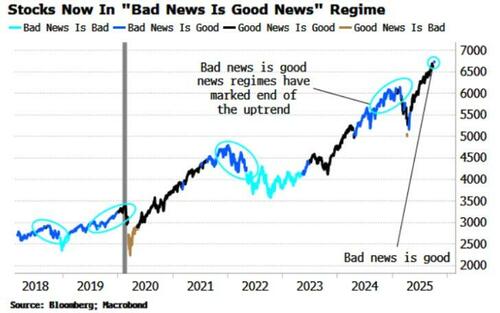
As we noted last week, another concern is that we have re-entered the “Bad News Is Good News” regime, which historically occurs closer to market peaks than not.
“At the end of a stock-market rally, just before a consolidation or a correction, there is typically a period where the market reacts positively to bad news. That’s a regime we just entered. In previous times, around the last three major market tops, this regime has been in play. It is often preceded by a “good news is good news” regime (white line in chart), where stocks intuitively rally when it looks like the economy is strengthening. If we roll the chart further back, it shows the “bad news is good news” regime was in play before the 2011 and 2015 tops, too.
However, there are a couple of caveats. Firstly, as we can see above, the “bad news is good” regimes can last for several months before the market corrects. This time could be no different. Secondly, in the 2000s and 2010s there were several periods where the “bad news is good” regime came mid-cycle, ie, in the middle of the rally. It’s possible that’s the case today, but with potentially huge overinvestment in the AI sphere, all-time high valuations, and increasing signs of speculative froth, you wouldn’t want to bank on it.“ – Simon White, Bloomberg
Investor sentiment is another warning sign. The latest AAII sentiment readings show that bullish sentiment is climbing, but many investors admit they lack conviction. A recent Charles Schwab survey shows more than half of traders believe the market is overvalued. This disconnect between belief and positioning often occurs near short-term market tops. Meanwhile, the IMF has warned about the potential for a disorderly market correction due to extended valuations and loose financial conditions. The chart below confirms that despite the market surge, the sentiment composite/VIX ratio suggests investors remain cautious.

Given this backdrop, should investors reduce risk sharply to avoid the coming market correction?
While such would surely seem the logical course of action, there are three reasons why the market could continue to rise into year-end.
Earnings, Buybacks, and Bullish Momentum Support the Rally
Let me be very clear. This is not a long-term market call. This analysis aims to gauge potential market risk between today and December 31st. Once we get into 2026, we will analyze market underpinnings to determine outcomes over the new year. Therefore, let’s begin by understanding that despite the legitimate concerns listed above, there are strong reasons to remain invested through year-end and consider “buying the dips” that will occur along the way.
First, corporate earnings remain a pillar of support for the stock market rally. As we enter Q3 earnings season, as is always the case, Wall Street analysts have lowered the “bar” rather dramatically. We started Q3 estimates at $243.25 per share, and despite the “Liberation Day” downgrade, earnings estimates as we start the reporting period have declined by $11 per share to $232.13. As such, we should expect that a high percentage of companies (70-80%) will report better-than-expected results, particularly in technology and growth sectors. According to JPMorgan, the current year-end earnings per share projections are solid, driven by strong margins and resilient consumer demand. Even with headwinds from inflation and interest rates, many firms are beating expectations and raising forward guidance.

This earnings strength helps justify current valuations, especially for companies with strong pricing power and exposure to secular growth trends like AI and automation. As long as profits remain solid, the downside risk to equities is limited. More notably, Wall Street analysts have been increasing forward estimates into 2026, which are likely well ahead of reality. However, at least through year-end, investors are chasing earnings momentum and finding few reasons to pull back capital soon.

Secondly, corporate buybacks remain a significant tailwind. In 2025, companies expect to repurchase over $1 trillion worth of stock, according to Citadel Securities.

That level of demand is equivalent to some of the strongest periods of corporate repurchase activity in market history. Daily buyback flows during peak periods have approached $7 billion, and the fourth quarter historically sees a resurgence of these programs after blackout periods end. This consistent corporate demand helps support prices and absorb selling pressure.

Lastly, momentum and sentiment dynamics continue to favor the bulls. Although some investors remain skeptical, many institutional and quantitative strategies still allocate capital based on price trends. As the market holds its ground near highs, that momentum becomes self-reinforcing. Investors sitting on cash are under pressure to participate, especially if benchmarks continue to climb. The fear of missing out (FOMO) is real, and it can drive flows back into risk assets even after short-term dips.
Furthermore, the “retail demand” remains consistent in 2025, and every dip continues to be bought aggressively. As noted by Citadel Securities, retail investors have been “Net buyers in 23 of the last 26 weeks, and 7 straight weeks, rebounding after April weakness.” Furthermore, last Friday’s 2.71% decline was met by retail flow skewed 11% better to buy via the Call/Put Direction ratio (vs. a 4% average over the past 3 months), marking the most significant single-day call buying ever.

However, we can visualize this retail investing “BTFD” momentum trade. The following chart shows the “buying panic” that has occurred since the “Pandemic Shutdown” for investors under the age of 40, which dwarfs all other periods in the data set. While the eventual reversion is likely massive, by year-end, there is likely very little that can break the current psychology driving markets.

Strong earnings, aggressive buybacks, and trend-following behavior provide a durable backdrop for the stock market rally to continue. Pullbacks should be expected, but they are more likely to serve as buying opportunities than signals of a larger trend reversal.
Seasonality Aligns with a Bullish Setup
Another support for the bulls is that the calendar is now turning toward one of the most favorable times of the year for equity markets. Historically, November through December has delivered some of the most substantial average returns for the S&P 500. This seasonal strength is well documented and is often supported by end-of-year positioning, tax-loss selling deadlines, and corporate buyback windows reopening. Furthermore, as year-end approaches, fund managers generally push to get positions on the books before annual reports get released. Such has become known as the “Santa Claus Rally.”

However, while the broader seasonal trend starts soon, there is a risk to the bullish backdrop. As we have already seen, October is known for its volatility pickup, and this past week has undoubtedly served as a reminder. However, any weakness during this stretch often provides entry points, not reasons to exit. Markets that consolidate or pull back in October usually rebound in November. On the other hand, December is often weak during the first couple of weeks of the month as professional fund managers distribute their annual capital gains, dividends, and interest. That distribution period tends to provide a short-term pullback that investors can buy into before the year-end rally. Lastly, additional monetary accommodation could support the rally with the Federal Reserve signaling further rate cuts and an end to Quantitative Tightening (QT).
Does this mean there is “zero risk” that something could go wrong, leading to a bigger correction? No. There is always a risk that some unexpected, exogenous event could disrupt markets. However, investors who try to wait for ideal entry points risk missing the rally. While upside may be slower and more rotational than earlier in the year, the path of least resistance remains higher as we move toward year-end. The seasonal setup, earnings, and buybacks support the case for a stock market rally into the final quarter.
As such, investors should approach the markets with a tactical bias, buy dips, and rebalance risk as needed on subsequent rallies.
📒 Tactical Investing Strategies for a Year‑End Rally
Navigating toward a stock market rally requires tactical discipline. Investors should adopt strategies that protect downside risk while enabling participation in upside.
- Maintain Core Equity Exposure + Tactical Overweights: Maintain a core allocation to equities. That should be the anchoring position. Within that, consider tactical overweight to sectors with strong forward earnings potential (tech, AI infrastructure, select growth names). Trim exposure to more interest rate-sensitive, defensive, or crowded names.
- Use High‑Quality Names as Anchors: Given valuation risks, favor companies with high margins, strong balance sheets, pricing power, and secular tailwinds. Weak names will lag or collapse during corrections, even in a broad rally.
- Laddered Entry with Staggered Buys: Stagger investments rather than committing capital at once. Enter initial positions at current levels. Reserve dry powder to upgrade or expand positions on modest 3–7% pullbacks. This approach balances between chasing strength and buying dips.
- Use Hedging to Protect Against Sharp Reversals: Given the risks of overbought extremes, consider using hedges such as index put options or collars. Some market strategists suggest increasing convexity exposure (e.g., equity index puts, or long volatility) to protect against surprise downside moves.
- Monitor Liquidity, Volatility, and Macro Signals: Be vigilant about yield curve shifts, credit spreads, and volatility metrics (VIX, skew). A sudden credit event or bond market stress could unravel equity strength. Keep stop levels or trailing stops for high-risk positions.
- Take Partial Profits / Trim on Strength: If a position doubles or rallies significantly quickly, consider trimming to lock in gains. Use those proceeds to re-enter on pullbacks or redeploy into lagging sectors.
- Rebalance into Strength: As a stock market rally proceeds, rebalance portfolios by trimming sectors that run ahead and reinvesting into those that lag but have supportive fundamentals. This captures momentum while maintaining balance.
- Stay Flexible and Data‑Driven: No plan survives market surprises unscathed. Stay alert to data surprises (inflation, geopolitical, credit) and be ready to rotate away from overextended segments. If earnings momentum falters or macro cracks, reposition to more defensive allocations.
A stock market rally into year-end remains plausible. The path will not be smooth. Elevated valuations and sentiment excess impose risk. But strong earnings, aggressive corporate buybacks, and momentum bias provide real ammunition for continued upside. Seasonal tailwinds align favorably. Tactical discipline and risk management will separate winners from losers.
Be ready to buy weakness, protect against extremes, and favor quality. That is how you navigate toward a full‑throttle rally into year-end.
Trade accordingly.

🖊️ From Lance’s Desk
This week’s #MacroView blog examines the risk and the psychology of investing during an environment where investors believe there is zero risk to outcomes.

Also Posted This Week:
- Capitalism: The Road To Wealth And Happiness – RIA – by Michael Lebowitz
- ChatGPT Gives Financial Advice On Volatile Markets – RIA – by Lance Roberts
📹 Watch & Listen
As the market keeps rising, fragility increases. A look at the market and its battle with the 20-DMA.
Subscribe To Our YouTube Channel To Get Notified Of All Our Videos
📊 Market Statistics & Analysis
Weekly technical overview across key sectors, risk indicators, and market internals

💸 Market & Sector X-Ray: Pullback To Support
We warned last week that the overall market was back to more overbought levels, along with Industrials, Technology, Real Estate, Utilities, Healthcare, and International and Emerging markets. Specifically, we said to “Look for short-term corrections to reverse some excess, but remain long equities heading into year-end.” That correction started last Friday and continued through this week. While the market has reversed some of the previous excesses, there is still some potential for additional weakness into next week. Continue managing risk.

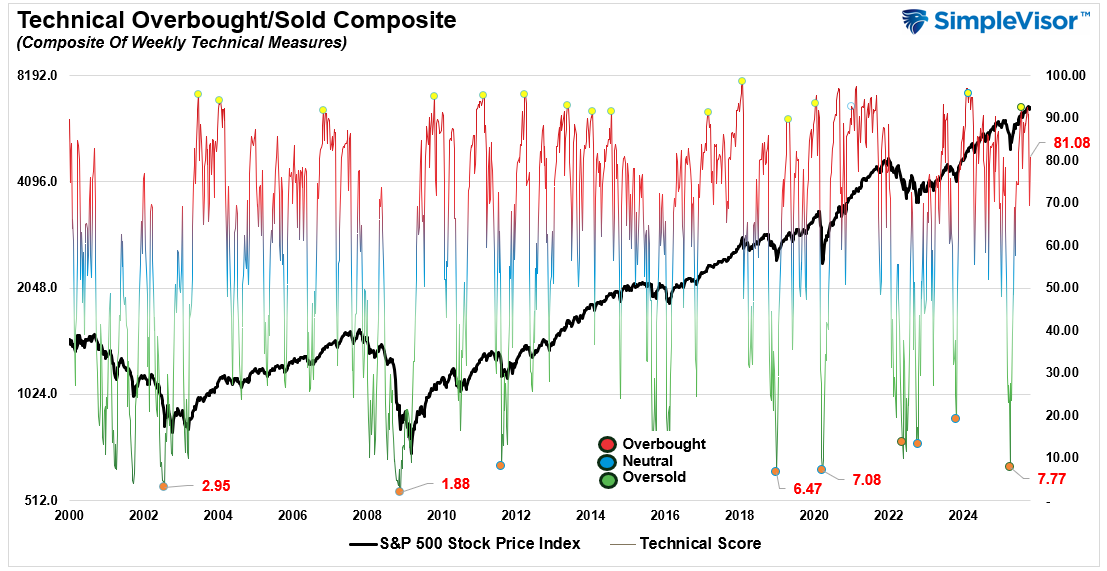
📐 Technical Composite: 81.08 – Still Overbought, But Correcting
The overall technical condition increased further this week and has now captured the 90-level. Such readings are somewhat rare, and while they don’t suggest an immediate correction, they do tend to indicate environments where corrections become more likely. As such, the upside is likely limited.
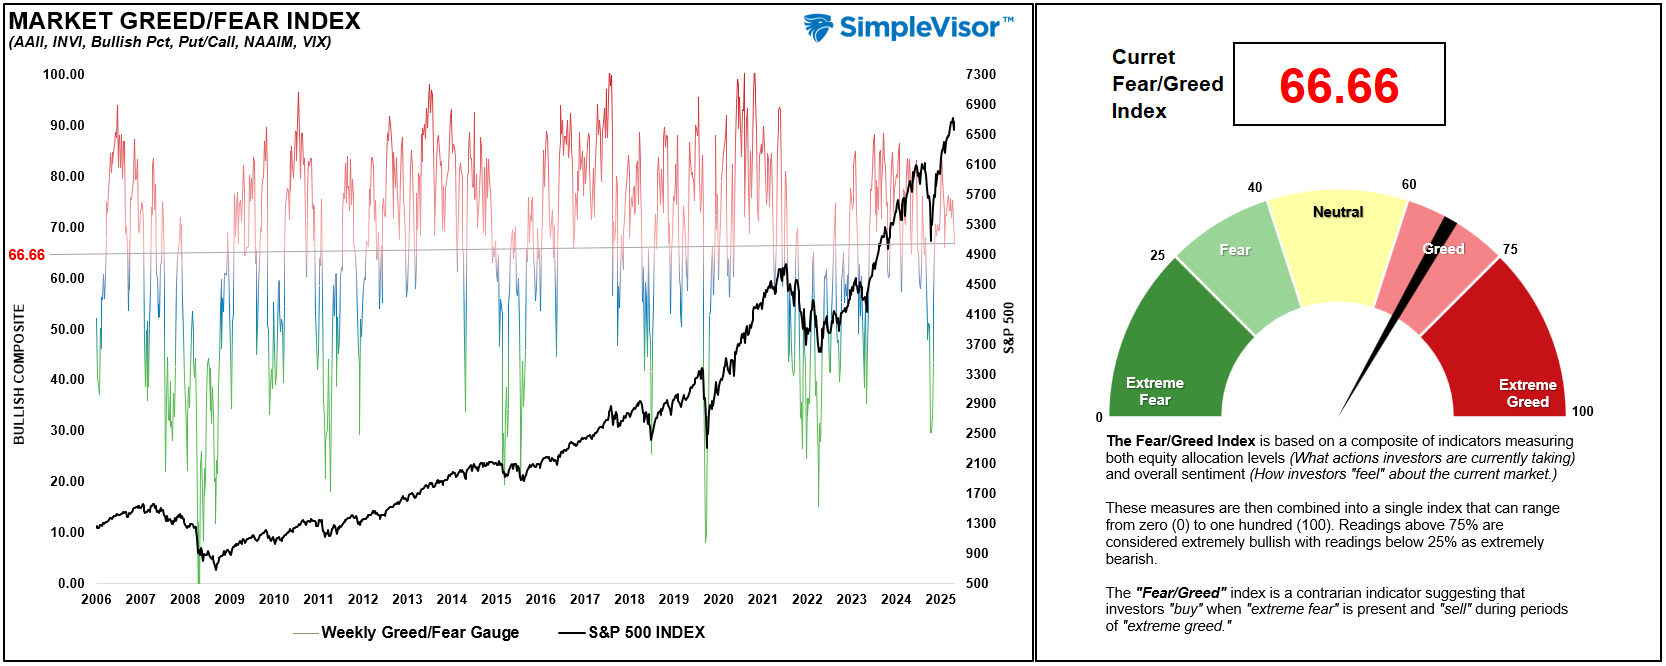
🤑 Fear/Greed Index: 66.66 – Correction Reduces Greed Further
Investors’ allocations, sentiment, and positioning continue to support the current bullish backdrop to the market. There is little “fear” registering across measures, including options positioning, equity allocation levels, and overall biases. However, this past week’s volatility further reduced overall sentiment from “extreme greed” to “greed” and suggests that further market weakness will likely be bought.
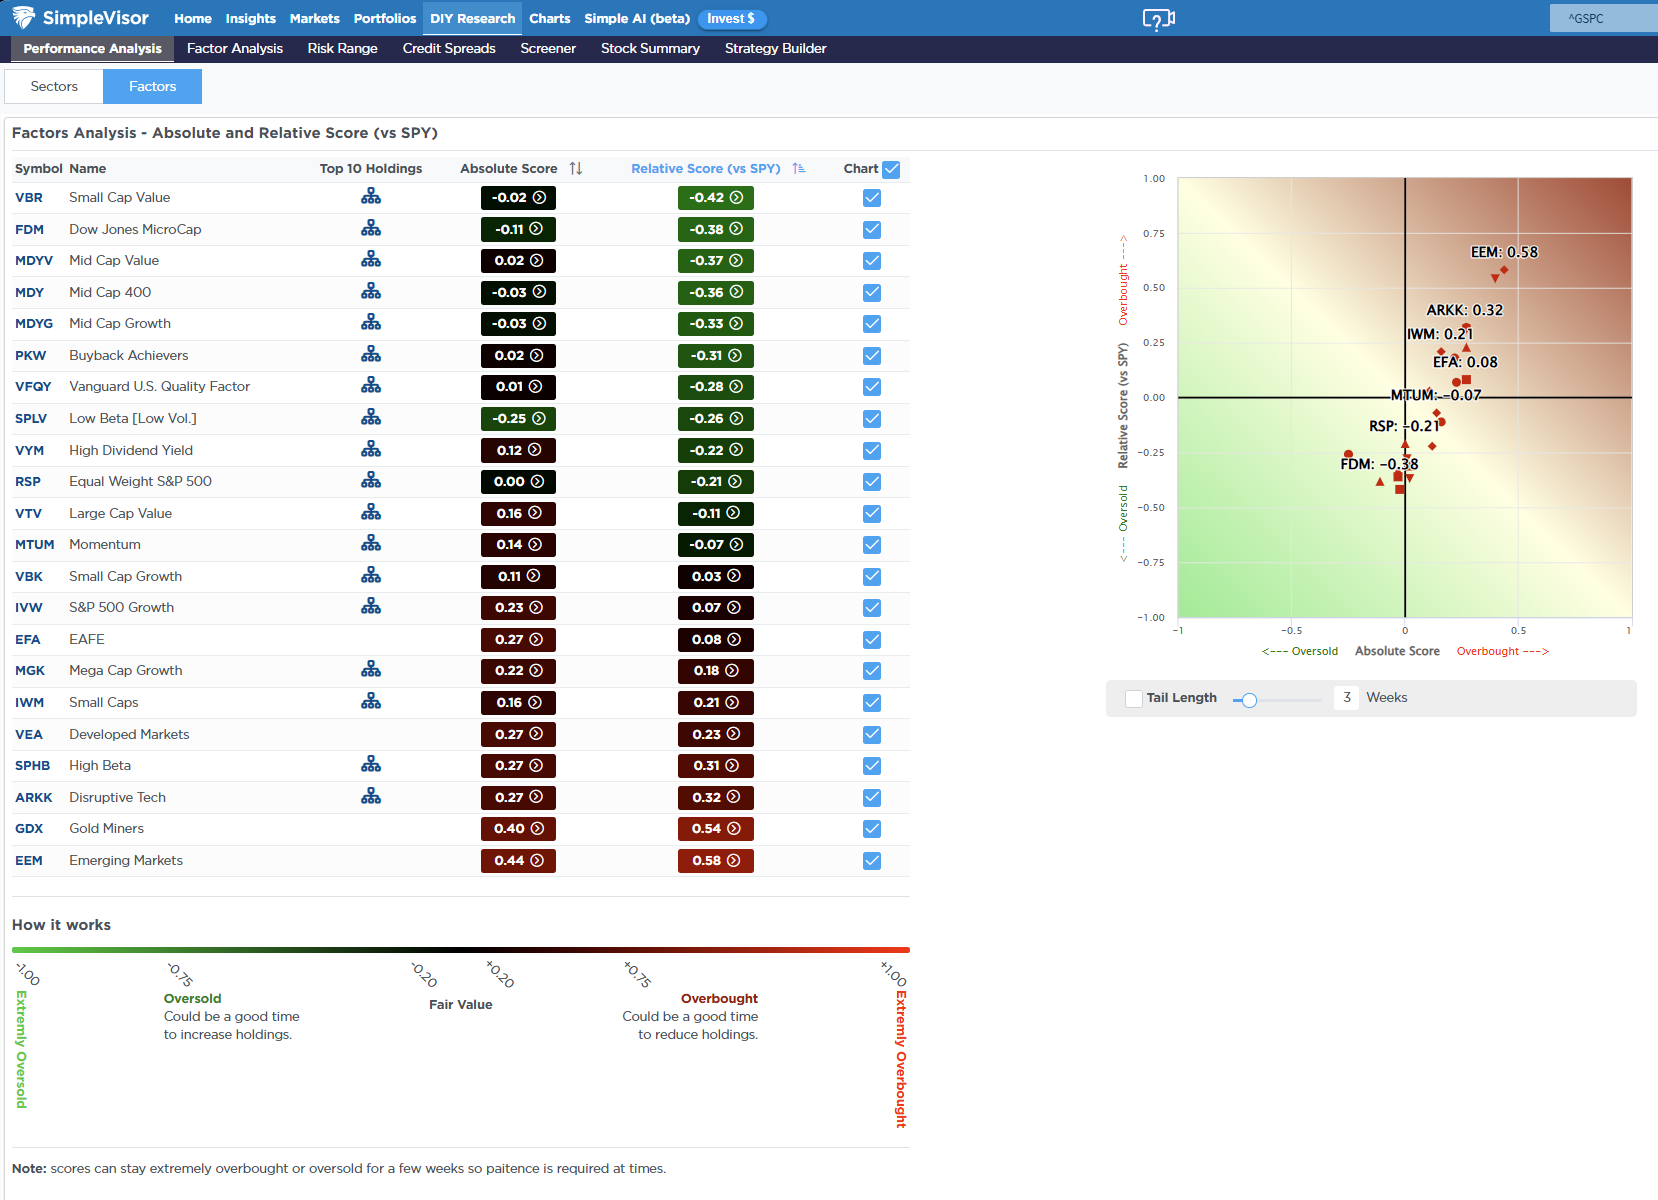
🔁 Relative Factor Performance
This past week, EEM took the lead spot as the most overbought only because GDX corrected decently on Friday. However, as noted last week, GDX’s deviation from its long-term mean is astronomical, so a larger correlation in EEM, GDX, and AARK remains a higher probability.
📊 Most Oversold Factor Holdings
An interesting setup currently is the Buyback Achievers factor, which is oversold on a relative and absolute basis simultaneously while we are entering one of the stronger buyback periods of the year. If we see a larger momentum trader reversal in the market, FI, PYPL, CVX, and GS may be worth exploring.

📊 Sector Model & Risk Ranges
Last week, we noted that the S&P 500 is very extended and 11% above its long-term mean, along with many sectors and markets, particularly Gold Miners, trading at double-digits above long-term averages. While the correction that started last Friday has reversed some of those excess deviations, they remain extreme, suggesting that further corrective action could occur. Take profits and rebalance risks as these deviations are not sustainable long-term.

Have a great week.
Lance Roberts, CIO, RIA Advisors

