
🔎 At a Glance
- Inflation Data Still Shows No Tariff Impact
- But, Inflation Data Increases Odds Of Fed Rate Cut Hopes
- Portfolio Tactics For Next Week
- From Lance’s Desk: Insider Selling Reveals Fallacy Of Buyback Theory
- Portfolio updates & sector strategy shifts
- Market stats, screens, and risk indicators
💬 Ask a Question
Have a question about the markets, your portfolio, or a topic you’d like us to cover in a future newsletter?
📩 Email: lance@riaadvisors.com
🐦 Follow & DM on X: @LanceRoberts
📰 Subscribe on Substack: @LanceRoberts
We read every message and may feature your question in next week’s issue!
🏛️ Market Brief
U.S. equities notched fresh milestones midweek before fading into Friday’s close. The July CPI print (headline +0.2% m/m, +2.7% y/y; core +0.3% m/m, +3.1% y/y) kept the “September cut” narrative intact. Following those reports, the S&P 500 and Nasdaq set new closing highs on Wednesday.
Thursday’s July PPI (+0.9% m/m; +3.3% y/y) lifted Treasury yields by ~5 bps and tempered rate‑cut euphoria. However, the S&P still eked out another closing high. However, on Friday, it was a mixed tape. The Dow briefly hit a record intraday high, powered by United Healthcare (UNH), which had a massive surge following news that Berkshire Hathaway took a stake in the beleaguered company. Meanwhile, the S&P and Nasdaq slipped as investors digested July retail sales (+0.5% m/m; ex‑autos +0.3%), July industrial production (‑0.1% m/m; manufacturing flat), and a drop in preliminary August Michigan sentiment to 58.6. That data continues to confirm an overall weakening of the consumption economy, potentially putting pressure on overly optimistic earnings expectations.
Net‑net, the week reinforced a “two‑handed” macro-economic environment. Consumer spending remains resilient, and index levels are elevated. However, upstream price pressures and softer sentiment argue for tactical discipline near highs. Meanwhile, the Treasury bond yield curve continued to re‑steepen (2s/30s near the steepest in ~3 years). Such signals the market’s pivot toward an eventual easing path even as near‑term inflation noise persists.
For investors, there are a few things to be cautious of. First, inflation re-accelerated on the production side, while consumer‑level inflation remains tame, which suggests an increased risk in corporate margins. Such could be particularly noticeable in cyclical stocks if pricing power wanes. Secondly, quality balance sheets, cash flow visibility, and liquidity in portfolios remain a clear advantage. Avoid chasing strength at index highs. Instead, consider leaning into a measured participation. Let the data pull you into or out of risk rather than headlines. (See the Portfolio Tactics Section below)
Speaking of portfolio tactics, let’s review the technical backdrop of the market.
📈Technical Backdrop
On Friday, the S&P 500 settled at 6,449.80, pulling back slightly from its all-time closing high on Thursday. While the market rally faded at the end of the week, the overall bullish momentum remains firmly intact. From a technical perspective, the trend remains upward, but there are signs of weakness below the surface. A negative divergence is developing between the rising market and weakening relative strength. Simultaneously, money flows remain weak despite the higher stock grind over the last week. This does not mean the market is about to crash. It suggests that investors should deploy some form of risk management.

This past week, Goldman Sachs discussed its view of an uptick in downside risk, citing a growing probability of a 10–20% correction in the next three to twelve months. That warning reflects the current market asymmetry, where stretched valuations may limit the upside, but the downside risk is being underestimated. It’s a classic late-stage bull market dynamic: strong momentum cloaking rising fragility.
Valuation red flags are also flashing. According to Bank of America, the S&P 500’s price-to-book ratio has surpassed 5.3, a level not seen even during the dot-com bubble. Combined with a deeply compressed VIX and low equity risk premiums, this suggests a market becoming increasingly complacent. However, it is crucial to remember that valuations ONLY reflect investor sentiment in the very short term. As shown, that sentiment is very bullish.

Still, there are arguments for higher levels. Some traders see the 6,500 level not as a ceiling, but as a launchpad, with hedge funds still underweight and volatility-controlled strategies steadily adding equity exposure.
Bottom line: Investors should remain tactically bullish, but disciplined. The index is technically overbought, breadth remains narrow, and sentiment is beginning to crowd into a handful of trades. Use strength to rebalance, trim excess exposure, and maintain hedges. If the rally broadens and internals improve, there will be plenty of opportunity to add risk. But right now, managing what you own is more important than chasing what you missed.
🔑 Key Catalysts Next Week
With markets still hovering near record highs, the coming week’s data will test whether momentum can continue into late summer. Housing indicators, Fed communications, and preliminary August activity readings will all shape rate-cut expectations and investor positioning.

Overall Risk Outlook: Neutral
While the July CPI data reassured markets that consumer inflation is moderating, the hotter-than-expected PPI reading highlights that upstream cost pressures are still working through the system. Retail sales showed consumers remain willing to spend, but industrial production slipped and consumer sentiment weakened, which are early signs that the growth impulse could be cooling. With equities sitting at or near all-time highs, leadership concentrated in large caps, and valuations stretched, the market is more vulnerable to a shift in sentiment if next week’s housing data, Fed minutes, or Powell’s Jackson Hole remarks fail to reinforce the rate-cut narrative.
Need Help With Your Investing Strategy?
Are you looking for complete financial, insurance, and estate planning? Need a risk-managed portfolio management strategy to grow and protect your savings? Whatever your needs are, we are here to help.

💰 Inflation Data Still Shows No Tariff Impact
The July Consumer Price Index (CPI), the primary gauge of U.S. inflation data, rose 0.2% from June and held steady at 2.7% year-over-year. That result was slightly below the consensus forecast of 2.8%. On the surface, this headline number suggested stability and showed that tariffs have still not provided the inflationary push the media expected.

There was an increase in medical care. As discussed previously, for most families, the monthly housing and healthcare insurance premiums are fixed for a contractual period. The chart below shows three measures of inflation: headline, core, CPI less healthcare and housing. While inflation continues to decline, it is unsurprising that the rate of decline has slowed toward the pace of economic activity. What the pickup in medical care does project is that when renewals for healthcare insurance come next year, there will likely be a price increase.
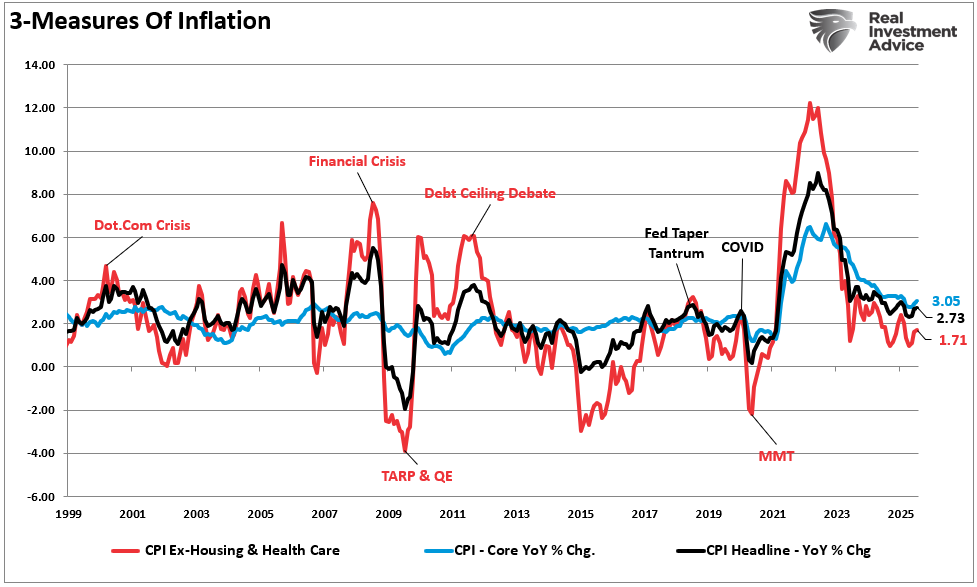
Furthermore, Core CPI, which strips out the more volatile food and energy components, climbed 0.3% on the month and 3.1% year-over-year. This split between headline and core inflation data is notable as energy prices, which declined during the month, kept the overall CPI from rising. Since mid-2023, headline CPI has been on a downward trend, falling from above 6% to below 3% by mid-2025. Core CPI, however, has proven stickier, rarely dipping below 3%. Much of this persistence is due to service-sector inflation, which tends to be less responsive to interest rate hikes than goods inflation.
Finally, this week’s Producer Price Index (PPI) confirmed what we have been saying: producers are eating the tariffs. While the PPI index showed a significant increase, it was almost entirely contained in trade services, where tariffs have an impact. However, if we look at the spread between the CPI and PPI indices, we see that companies cannot pass those tariffs through to their customers. The risk to investors is that if producers continue to absorb these tariffs, it will eventually show up in the compression of profit margins and earnings.

Crucially, economic activity creates the supply/demand imbalance that causes inflation. Given the deceleration in economic growth and personal consumption expenditures, it will only be a matter of time before inflation slows towards the Fed’s target of 2%.

While the markets interpreted July’s inflation data as soft enough to allow the Fed to cut rates, they overlooked the ongoing deterioration in economic activity, which will eventually manifest in corporate earnings.
However, for now, the markets are far more focused on the easing monetary policy to justify higher stock valuations.
But, Inflation Data Increases Odds Of Fed Rate Cuts
July’s inflation data significantly altered market expectations for Federal Reserve policy. Before releasing the CPI inflation data, traders placed the odds of a September rate cut at roughly 85%. However, after the release, those odds jumped to more than 92%. In other words, the market is certain, at least right now, the Fed will cut rates in September.

The Fed’s history shows that such a rapid expectation shift is rare. In the post-2008 era, rate cuts often followed clear signals of economic weakness or financial stress. For example, in 2019, the Fed cut rates three times quickly after trade tensions and slowing growth pushed inflation lower. In 2020, emergency cuts occurred as the pandemic hit, driving inflation briefly into negative territory. Currently, the Fed Funds rate remains significantly elevated above the inflation rate, suggesting that monetary policy is too tight, which is why markets eagerly anticipate rate cuts.

While inflation is slightly above the Fed’s target, it remains stable and on a “clear path towards our goals,” as Jerome Powell suggests. Furthermore, the labor market is softening, which provides further accommodation to cut rates without such action being interpreted as a “crisis response.” So far, from the market’s perspective, if the Fed cuts rates, it will be deemed a “preemptive easing to sustain growth while inflation is trending lower.”
Another concern for the Fed that is easing is the threat of tariff-induced inflation. Since Trump was elected, we have written several articles discussing why tariffs are not as inflationary as expected. The reasons were that 1) Producers pay tariffs, not consumers, 2) Consumers have choices, and 3) Importers can eat the tariff to remain competitive. As noted above, the latest inflation data shows muted impacts from tariffs. Furthermore, while our articles were mostly disregarded, Goldman Sachs released a report confirming much of our analysis.
“Following the implementation of China and auto tariffs, import prices (exclusive of tariffs) of both consumer and non-consumer goods from China, as well as import prices of passenger cars (exclusive of tariffs) from the EU and Japan, all experienced sharp declines. Foreign exporters had absorbed 14% of the cost of all tariffs implemented so far through June, their share will rise to 25% if the more recent tariffs follow the same pattern as the earliest tariffs on China.”

With the consumer showing signs of weakness, we will likely see foreign exporters absorb a chunk of the tariffs and domestic producers retain them. The consequence of that will be an impact on corporate margins more than a risk of future inflation.
Why the Inflation Data Sparked a Market Rally
Nonetheless, despite the risk to earnings and valuations, the release of July’s inflation data triggered an immediate rally in U.S. equities, with major indexes closing at or near record highs. The logic is straightforward: stable headline inflation increased the likelihood of near-term rate cuts, lowering discount rates for future earnings, primarily benefiting growth stocks. As such, Technology names led the way. Meta surged over 3%, Broadcom gained nearly 2%, while mega-cap leaders such as Microsoft, Apple, and Alphabet advanced more than 1%.
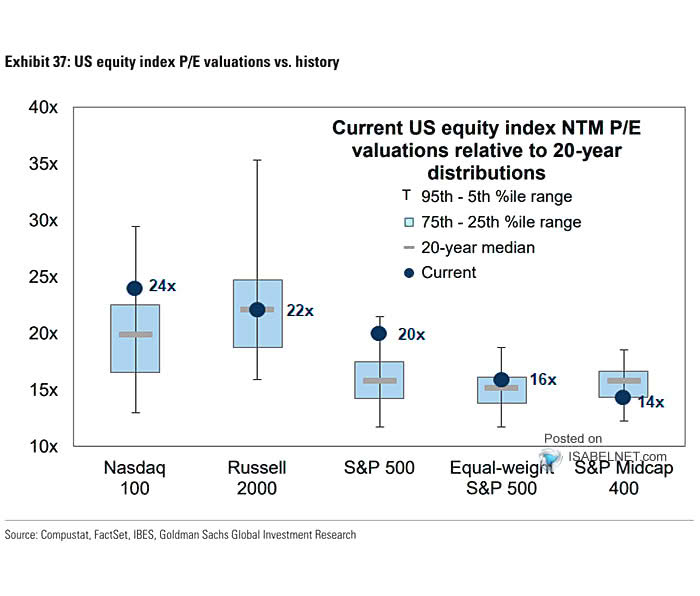
As noted above, the problem is that current market valuations have already absorbed whatever benefit to the discount rate a lower Fed Funds rate achieves. As shown, at 22x forward earnings, the current valuations for the S&P 5000 and Nasdaq are well above their 20-year ranges.
However, amid a bull market, valuations are a terrible timing tool, and sentiment overrides such metrics. Market history shows that such rallies are not unusual after cooler-than-expected inflation data. In the mid-1990s, for example, a string of softer CPI prints led the Fed to cut rates preemptively, sparking a two-year equity bull run. More recently, the sharp market rally in late 2023 began after CPI data surprised to the downside, cementing expectations that the Fed’s tightening cycle was over.
Beyond the Fed angle, July’s rally was also supported by positive macro headlines. A temporary extension of the U.S.–China tariff truce reduced trade-related uncertainty, but most importantly, earnings from major tech companies beat expectations, which continues to support forward valuations assumptions.

In combination, the July inflation data and these broader tailwinds created a rare moment of alignment: policy clarity, resilient corporate earnings, and easing geopolitical risk. All of that supported the bullish narrative.
While the July CPI numbers were encouraging, the road to sustained 2% inflation is far from certain. Service inflation remains sticky, and housing costs, though slowing, are still elevated. If core inflation fails to follow the headline number lower, the Fed may have to slow or halt any rate cuts in 2025. This means that upcoming inflation data releases will continue to be market-moving events for investors. A series of benign reports could reinforce the current rally, while a surprise to the upside could quickly reverse optimism.
The bottom line is that investors should remain invested for now, but remain somewhat cautious, as we have seen these narratives change quickly.
📒 Portfolio Tactics – Navigating Potential August Weakness
The July CPI report and subsequent market surge to new highs have investors walking a tightrope between optimism and caution. While inflation data offered the “Goldilocks” scenario, markets crave stability in the data. However, the underlying market structure suggests the path forward will require a disciplined approach.
While the S&P 500’s record-level breakout was fueled by rate-cut optimism, technical internals tell a more cautious story. Market breadth has been narrowing, with gains concentrated in a handful of mega-cap names. Momentum indicators are rolling over, and relative strength in cyclical sectors is fading. Historically, such divergences have preceded short-term pullbacks even in broader bullish trends. As such, investors who chase these types of markets without a plan risk being caught in a volatility spike.
- Rotate Toward Defensive Resilience: Defensive sectors, like Healthcare, Consumer Staples, and Utilities, tend to hold up better when economic data softens. Within technology, focus on firms with strong recurring revenue and fortress balance sheets rather than speculative growth names.
- Preserve Liquidity: Maintain higher cash or short-duration bond positions to exploit market pullbacks. With valuations extended, having dry powder for opportunistic buys is a strategic edge.
- Manage Interest Rate Exposure: A barbell bond strategy, holding short-term Treasuries and select longer-duration bonds, can capture yield while positioning for potential price appreciation if the Fed cuts rates.
- Keep Risk Controls in Place: Predefine entry and exit points. Use smaller position sizes in more volatile assets. This is not the moment for “all-in” positioning but for tactical adjustments.
Trade accordingly.

🖊️ From Lance’s Desk
This week’s #MacroView blog digs into the latest surge of insider selling at major corporations and why those actions reveal the fallacy that “buybacks are a return of capital to shareholders.”

Also Posted This Week:
- The Index Isn’t Always Accurate: Factors Influencing Yields – by Michael Lebowitz
- Meme Stock Trading & Livermore’s Approach To Speculation – by Lance Roberts
📹 Watch & Listen
Market breadth expanded this past week as investors piled into small and mid-cap stocks. But will it stick?
Subscribe To Our YouTube Channel To Get Notified Of All Our Videos
📊 Market Statistics & Analysis
Weekly technical overview across key sectors, risk indicators, and market internals

💸 Market & Sector X-Ray: Overbought
Last week, we noted that momentum and money flows remain weak, and Technology and Staples are overbought as the momentum chase continues. We also warned that investors should be mindful of the technical deterioration. This week, we saw the early stages of the rotation from risk-on assets to risk-off. Healthcare, small and mid-caps, and staples rallied, while late in the week, the Technology sector saw weakness. With the overall market still overbought, we could see a continuation of that rotation this week.

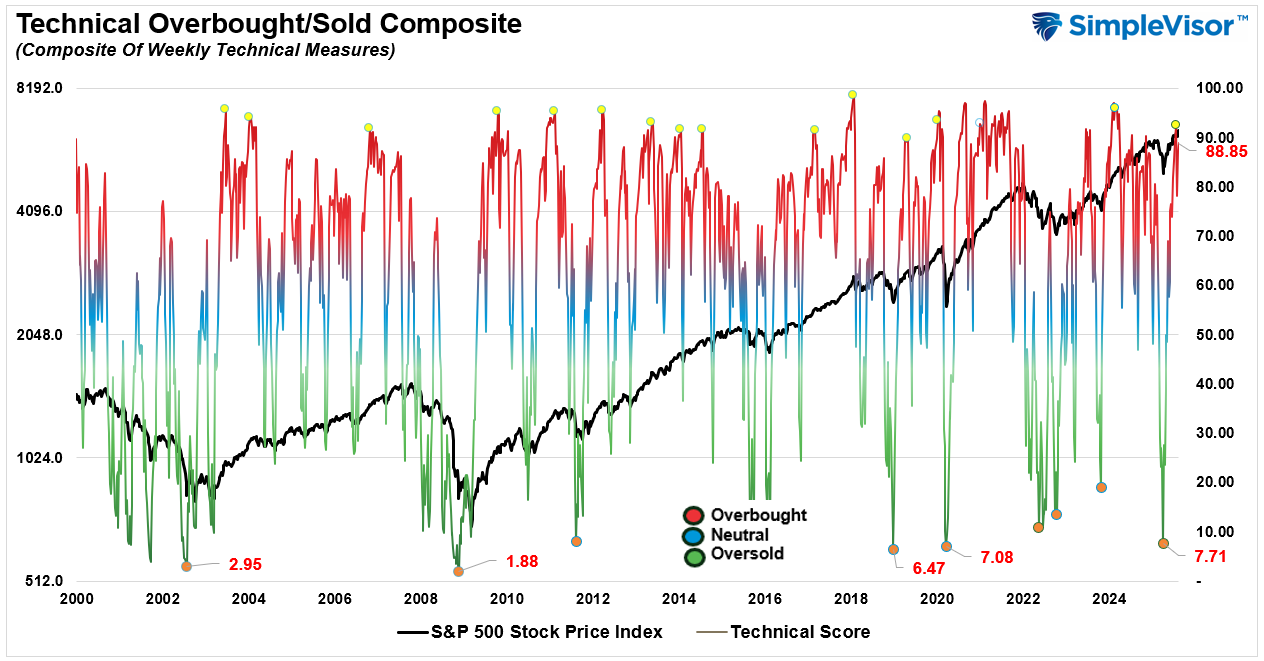
📐 Technical Composite: 88.85 – Overbought, Correction Risk Elevated
Despite the market weakness on Friday, the weekly technical composite increased from last week and is at levels that have preceded short-term corrections and consolidations. Risk levels have increased so risk management remains necessary.
🤑 Fear/Greed Index: 71.22 – Greed Increases With Rally
Last week, the market rallied as allocation and positioning rose from last week’s level of 66.90 to 71.22. While the increase was mild, it continues to suggest a more aggressive posture by investors in the markets, which keeps a larger corrective process from occurring. In other words, investors continue to aggressively “buy dips.”

🔁 Relative Sector Performance
Last week, we noted that:
“After a tough week, Energy and Healthcare are deeply oversold relative to the market itself. Investors continue to shun fundamentally strong companies in favor of higher beta Technology stocks, which remain overbought. A rotation will eventually occur.”
That rotation began this past week, with Healthcare performing well, along with Financials and Discretionary. Technology showed some signs of weakness as money rotated to more fundamentally based sectors. Keep a watch on Real Estate and Energy, which are very oversold and out of favor. The next chart shows some energy names to watch.

📊 Most Oversold Sectors
As noted above, Energy is now the market’s most oversold and unloved sector. Watch KMI, OKE, and XOM next week for early signs of rotation into the industry.

📊 Sector Model & Risk Ranges
Last week, we noted that technology significantly deviated above its long-term moving average, typically a good signal for reducing risk and rebalancing allocations. Conversely, we reported that Healthcare was trading well below its long-term average. Specifically, we stated, “such a backdrop is not unusual and provides an opportunity for a rotation between those markets and sectors from a contrarian viewpoint.” Unsurprisingly, we saw a sharp advance last week in healthcare, which has pushed it above its normal risk/range for the month. With only four bearish crossovers remaining, the health of the current bull market is intact, but that does not exclude short-term corrections and consolidations.

Have a great week.
Lance Roberts, CIO, RIA Advisors

