
We have recently switched charting systems to provide users with better functionality and tools for charting and analyzing stocks and ETFs.
You will need to CLEAR YOUR CACHE on your browser and then refresh your browser. It will take a few seconds for the new charting system to load the first time, so be patient.
Go to the RESEARCH tab and click CHART
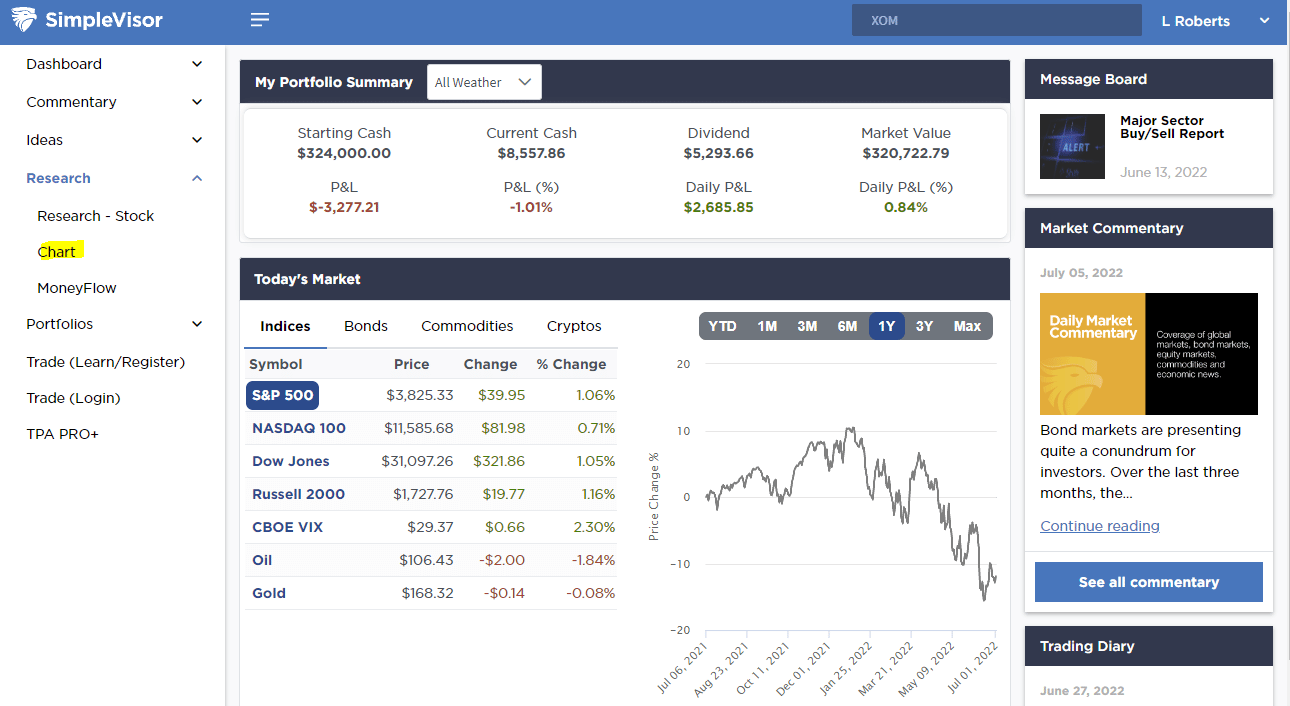
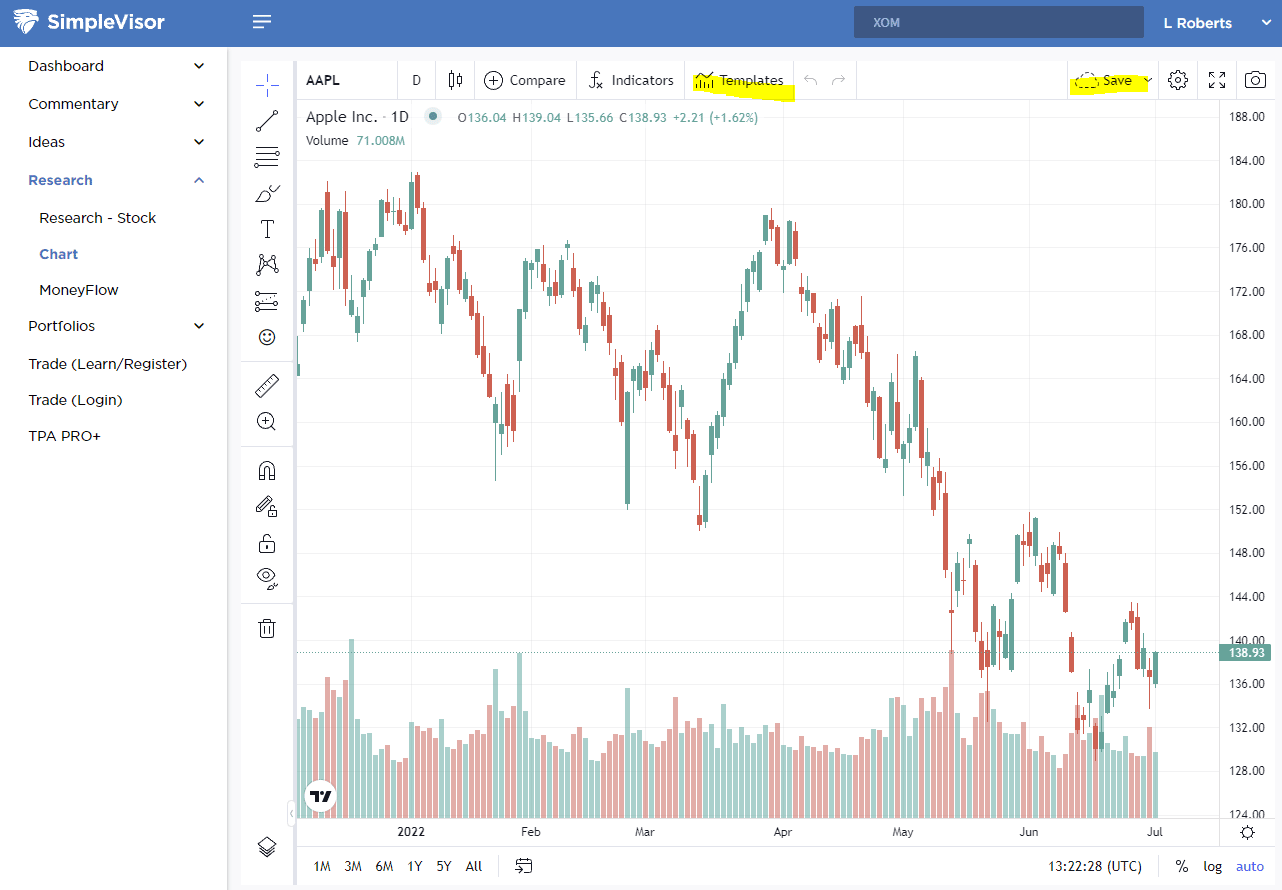
Once you click on CHART you will see the new charting system. Once you build your chart you can save the settings as a TEMPLATE for use with other symbols, OR just SAVE the chart for future reference.
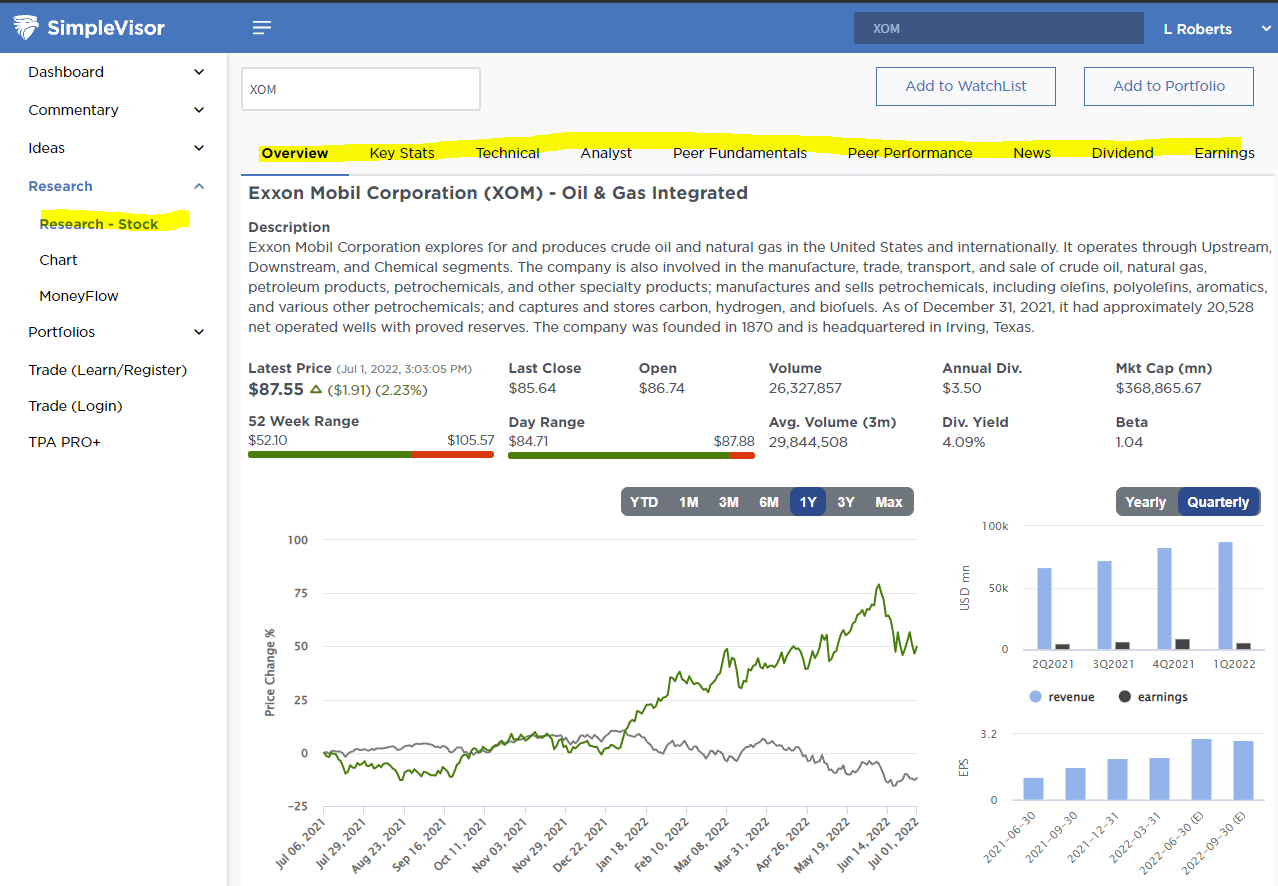
Lastly, if you are a newer user of Simplevisor, once you technically review a chart, click on RESEARCH STOCK for a deeper dive into it from a technical, analytical, and fundamental perspective.
If you have any questions or issues, email us at contact@simplevisor.com

