Inside This Week’s Bull Bear Report
- Confidence Dichotomy – Consumers Vs. Investors
- How We Are Trading It
- Research Report –Tax Cuts And Economic Growth
- Youtube – Before The Bell
- Market Statistics
- Stock Screens
- Portfolio Trades This Week
Technically Bullish
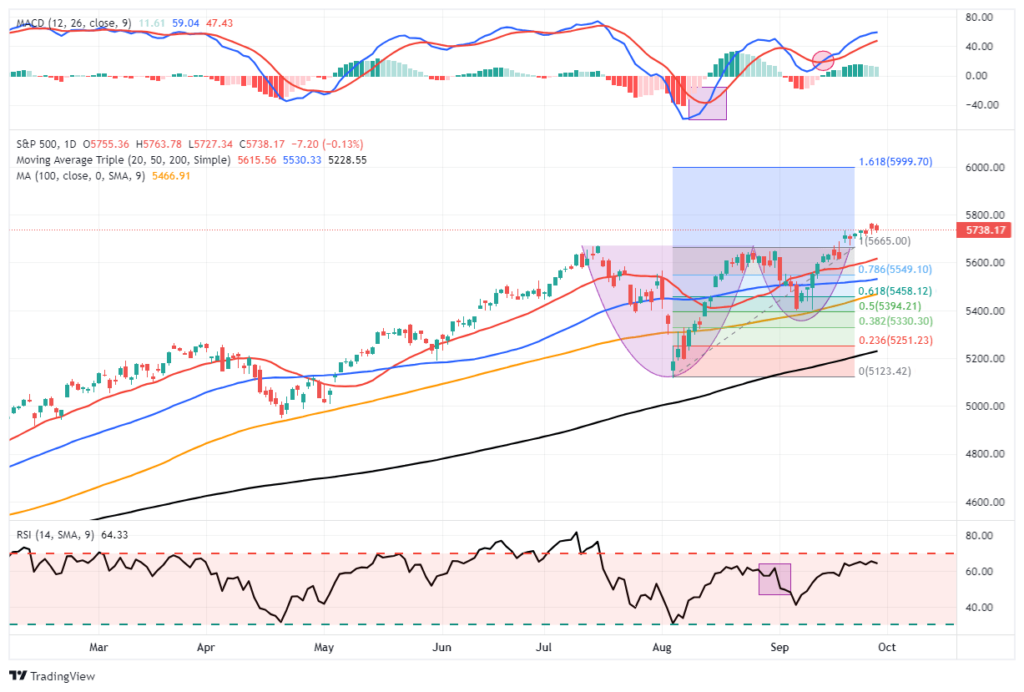
Last week, we noted “that from a purely technical perspective, the market remains on a bullish buy signal and has not become grossly overbought. On Friday, the market retested the breakout of the previous highs and held. Next week, if the market can hold these levels without breaking that support, the breakout will be confirmed, which should provide a bullish bias into the end of the month.”
Such remains the case this week. Notably, completing the “cup and handle” pattern suggests a potential further upside to 6000 by year-end. While that target may seem ambitious, it aligns with recent Wall Street upgrades.
“The pattern was first described by William J. O’Neil in his 1988 classic book on technical analysis, How to Make Money in Stocks. A cup and handle price pattern on a security’s price chart is a technical indicator that resembles a cup with a handle, where the cup is in the shape of a ‘u’ and the handle has a slight downward drift. The cup and handle pattern is considered a bullish signal, with the right-hand side of the pattern typically experiencing lower trading volume. The pattern’s formation may be as short as seven weeks or as long as 65 weeks.”
That pattern seems quite evident in the following chart of the S&P 500 index. With the breakout of the “cup and handle” formation in place, a further rally into year-end seems to be the logical next step. Such suggests that any near-term correction to relieve overbought conditions should remain confined to the bullish trend. In other words, investors should consider buying any near-term declines.
Just for reference, the last time we discussed a cup and handle formation was in December 2023, where we noted:
“That pattern seems quite evident in the following weekly chart of the S&P 500 index. With the breakout of the “cup and handle” formation in place, an attempt at all-time highs seems to be the logical next step. Any subsequent correction to relieve overbought conditions should maintain the bullish trend line from the March 2020 lows.”
While I received some pushback at the time, the market has rallied and set numerous new all-time highs this year.
However, while the market’s technical backdrop is extremely bullish and could remain that way for some time longer, this week’s consumer confidence readings certainly raise some concerns.
Need Help With Your Investing Strategy?
Are you looking for complete financial, insurance, and estate planning? Need a risk-managed portfolio management strategy to grow and protect your savings? Whatever your needs are, we are here to help.

The Confidence Game
It is an interesting time. Last week’s analysis noted the return of increasing bullish sentiment in investor positioning in the market. Of course, with the market already up more than 20% for the year, the need to “chase performance” has professional and retail investors pushing their chips onto the table.

However, what is interesting is the growing confidence dichotomy between investors and consumers (and in many cases, those are the same.) Notably, the stock market and consumer confidence are vital indicators often used to assess the economy’s health. While they frequently move in tandem, there have been notable periods in history when the stock market surged despite faltering consumer sentiment and vice versa. For investors, understanding the dynamics of a confidence dichotomy is crucial.
As such, we will delve into the relationship between consumer confidence and the stock market, analyze key historical moments when these two indicators diverged, and explore what typically happens when the stock market exuberance detaches from consumer sentiment. However, let’s start with consumer confidence.
Consumer confidence reflects the optimism or pessimism consumers feel about their financial situation and the state of the economy. The Conference Board’s Consumer Confidence Index (CCI) is one of this sentiment’s most widely used measures; the other is the University of Michigan Sentiment Index. Logically, when consumer confidence is high, individuals are more likely to spend, borrow, and invest, driving economic growth. Conversely, when confidence is low, consumers tend to save more and spend less, which can slow down the economy.
Confidence And Earnings
As former Fed Chairman Ben Bernanke pointed out in 2010, the link between consumer confidence and the stock market is critical to the Federal Reserve’s risk assessment.
“This approach eased financial conditions in the past and, so far, looks to be effective again. Stock prices rose and long-term interest rates fell when investors began to anticipate the most recent action. Easier financial conditions will promote economic growth. For example, lower mortgage rates will make housing more affordable and allow more homeowners to refinance. Lower corporate bond rates will encourage investment. And higher stock prices will boost consumer wealth and help increase confidence, which can also spur spending.”
The last sentence is crucial. The Federal Reserve depends on a rising stock market to boost consumer confidence. Creating a “wealth effect” makes people feel more financially secure, which increases economic activity. Notably, as we have discussed previously, and should be obvious, corporate earnings are derived from economic activity.
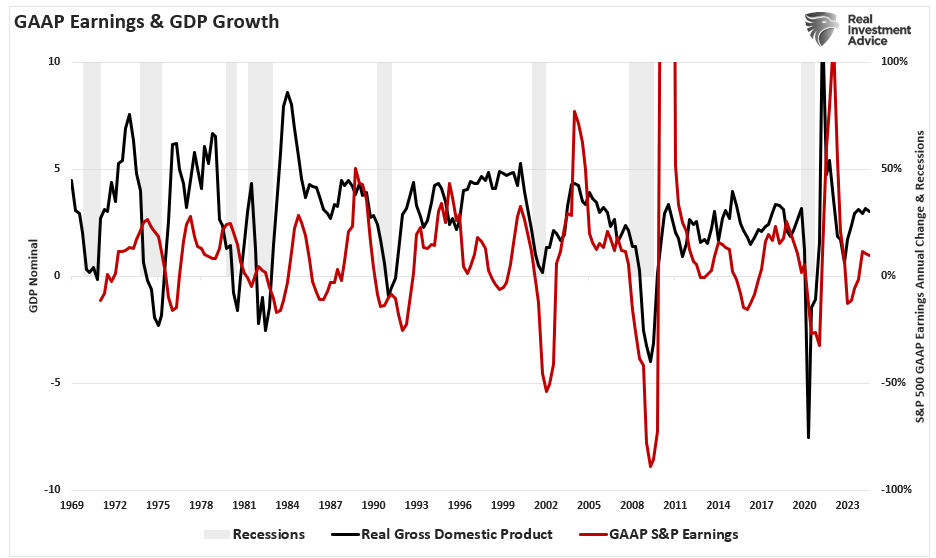
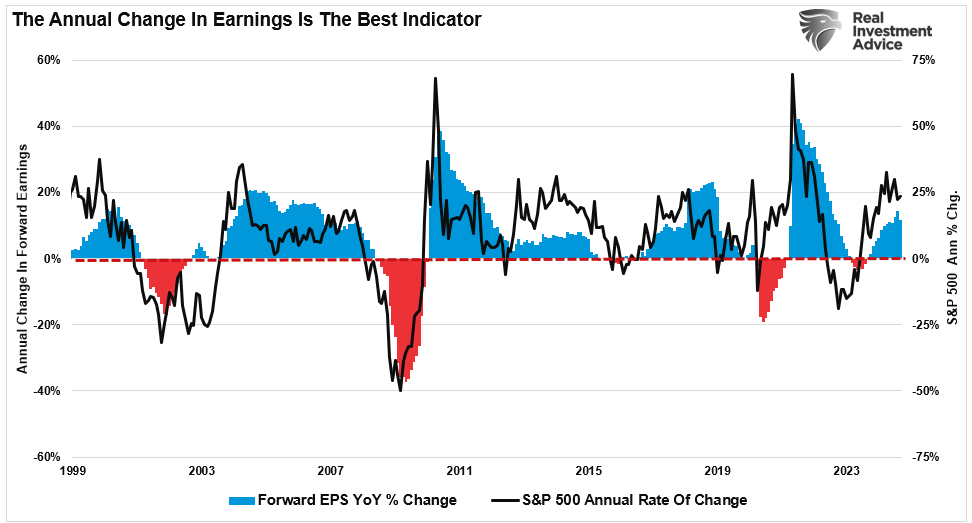
Naturally, if earnings are increasing, investors are willing to pay more today in exchange for increased earnings in the future, leading to higher asset prices. As shown many times, the annual earnings change is the best indicator of future stock market returns.

However, the “confidence game” to which the Federal Reserve pays attention isn’t always linear. Sometimes, the stock market rallies even when consumers are skeptical about the future, leading to a disconnect between Wall Street’s exuberance and Main Street’s reality. That particular confidence dichotomy exists currently, but it isn’t the first time.
The Confidence Dichotomy
The latest Conference Board Consumer Confidence Index dropped sharply in the latest reading. While expectations were for a small decline from 105.6 to 104, the actual reading came in at 98.7. Yet, at the same time, the market has surged unabated.

You will notice that confidence collapsed, as expected, in March 2020 and then sharply recovered as the Government sent $1500 checks to households. However, since then, the confidence trend has continued to trend lower as excess savings continue to erode. As noted by Albert Edwards this week, it could be claimed that the savings rate decline resulted from consumers dipping into their pandemic-era excess savings to support economic spending. However, that argument no longer holds

Given the drain in savings, combined with rising concerns over job loss, it is unsurprising that consumer confidence has continued to weaken.

However, consumer confidence in higher stock prices in the next year remains at the highest since 2018, following the 2017 “Trump” tax cuts.

Of course, the differential is that those with money invested in the financial markets are “feeling great” about their portfolio, just not so much with anything else.
However, the question is, is this “consumer dichotomy” an anomaly, or can we refer to previous periods? The answer is “yes.”
This Time Is Different?
The chart below is a composite consumer confidence index, the combined score of the University of Michigan and Conference Board measures. The composite gives us a broader measure of consumer confidence from a historical perspective. As shown, there have been three previous periods where the market rallied despite falling consumer confidence.

1. The Dot-Com Bubble (1999–2000)
One of the most famous examples of stock market exuberance detaching from consumer sentiment occurred during the dot-com bubble in the late 1990s. However, consumer confidence did not keep pace as the underlying economy weakened. By the early 2000s, cracks appeared in the economy and began to show in corporate earnings statements. The fallout from the dot-com bubble wiped out trillions of dollars in market capitalization, leading to a significant drop in consumer confidence and a mild recession.
2. The Global Financial Crisis (2007–2009)
The stock market experienced an impressive run in the years before 2008. However, consumer confidence began to falter as early as 2007. Concerns over the housing market festered as mortgage defaults rose in the subprime mortgage market. Despite the early warning signs, the stock market continued its climb until the realization that slowing economic growth and recession caused a market valuation correction. Consumer confidence plummeted alongside the market, and the U.S. economy entered the Great Recession, leading to a significant bear market and widespread financial pain.
3. COVID-19 Pandemic (2020)
The most recent example occurred in early 2020. As the virus spread across the globe, consumer confidence plummeted due to rising unemployment, widespread lockdowns, and uncertainty about the future. The composite sentiment index shows that while consumer confidence hit multi-year lows in April 2020, it struggled ahead of the pandemic’s onset.
What can we learn from this? While the stock market can initially remain optimistic, the dichotomy between the consumer and the financial markets is unsustainable. Eventually, confidence must align with the market or vice versa. Historically, as shown, it has been the latter as the markets are disappointed by the realization of slowing earnings growth.
Lastly, the one common ingredient of every realignment of the markets and weak consumer confidence was a recession and bear market.
Navigating A Confidence Dichotomy
When stock market exuberance becomes detached from consumer confidence, it previously signaled increased risk for investors. One last measure to review is the spread between what consumers “expect” in the future and their view of their present situation. Historically, whenever that spread spiked sharply higher, as recently, it was in concert with a recessionary onset. Yet, currently, investors are chasing every risk asset, from stocks to gold to options, with increasing levels of speculative fervor.

The divergence is fueled by speculative risk-taking, investor overconfidence, or external factors such as increases in monetary accommodation, which drive up asset prices even when economic fundamentals are weak.
As noted above, the Federal Reserve hopes that creating the “wealth effect” can bridge the gap between weak economic demand and an eventual recovery. Historically, as noted, these confidence dichotomies are eventually corrected, with stock markets falling back in line with economic reality. Investors who remain cautious and consider consumer confidence and market performance can better navigate these turbulent periods.
Here are a few key takeaways for investors during these periods of divergence:
- Monitor consumer confidence: When consumer confidence declines while the stock market rises, it could indicate risk to the current rally.
- Focus on fundamentals: A rising stock market driven by speculation rather than strong corporate earnings or economic growth may be vulnerable to corrections.
- Diversify portfolios: During periods of divergence, maintaining a diversified portfolio can help reduce exposure to market volatility and protect against downside risk.
- Prepare for corrections: History shows that markets often realign with economic fundamentals. Being prepared for a potential market correction can prevent significant losses.
Sure, this time could be different. But historically, investors who paid attention to declining consumer sentiment could have better positioned their portfolios to weather the downturn.
How We Are Trading It
The “confidence dichotomy” certainly suggests market risk from a historical perspective. However, this does not mean a “correction” or “recession” is imminent. What it does suggest is that investors must continue to monitor and manage portfolio risk to participate in what is a bullish market. When the “confidence dichotomy” eventually does impact the market, these risk management protocols will help shield portfolios from unexpected volatility increases.
If you are long equities in the current market, rebalancing risk is manageable.
- Tighten up stop-loss levels to current support levels for each position.
- Hedge portfolios against major market declines.
- Take profits in positions that have been big winners
- Sell laggards and losers
- Raise cash and rebalance portfolios to target weightings.
Notice, nothing in there says “sell everything and go to cash.”
Remember, our job as investors is pretty simple – protect our investment capital from short-term destruction so we can play the long-term investment game. Here are our thoughts on this.
- Capital preservation is always the primary objective. If you lose your capital, you are out of the game.
- Seek a rate of return sufficient to keep pace with the inflation rate. Don’t focus on beating the market.
- Keep expectations based on realistic objectives. (The market does not compound at 8%, 6% or 4%)
- Higher rates of return require an exponential increase in the underlying risk profile. This tends to never work out well.
- You can replace lost capital – but you can’t replace lost time. Time is a precious commodity that you cannot afford to waste.
- Portfolios are time-frame specific. If you have a 5-year retirement horizon but build a portfolio with a 20-year time horizon (taking on more risk), the results will likely be disastrous.
Have a great week.
Research Report
Subscribe To “Before The Bell” For Daily Trading Updates
We have set up a separate channel JUST for our short daily market updates. Please subscribe to THIS CHANNEL to receive daily notifications before the market opens.
Click Here And Then Click The SUBSCRIBE Button
Subscribe To Our YouTube Channel To Get Notified Of All Our Videos
Bull Bear Report Market Statistics & Screens

SimpleVisor Top & Bottom Performers By Sector

S&P 500 Weekly Tear Sheet

Relative Performance Analysis
We noted last week that the expected rally occurred with “laggards playing catchup.“ Financials, Energy, Technology, Utilities, Communications, and Discretionary are overbought. Staples and Bonds are decently oversold.” With the market up 20% year-to-date, I would not be surprised to see some consolidation or a small correction between today and the election. As noted at the opening of this week’s newsletter, after the election, we could see a push towards 5900-6000 on the index to close out the year.

Technical Composite
The technical overbought/sold gauge comprises several price indicators (R.S.I., Williams %R, etc.), measured using “weekly” closing price data. Readings above “80” are considered overbought, and below “20” are oversold. The market peaks when those readings are 80 or above, suggesting prudent profit-taking and risk management. The best buying opportunities exist when those readings are 20 or below.
The current reading is 83.28 out of a possible 100.

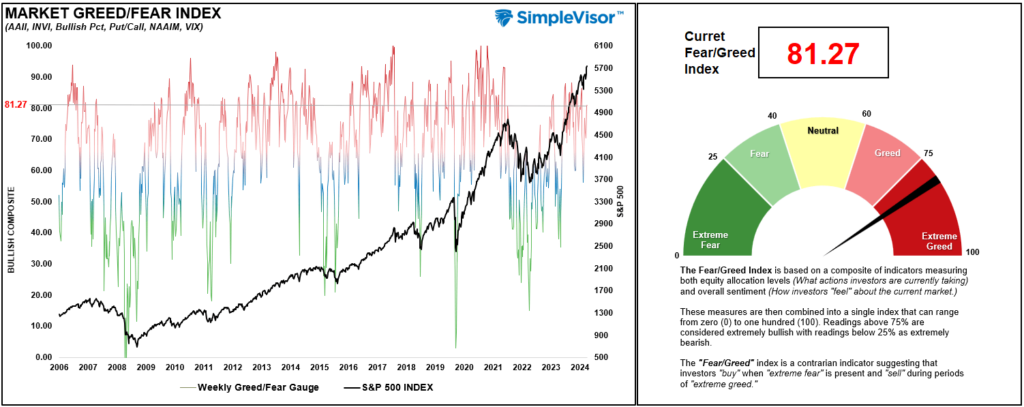
Portfolio Positioning “Fear / Greed” Gauge
The “Fear/Greed” gauge is how individual and professional investors are “positioning” themselves in the market based on their equity exposure. From a contrarian position, the higher the allocation to equities, the more likely the market is closer to a correction than not. The gauge uses weekly closing data.
NOTE: The Fear/Greed Index measures risk from 0 to 100. It is a rarity that it reaches levels above 90. The current reading is 81.27 out of a possible 100.
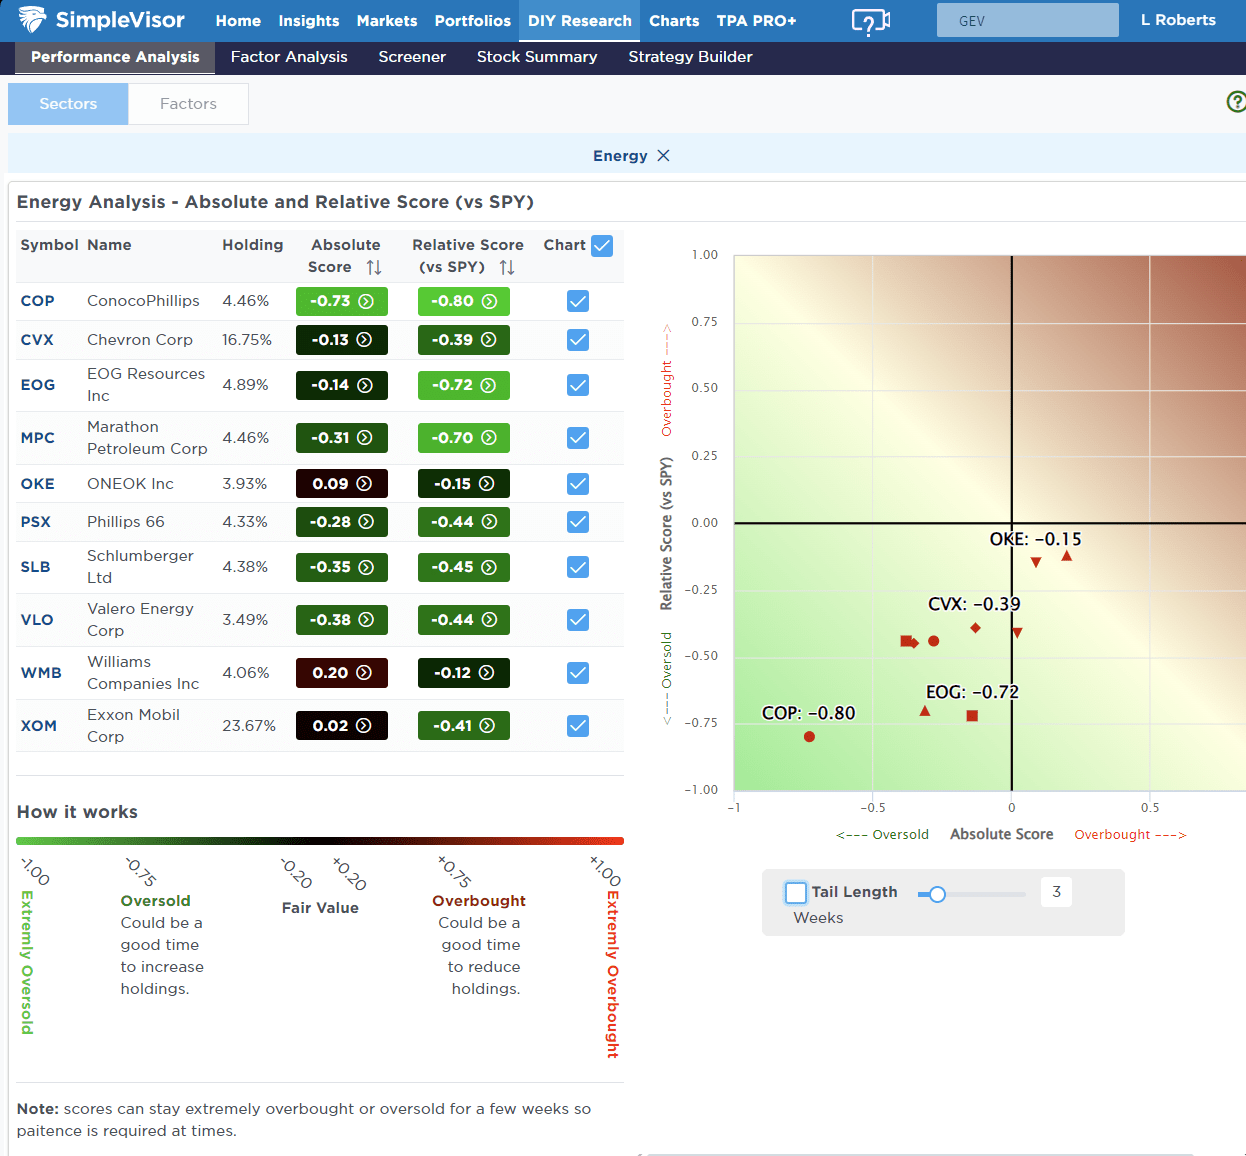
Relative Sector Analysis

Most Oversold Sector Analysis
Sector Model Analysis & Risk Ranges
How To Read This Table
- The table compares the relative performance of each sector and market to the S&P 500 index.
- “MA XVER” (Moving Average Crossover) is determined by the short-term weekly moving average crossing positively or negatively with the long-term weekly moving average.
- The risk range is a function of the month-end closing price and the “beta” of the sector or market. (Ranges reset on the 1st of each month)
- The table shows the price deviation above and below the weekly moving averages.
Following the breakout to new highs, the rally pulled investors back into familiar trades that have worked well this year. Utilities, Real Estate, Gold, and Gold Miners are overbought, pushing double-digit deviations. Take profits in these sectors and rebalance accordingly, as they will pull back. On the other hand, Energy is extremely oversold, and we are likely near a tradeable opportunity in that space. With almost all sectors on bullish crossovers, the bias is to the upside, so maintain equity exposure relative to your risk tolerance.

Weekly SimpleVisor Stock Screens
We provide three stock screens each week from SimpleVisor.
This week, we are searching for the Top 20:
- Relative Strength Stocks
- Momentum Stocks
- Fundamental & Technical Strength W/ Dividends
(Click Images To Enlarge)
RSI Screen

Momentum Screen

Fundamental & Technical Screen

SimpleVisor Portfolio Changes
We post all of our portfolio changes as they occur at SimpleVisor:
Sep 23rd
In the Equity and ETF models, we added exposure to the “Mega-cap” and Financial space, which should benefit from lower rates. Our models are very underweight Financials relative to the benchmark, so we are adding 2% of J.P. Morgan Chase to the Equity model and 2% to the Financial sector ETF (XLF).
On the “Mega-cap” side of the portfolio, we are adding Amazon (AMZN), which tends to perform better during the holiday shopping season, and increasing the Mega-cap Growth ETF (MGK) in the ETF model.
Lastly, on the bond side of the portfolios we are taking the first steps to increase our portfolio durations overall. We selling half of our iShares 3-7 Year Treasury Bond ETF (IEI) and adding that to the iShares 7-10 Year Treasury Bond ETF (IEF).
Equity Model
- Buy 2% of the portfolio in JP Morgan (JPM)
- Increase Amazon (AMZN) to 3.25% of the portfolio.
- Sell 50% of IEI
- Increase IEF with the proceeds of the sale from IEI.
ETF Model
- Buy 2% of the portfolio in the SPDR Financial Sector ETF (XLF)
- Add 2% of the Vanguard Megacap Growth ETF (MGK)
- Sell 50% of IEI
- Increase IEF with the proceeds of the sale from IEI.
Sep 26th
Earlier this week, we added 1% to our position in the Vanguard Megacap Growth ETF (MGK) in the ETF Model. We didn’t do anything in the Equity model at the time as we were waiting for Nvidia (NVDA) to break above its recent consolidation/correction channel. That breakout occurred yesterday. Therefore, after taking profits out of the position previously, we are underweight NVDA in our portfolio, adding 0.5% to the position to balance it across our model. Technically, the stock is a little overbought short-term, so this addition may not provide an immediate benefit. However, the recent report from Micron (MU) suggests the demand for AI chips remains alive and well.
Equity Model
- Add 0.5% to the existing position in Nvidia (NVDA)
Sep 27th
With the much-needed correction in bond yields in progress, we are taking the opportunity to shift some of our very short-duration bond holdings to a bit longer duration. In the ETF and Equity model, we are reducing the iShares 1-3 Year Treasury Bond ETF (SHY) and shifting it to the iShares 3-7 Year Treasury Bond ETF (IEI.) We are not changing our total bond weightings, just adjusting the holdings to extend the duration. As bond yields correct, we will continue this process across the bond portfolio.
In the Equity model, we are reducing GE Vernova (GEV) back to the target weight after an extensive run higher.
Equity Model
- Reduce GEV to 1% of the portfolio.
- Reduce SHY by 5% of the portfolio and increase IEI by the same amount.
ETF Model
- Reduce SHY by 5% of the portfolio and increase IEI by the same amount.
Lance Roberts, C.I.O.
Have a great week!

