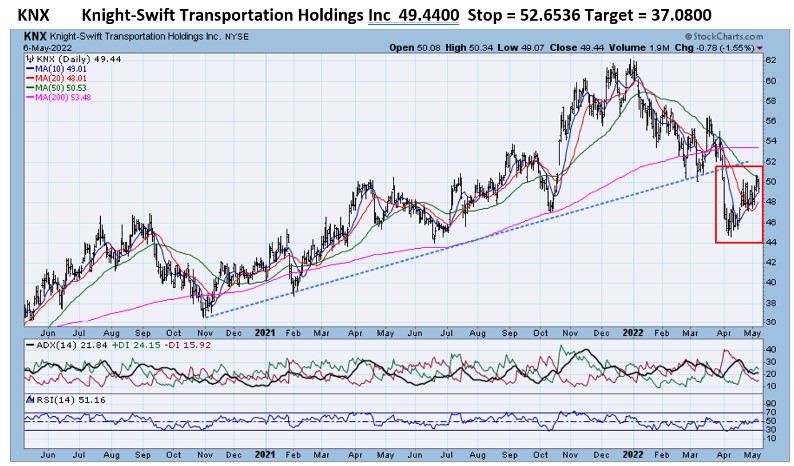
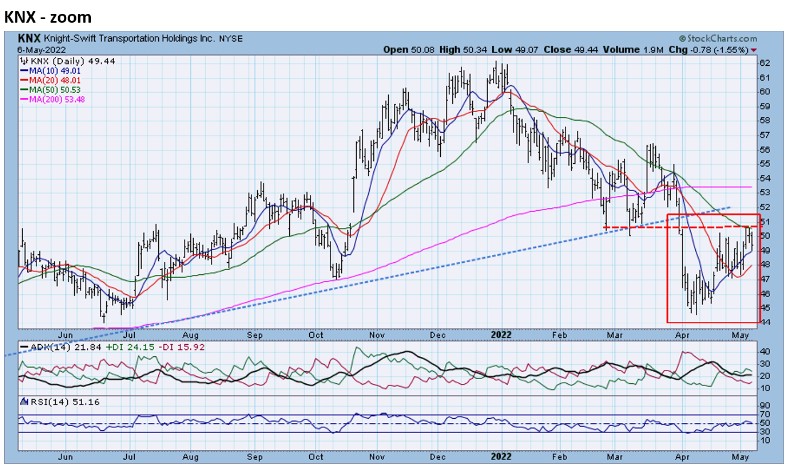
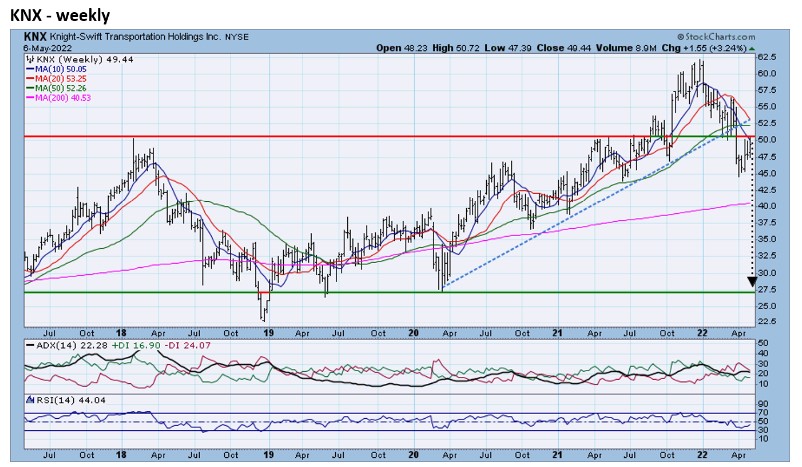
- KNX dove below its 17-month uptrend line in early April. KNX has now recovered, rallying almost 10% since the first week in April, but it is now facing resistance from the earlier breakpoint (zoom chart). The weekly chart reveals that the recent break makes KNX vulnerable to the 2018, 2019, and 2020 lows.
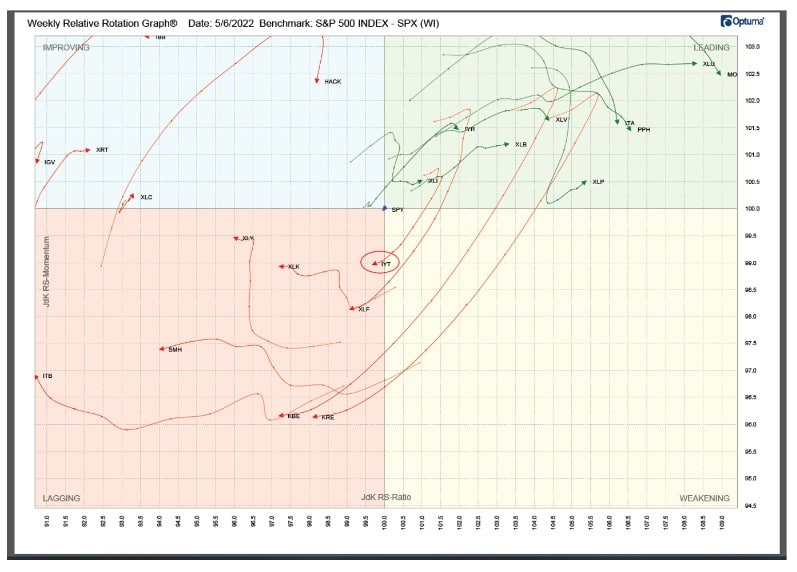
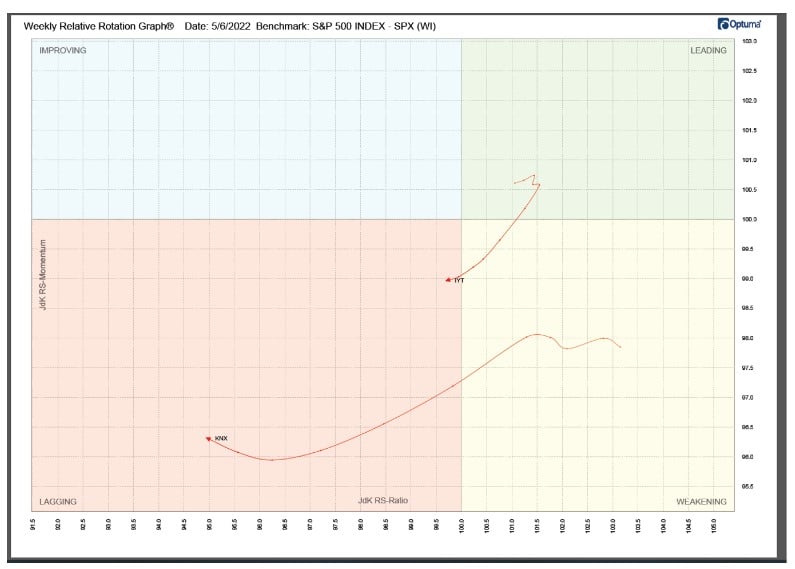
TPA-RRG analysis shows that:
- The Transportation sector has moved quickly into the Lagging quadrant and that…
- …KNX has established a position in the Lagging quadrant.
Relative Rotation Graphs (RRG) – explanation video