


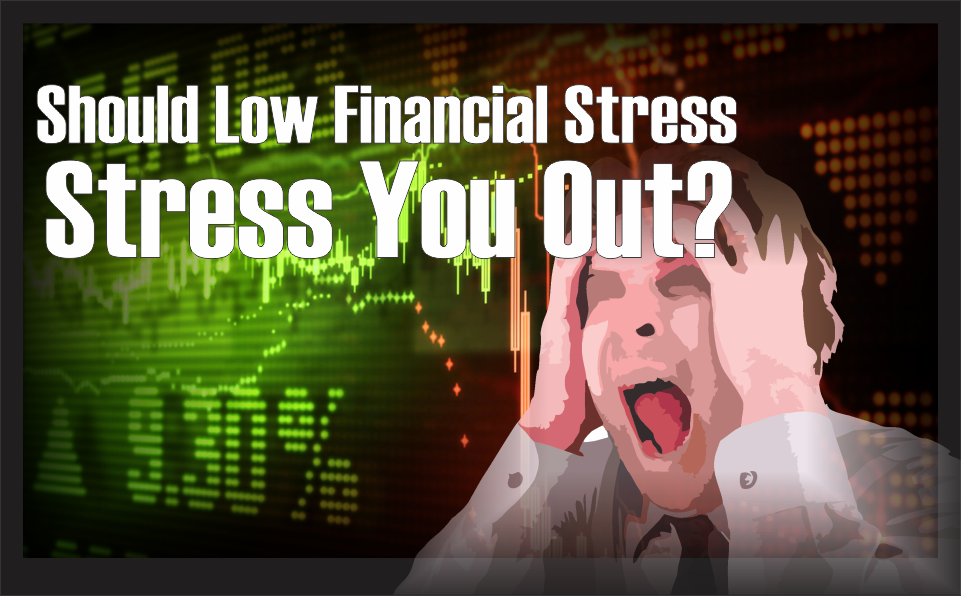
In this piece, I will discuss a little-followed, but valuable market indicator called the “St. Louis Fed Financial Stress Index.” According to the St. Louis Fed, this indicator was created in 2010 after economists sought a better way to track U.S. financial system stress in the wake of the 2008 financial crisis. This index uses 18 weekly data series: seven interest rate series, six yield spreads and five other indicators (mostly sentiment-related indicators). When the index is very high (such as in 2008), it means that the U.S. financial system is experiencing a great amount of stress. When the index is low (such as during an economic expansion and bull market), it means that the financial system is experiencing a low amount of stress.
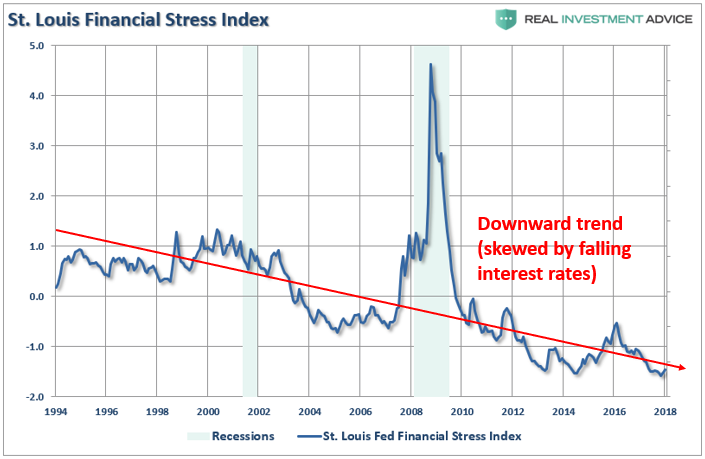
According to the chart below, U.S. financial system stress is currently at record lows:
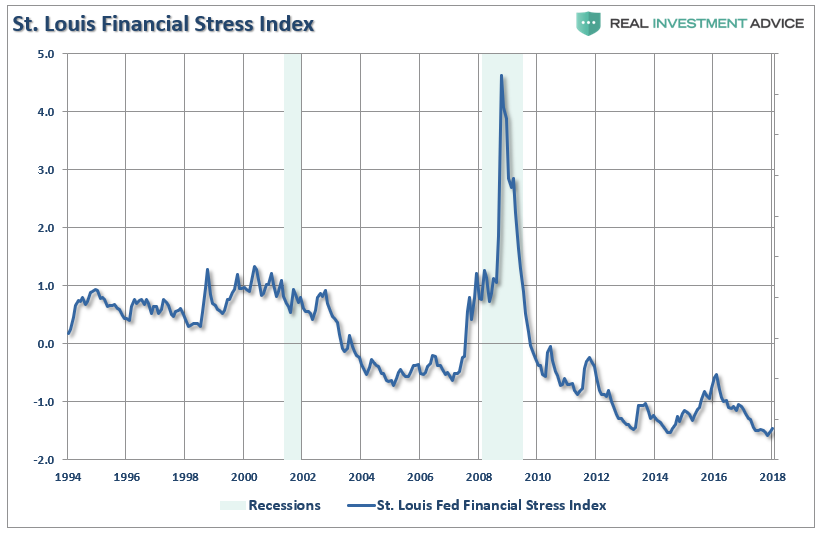
Source: St. Louis Fed
The table below shows the 18 weekly data series that comprise the St. Louis Fed Financial Stress Index:
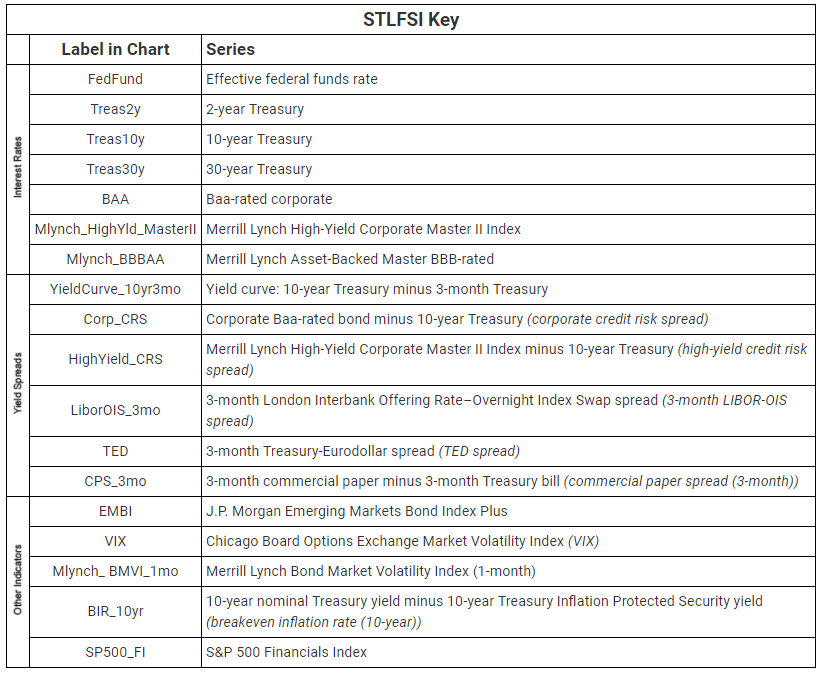
Source: St. Louis Fed
While the common interpretation of the St. Louis Fed Financial Stress Index is “low financial stress = good, high financial stress = bad,” I have a more nuanced, contrarian interpretation of it. Obviously, I would rather live in a low financial stress world (after all, I’m no misanthrope!), but my belief is that unusually low Financial Stress Index readings are indicative of the investor complacency seen during dangerous economic bubbles that ultimately lead to 2008-like crises and their concomitant high financial stress readings. In a true free market economy, this wouldn’t necessarily be the case, but it is the case in a central bank-manipulated environment like we’ve had for the past several decades. As an Austrian economist, I believe that central bank meddling in financial markets creates massive imbalances and bubbles that lead to crises.
According to the chart below (with my comments added in red), dangerous economic bubbles form during relative troughs in the St. Louis Fed Financial Stress Index. The late-1990s Dot-com bubble formed when the index was at a relative low, as did the mid-2000s U.S. housing and credit bubble, and I believe that the “Everything Bubble” is forming during the current trough. The “Everything Bubble” is a bubble that is inflating in numerous global assets and sectors (including tech startups, U.S. equities, global bonds, some segments of the U.S. property market, property in China, emerging markets, Australia, Canada, and more) as a result of unprecedented central bank stimulus since the global financial crisis.
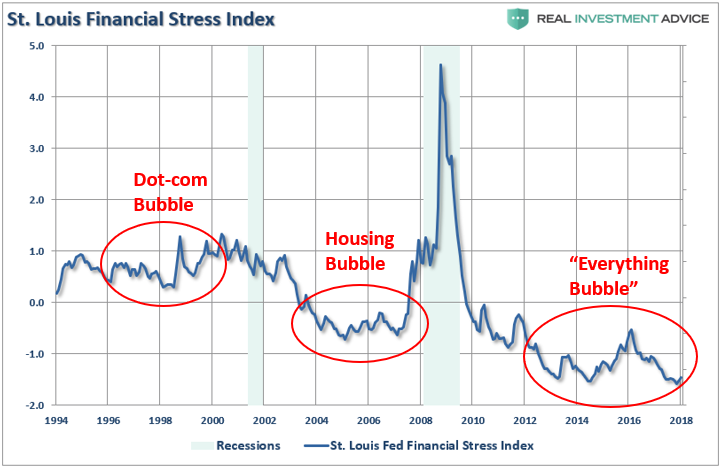
Source: St. Louis Fed
One of the reasons why the St. Louis Fed Financial Stress Index has been so low since the 2008 financial crisis is that U.S. interest rates have been at record low levels for a record length of time, and a full 18 out of 20 of the index’s components are bond or interest rate-related.
The U.S. Federal Reserve has manipulated interest rates by keeping them extremely low, which has led to the inflation of bubbles throughout the economy. As the chart below shows, bubbles form during periods of low interest rates. In this case, “low” is all relative because interest rates have been trending lower since the early-1980s, which is why asset and credit bubbles are becoming more extreme than in the past. Most people are unaware of how extreme our current bubble is, but it will certainly be another case of “only when the tide goes out do you discover who’s been swimming naked” (to quote Warren Buffett).
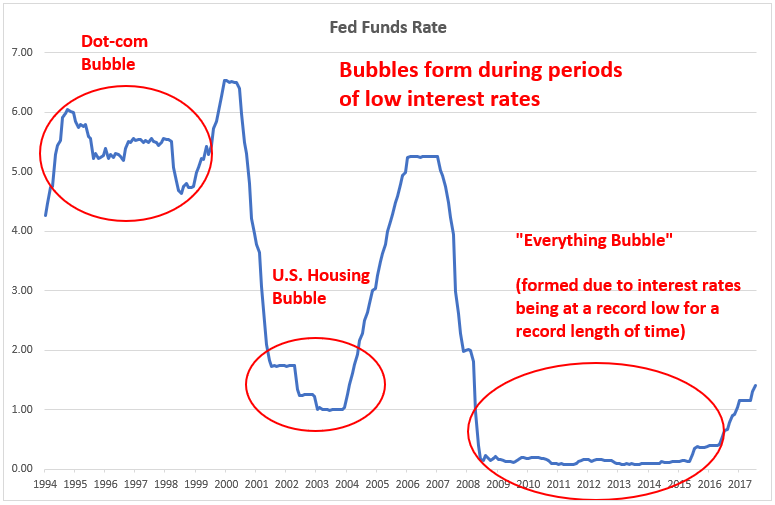
Source: St. Louis Fed
Here’s an important caveat: the longer-term downward trend in interest rates explains why the St. Louis Fed Financial Stress Index has been trending lower over the past few decades. This is the reason why a “low” index reading in the 1990s was anything from 0.0 to 1.0, while a “low” reading in the mid-2000s was 0.0 to -1.0, and a “low” reading after 2008 was anything under -0.5. Without taking into account the long-term interest rate downtrend, one could make the mistake of believing that financial stress was actually much higher in the 1990s than in the period after the 2008 financial crisis, which is not the case.
Source: St. Louis Fed
Though the St. Louis Fed Financial Stress Index is certainly not a short-term market timing indicator, it is a very useful tool for spotting and monitoring the development of dangerous economic bubbles and associated investor complacency. Inevitably, some critics will claim “the Stress Index has been low for nearly a decade and the market keeps going up…that means there’s no bubble!,” to which I will answer “no, that just means that this bubble going to be larger and even more destructive than the bubbles we’ve experienced in the past.”
Please follow or add me on Twitter, Facebook, and LinkedIn to stay informed about the most important trading and bubble news as well as my related commentary.


Lance Roberts is a Chief Portfolio Strategist/Economist for RIA Advisors. He is also the host of “The Lance Roberts Podcast” and Chief Editor of the “Real Investment Advice” website and author of “Real Investment Daily” blog and “Real Investment Report“. Follow Lance on Facebook, Twitter, Linked-In and YouTube
Customer Relationship Summary (Form CRS)
Also Read


