


I recently published an article discussing why “recessions” are a good thing by reverting debt buildups excesses during expansions. The argument against debt reversions is always the same in that “debt-to-income” ratios low. To wit:
“One reason (of many) we don’t need a debt reversion is that household debt service costs (interest etc.) as a % of household incomes are currently at a 40 year low.” – S. Porter
If you look at a chart, it certainly would seem that would be the case.
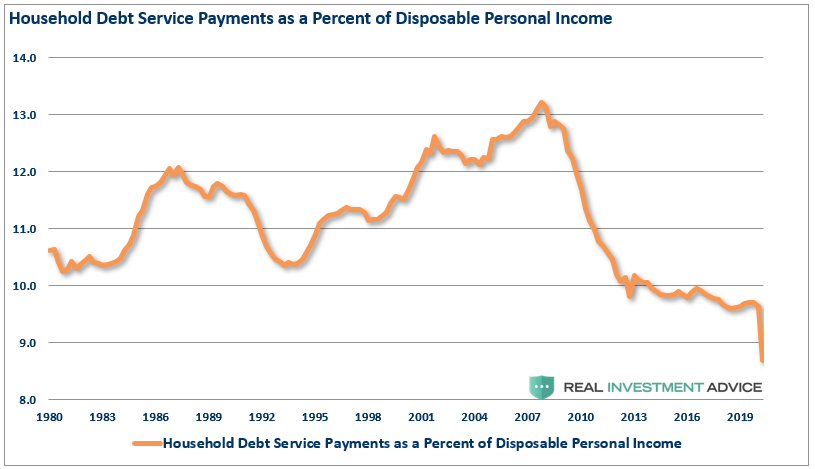
But, like most data from the Federal Reserve, you have to dig behind the numbers to reveal the real story.
So let’s do that, shall we?
This is exactly why the Fed's "Debt to income ratios" are wrong. (The ratios are heavily skewed by the top 10% of income earners. Bottom 80% in debt up to their eyeballs.) pic.twitter.com/rb4wx3XAXA
— Lance Roberts (@LanceRoberts) January 23, 2020
Living The Dream
Every year, most Americans go further into debt just to “sustain” their standard of living. To wit:
“In 1998, monetary velocity peaked and began to turn lower. Such coincides with the point that consumers were forced into debt to sustain their standard of living. For decades, WallStreet, advertisers, and corporate powerhouses flooded consumers with advertising to induce them into buying bigger houses, televisions, and cars. The age of ‘consumerism’ took hold.“
The idea of “maintaining a certain standard of living” has become a foundation in society currently. The average American believes they are “entitled” to a specific type of house, car, and general lifestyle. Such includes living necessities such as food, running water, electricity, and the latest mobile phone, computer, and high-speed internet connection. (Really, what would be the point of living if you didn’t have access to Facebook every two minutes?)
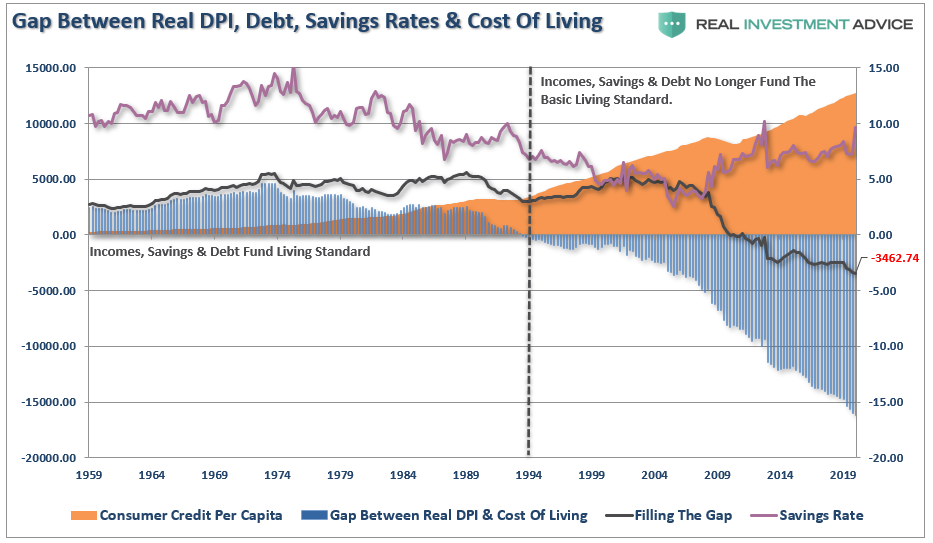
However, maintaining this “entitled” lifestyle requires money, and as shown above, when income and savings run short, debt fills the gap.
The Illusion Of Debt Reduction
One of the headline stories of late has been the sharp decline in credit balances as individuals were rapidly paying down credit.
Such isn’t the case.
Each quarter, the Federal Reserve Bank of New York releases its quarterly consumer debt composition and balances survey. (Note that consumers are at near-record debt levels and roughly $1.5 Trillion more than in 2008.)

See that little decline from the recent peak? That is the deleveraging cycle picked up by the media.
However, when we break down the data, a very different picture emerges.
The average American has $90,460 in debt. A recent CNBC article broke down how much debt Americans have at every age.
“Here’s the average debt balances by age group:
- Gen Z (ages 18 to 23): $9,593
- Millennials (ages 24 to 39): $78,396
- Gen X (ages 40 to 55): $135,841
- Baby boomers (ages 56 to 74): $96,984
- Silent generation (ages 75 and above): $40,925
According to Experian, consumers in the two oldest age categories have seen a significant decrease in debt since 2015 (about -7.5% for baby boomers and -7.7% for the silent generation overall).
Meanwhile, millennials have seen the largest increase in debt in the last five years: In 2015, the average millennial had about $49,722 in debt, and by 2019 they carried an average of $78,396 in total debt — an increase of 58%,”
A Function Of Income
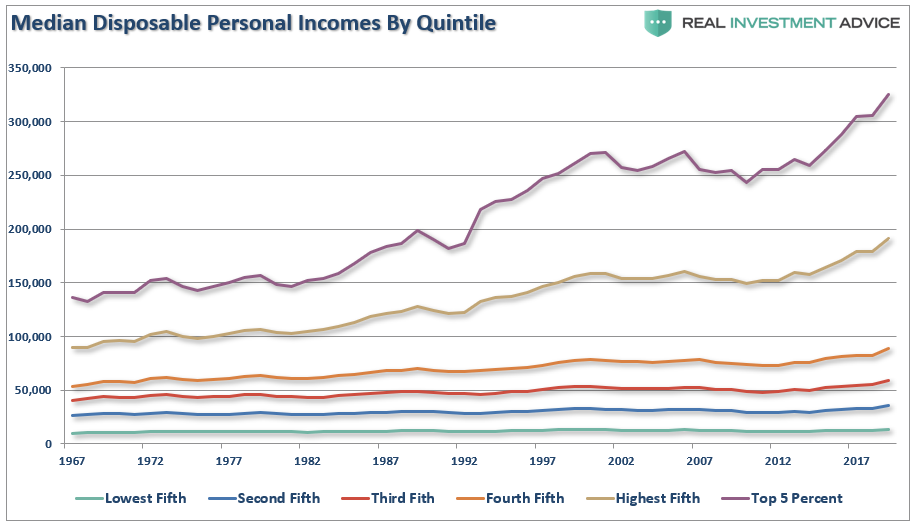
Much of the analysis touted by the media use either “averages” or “median” measures of a particular set of data. While there is nothing inherently wrong in reporting such data, the message sent can get distorted when there is a skew in the underlying data set.
Such is particularly the case when it comes to disposable incomes. The calculation of disposable personal income (which is income fewer taxes) is mostly a guess due to the variability of households’ income taxes.
More importantly, the measure becomes skewed by the top 20% of income earners, needless to say, the top 5%. As shown in the chart below, those in the top 20% have seen substantially larger median wage growth versus the bottom 80%. (Note: all data used below is from the Census Bureau and the IRS.)
Furthermore, disposable and discretionary incomes are two very different animals.
Discretionary income is the remainder of disposable income after paying for all of the mandatory spendings like rent, food, utilities, health care premiums, insurance, etc.
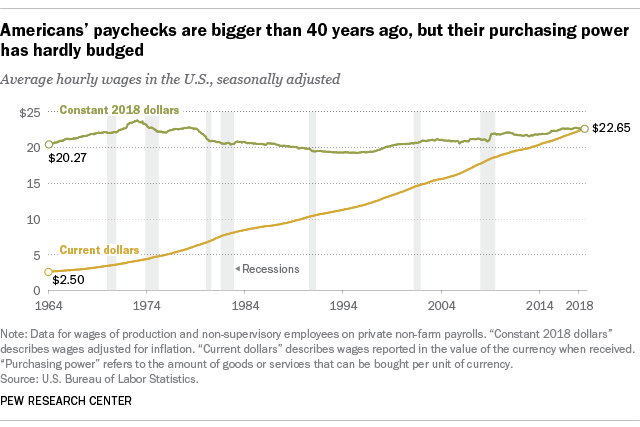
From this view, the “cost of living” has risen much more dramatically than incomes. According to a previous Pew Research study:
“In fact, despite some ups and downs over the past several decades, today’s real average wage (that is, the wage after accounting for inflation) has about the same purchasing power it did 40 years ago. And what wage gains there have been have mostly flowed to the highest-paid tier of workers.”
In other words, given the bulk of the wage gains are in the upper 20%, any data that reports a “median” or “average” of the information is inherently skewed to the upside.
Data Skew
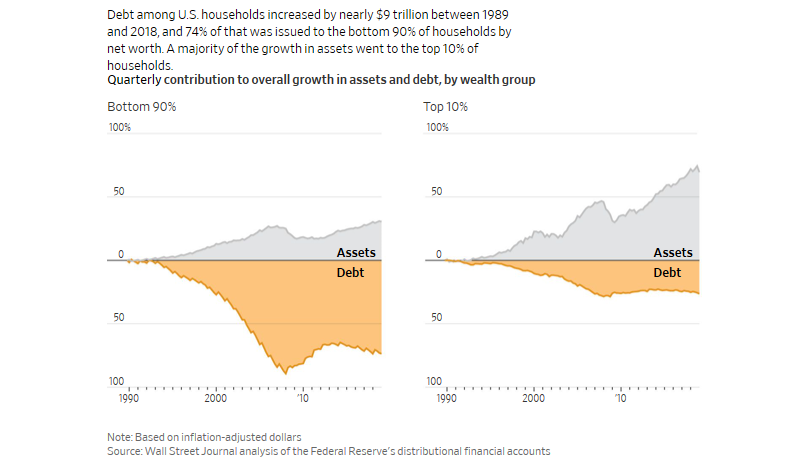
Again, when you see data using “medians” or “averages,” such is not incorrect. However, the assumptions are skewed by the “wealth and income” gap in the top 20% of the population. Such was a point put forth previously by the WSJ:
“The median net worth of households in the middle 20% of income rose 4% in inflation-adjusted terms to $81,900 between 1989 and 2016, the latest available data. For households in the top 20%, median net worth more than doubled to $811,860. And for the top 1%, the increase was 178% to $11,206,000.”
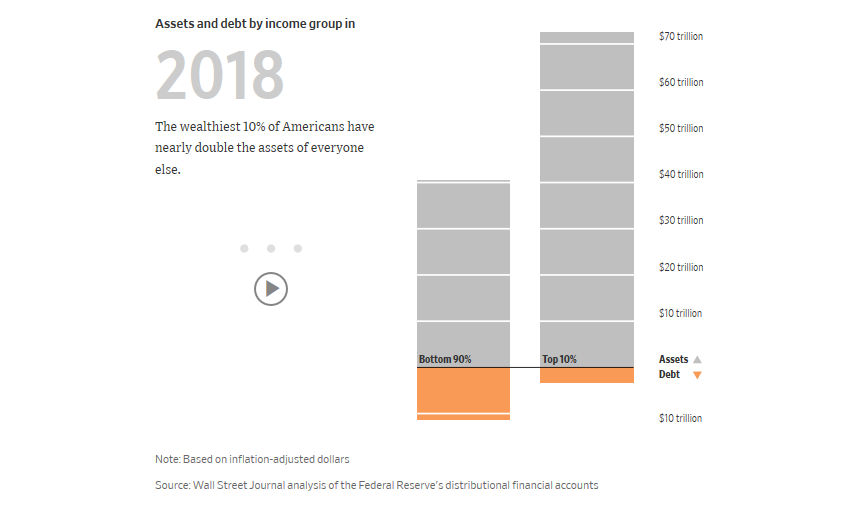
“Put differently, the value of assets for all U.S. households increased from 1989 through 2016 by an inflation-adjusted $58 trillion. A full 33% of that gain—$19 trillion—went to the wealthiest 1%, according to a Journal analysis of Fed data.”
Given this information, it should not be surprising that personal consumption expenditures, which make up roughly 70% of the economic equation, must be supported by surging debt levels to offset the lack of wage growth in the bottom 80% of the economy.
More importantly, despite low debt-to-income ratios, the percentage of government transfer payments (social benefits) now comprises 1/4th of real disposable incomes. Today, nearly 1-in-4 families in the U.S. receive some form of Government assistance.

The study also noted the data anomaly:
“Government transfer payments have ‘offset only a small fraction of the increase in pre-tax inequality,’ Piketty, Saez, and Zucman conclude—and those payments fail to bridge the gap for the bottom 50 percent because they go mostly to the middle class and the elderly.”
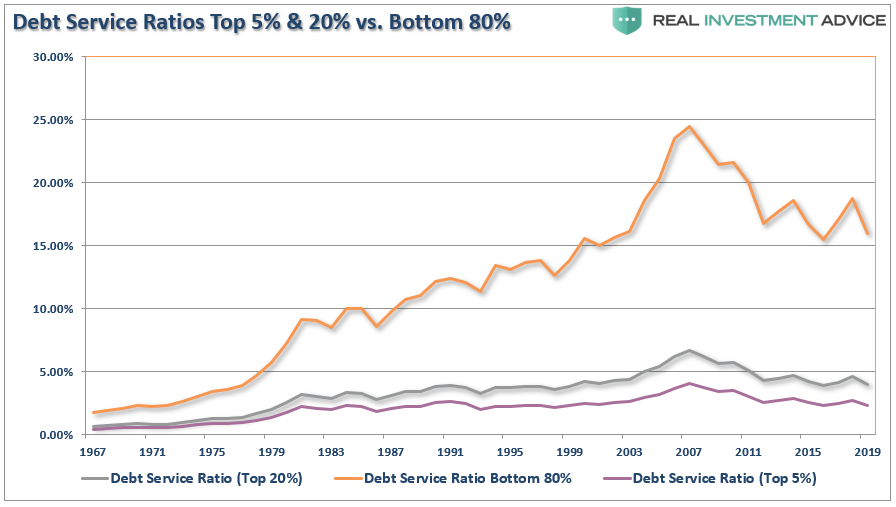
Real Debt-To-Income Ratios
Here is the point. There is a vast difference between the level of indebtedness (per household) for those in the bottom 80% versus those in the top 20%.
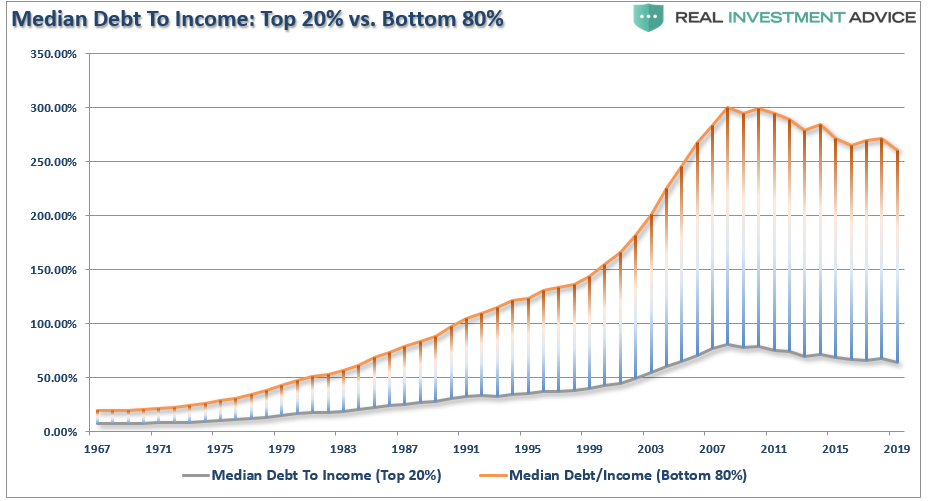
Of course, the only saving grace for many American households is that artificially low-interest rates have reduced the average debt service levels. Unfortunately, those in the bottom 80% are still having a large chunk of their median disposable income eaten up by debt payments. Such reduces discretionary spending capacity even further.
The problem is quite clear. With interest rates already at historic lows, the consumer already heavily leveraged, and wage growth stagnant, the capability to increase consumption to foster higher economic growth rates is limited.
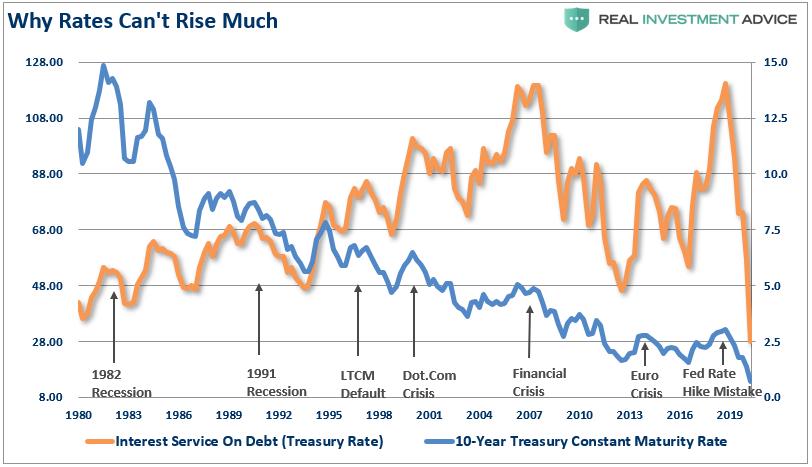
Such is also why interest rates CAN NOT rise by very much without triggering a debt-related crisis. The chart below is the interest service ratio on total consumer debt. (The graph is exceptionally optimistic as it assumes all consumer debt benchmarks to the 10-year treasury rate.) While the media proclaims consumers are in great shape because interest service is low, it only takes small increases in rates to trigger a “recession” or “crisis” event.
An Illusion Of Prosperity
The illusion of the decline in the debt-to-income ratios obfuscates real economic problems and fosters the belief that policies are working.
They aren’t.
The majority of Americans cannot increase consumption, the driver of economic growth, without further increasing debt burdens. For those in the top-10% of the wealth holders, higher asset prices, tax cuts, etc. do not lead to increases in consumption as they are already at capacity.
While the Federal Reserve’s ongoing interventions, stimulus programs, etc. have certainly boosted asset prices higher, the only real accomplishment has been a widening of the wealth gap. What monetary interventions have failed to accomplish is an increase in production to foster higher economic activity levels.
With the average American still living well beyond their means, the reality is that economic growth will remain mired at lower levels. Such is because the debt service continues to divert savings from productive investment. Of course, the issue is a central theme to the U.S. and the global economy.
The Debt Must Revert
The “structural shift” is quite apparent as high debt levels prohibit the productive investment necessary to fuel higher production rates, employment, wage growth, and consumption.
In the future, many will look back and ask the critical questions:
- Why did the government fail to use artificially low-interest rates and excessive liquidity to support the financial system’s deleveraging?
- With such low rates and liquidity support, why didn’t they refinance government debts and restructure unfunded social welfare systems?
- Why did they insist on continuing to go further into debt rather than working on real solutions to create a more prosperous economy for all?
The answer is that no one is willing to admit there is a problem. Nor are they willing to accept they have a responsibility in it. Politicians want to get re-elected. Individuals would preferably depend on government handouts rather than admit their financial failures.
Unfortunately, until the deleveraging cycle is allowed to occur, the attainment of more robust and autonomous economic growth will remain elusive.
In the meantime, those in the top 10% of income brackets will continue to enjoy an increase in overall prosperity. For everyone else, it is highly unlikely that debt-to-income ratios have improved much.


Lance Roberts is a Chief Portfolio Strategist/Economist for RIA Advisors. He is also the host of “The Lance Roberts Podcast” and Chief Editor of the “Real Investment Advice” website and author of “Real Investment Daily” blog and “Real Investment Report“. Follow Lance on Facebook, Twitter, Linked-In and YouTube
Customer Relationship Summary (Form CRS)
Also Read


