


A very dangerous fallacy has taken the world of economics by storm over the last several years: the idea that there is very little inflation in the U.S. economy, therefore interest rates should remain at unusually low levels for an even longer period of time. As I will prove in this piece, the people who believe in the “low inflation” myth are being fooled by the fact that inflation in this unusual, central bank-driven economic cycle is concentrated in asset prices rather than in consumer prices. By holding interest rates too low for too long, a massive asset bubble has inflated and is poised to inflate even further as long as economists and central banks like the Fed continue to be fooled by the “low inflation” myth. Unfortunately, the ultimate bursting of this unprecedented asset bubble is going to throw the U.S. and global economy into another depression.
One of the most fervent believers in the “low inflation” myth is President Donald Trump himself. Trump has complained many times about the Fed’s interest rate hikes that have occurred during his presidency. Over the past three years, the Fed hiked rates from 0% to 2.5%, which is still extremely low considering that rates above 5% were common throughout history. As Trump said earlier this month –
“Well I personally think the Fed should drop rates,” Mr. Trump said. “I think they really slowed us down. There’s no inflation. I would say in terms of quantitative tightening, it should actually now be quantitative easing. Very little if any inflation. And I think they should drop rates, and they should get rid of quantitative tightening. You would see a rocket ship. Despite that, we’re doing very well.”
Trump reiterated his “no inflation” belief in a tweet yesterday:
Neel Kashkari, president of the Federal Reserve Bank of Minneapolis, recently summarized the Fed’s position that inflation is still low and even believes that the Fed should let inflation run above its target for a few years:
Many prominent financial journalists and commentators including my friend Pedro da Costa believe that the Fed has been hiking interest rates too aggressively:
The well-known investing pundit and host of CNBC’s “Mad Money” TV show Jim Cramer is a vocal Fed rate hike critic and believer in the “low inflation” myth:
“Memo to Powell: keep listening. Be patient. Enjoy the employment gains. Let’s keep the strength going by waiting a little and not being too judgmental about rate hikes like some of your colleagues,” Cramer said.
The “Mad Money ” host reiterated his distaste in some Fed officials’ tendency to stick to traditional metrics when gauging how the economy is doing.
“How can you claim to be data-dependent if you’ve made up your mind before you see the data that you need one or two more rate hikes to get back to normal?” he asked. “Normal is where the data says you should go. Normal is the natural progression of jobs being created without a lot of inflation. Normal is not a percent.”
Belief in the “low inflation” myth stems from the overly rigid reliance on conventional inflation indicators even though we have been in an unconventional economic cycle since 2009 (because it has been driven by record low interest rates and trillions of dollars worth of quantitative easing). In this type of environment, it is wise to think outside of the box and to consider all information available, but most economists are still stuck in the past as if we are in a garden-variety business cycle in the twentieth century.
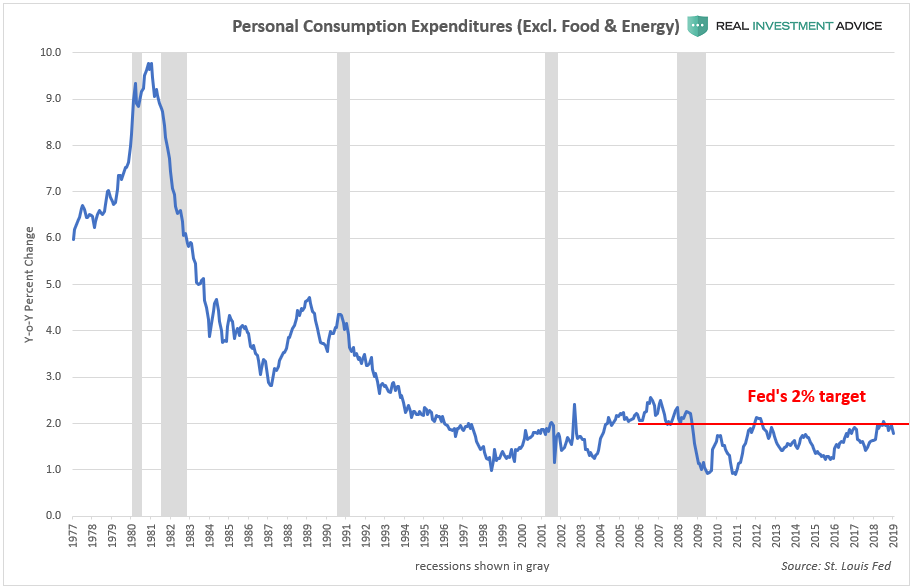
The Federal Reserve’s preferred inflation indicator is the core personal consumption expenditure price index (excluding volatile food and energy), which tracks the prices of U.S. consumer goods and services. The Fed has an official target of 2% annual inflation, but inflation has been running cooler than that since the Great Recession according to the core PCE index.
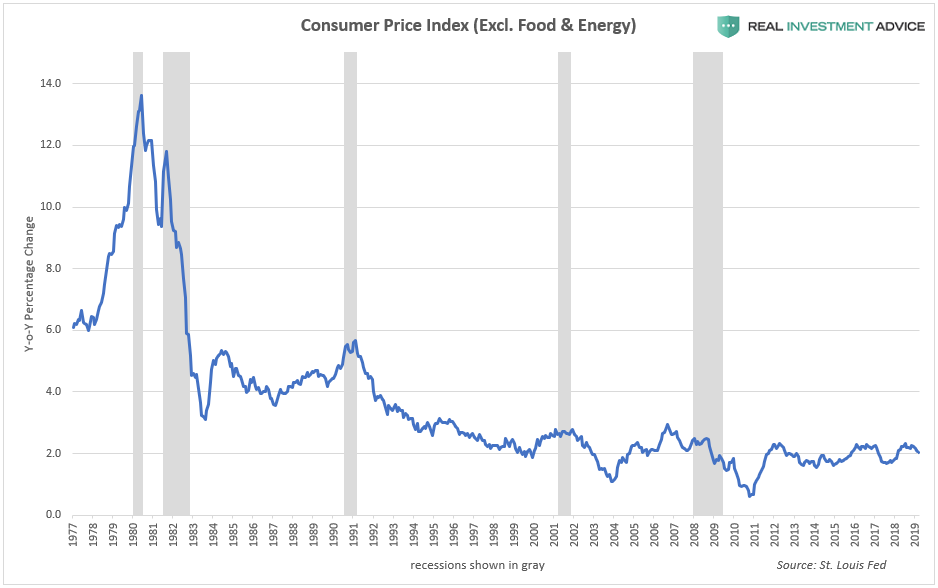
The inflation index most commonly referenced in the financial media is the core Consumer Price Index or CPI (excluding volatile food and energy). The core PCI tells a similar message as the core PCE index: consumer price inflation has been tepid since the Great Recession.
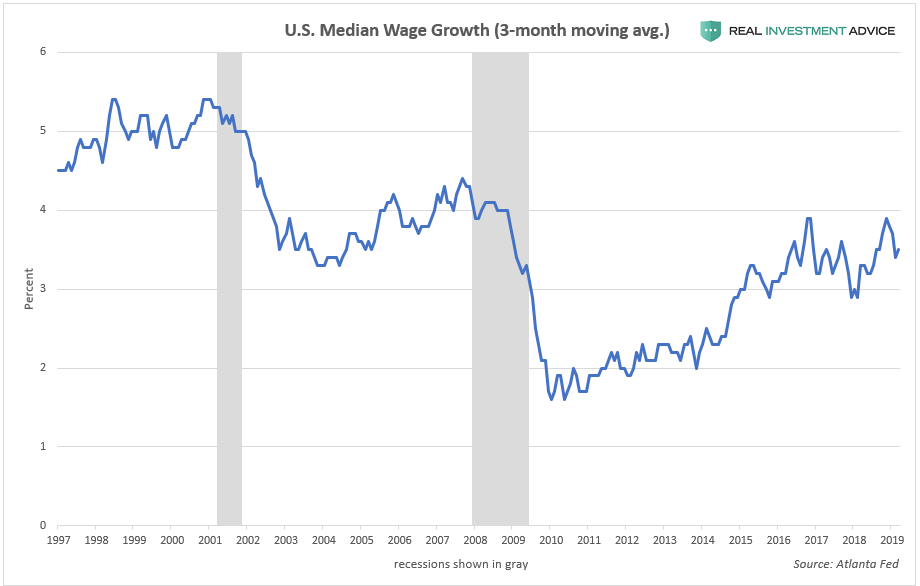
Wage growth has also been quite low since the Great Recession:
Overly rigid reliance on conventional inflation indicators has made the mainstream economics community completely blind to the elephant in the room, which is the fact that inflation has been concentrated in asset prices rather than consumer prices. As the chart below shows (which I’ve recreated from a chart made by Goldman Sachs a couple years ago), assets such as global stocks and bonds have risen at a much higher rate than global real economy prices since the current bull market began in March 2009.
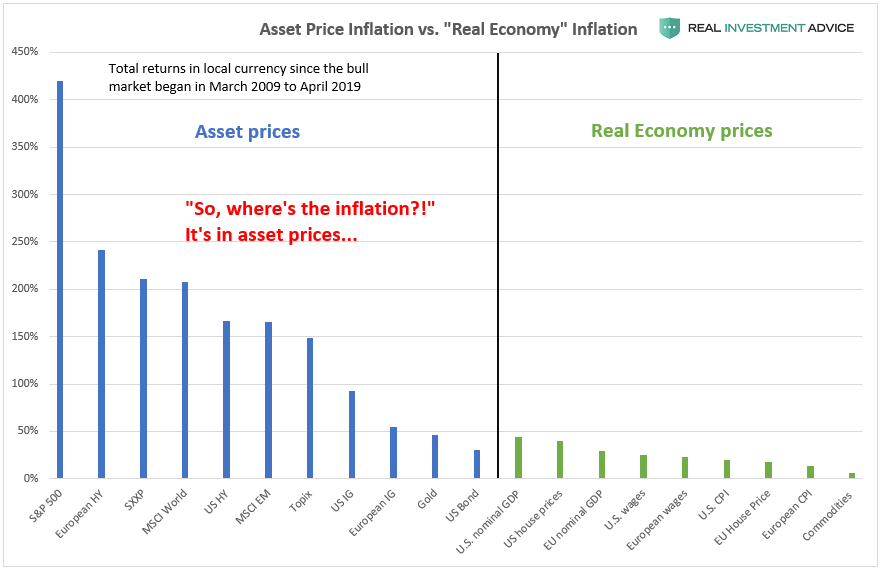
Consumer price inflation has remained low while asset price inflation has exploded because asset prices have been acting like a relief valve for inflationary pressures that have been created by record low global interest rates and the pumping of trillions of dollars worth of liquidity into the global financial system. This doesn’t mean that we don’t have an inflation problem; we have a tremendous inflation problem on our hands, but you need to know where to look.
This Wikipedia entry explains how relief valves work in the mechanical world –
A relief valve or pressure relief valve (PRV) is a type of safety valve used to control or limit the pressure in a system; pressure might otherwise build up and create a process upset, instrument or equipment failure, or fire. The pressure is relieved by allowing the pressurised fluid to flow from an auxiliary passage out of the system. The relief valve is designed or set to open at a predetermined set pressure to protect pressure vessels and other equipment from being subjected to pressures that exceed their design limits. When the set pressure is exceeded, the relief valve becomes the “path of least resistance” as the valve is forced open and a portion of the fluid is diverted through the auxiliary route. The diverted fluid (liquid, gas or liquid–gas mixture) is usually routed through a piping system known as a flare header or relief header to a central, elevated gas flare where it is usually burned and the resulting combustion gases are released to the atmosphere. As the fluid is diverted, the pressure inside the vessel will stop rising. Once it reaches the valve’s reseating pressure, the valve will close.

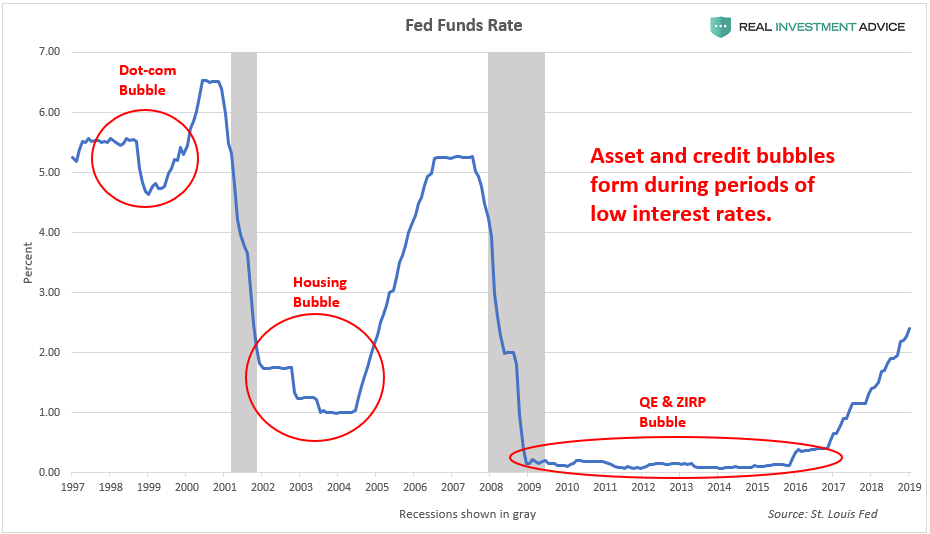
As discussed earlier, the U.S. is currently experiencing a massive asset bubble due to the Fed’s aggressive, unconventional monetary policies during and after the Great Recession. The first of these policies is known as zero interest rate policy or ZIRP. The Fed cut its benchmark interest rate (the Fed Funds rate) to virtually zero and held rates at record low levels for a record length of time. Asset and credit bubbles often form when central banks cut interest rates to artificially low levels because it becomes much cheaper to borrow, low rates discourage saving and encourage speculation in riskier assets & endeavors, and because they encourage higher rates of inflation, to name a few examples. The dot-com and U.S. housing bubbles formed during relatively low interest rate periods as well.
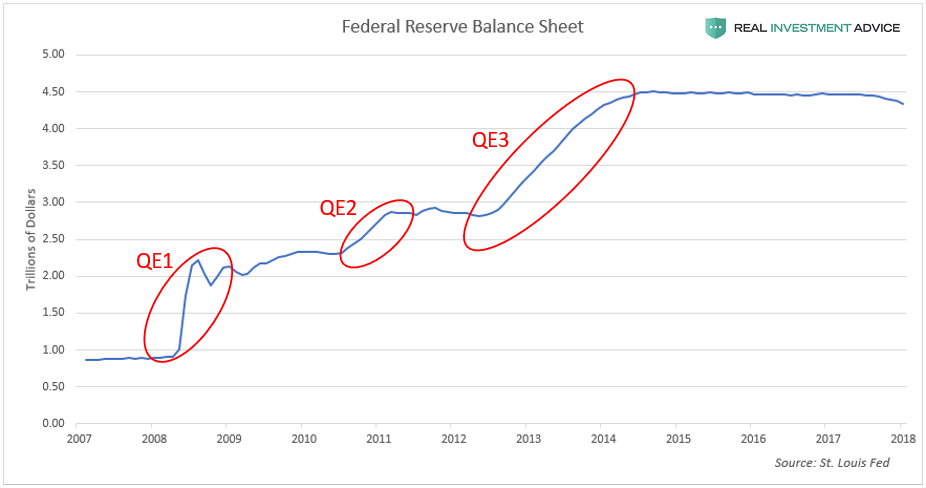
In addition to ZIRP, the Fed utilized an unconventional monetary policy known as quantitative easing or QE, which pumped $3.5 trillion dollars worth of liquidity into the U.S. financial system from 2008 to 2014. When conducting QE, the Fed creates new money digitally for the purpose of buying bonds and other assets, which helps to boost the financial markets. The chart below shows the growth of the Fed’s balance sheet since QE started in 2008:
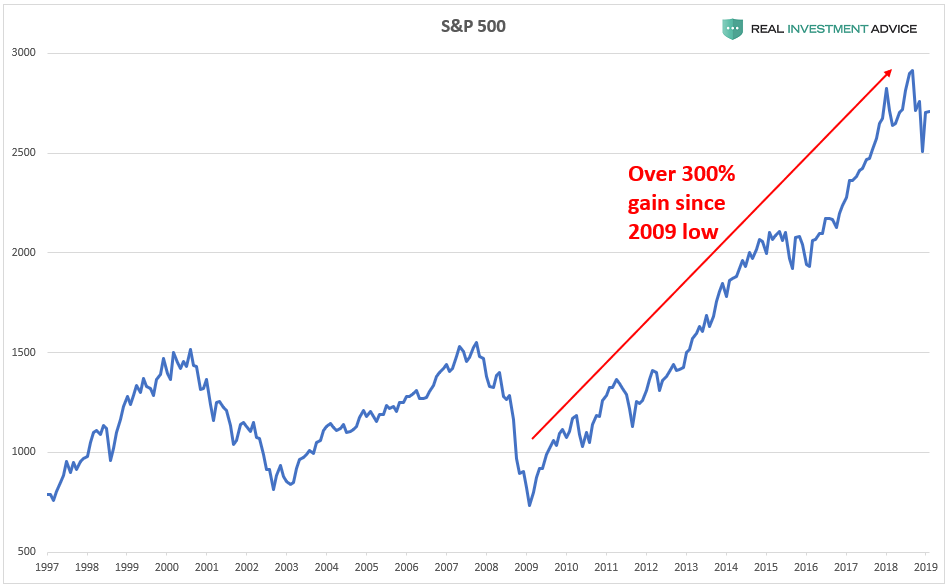
The Fed’s ZIRP and QE policies caused the S&P 500 to surge over 300% from its 2009 low:
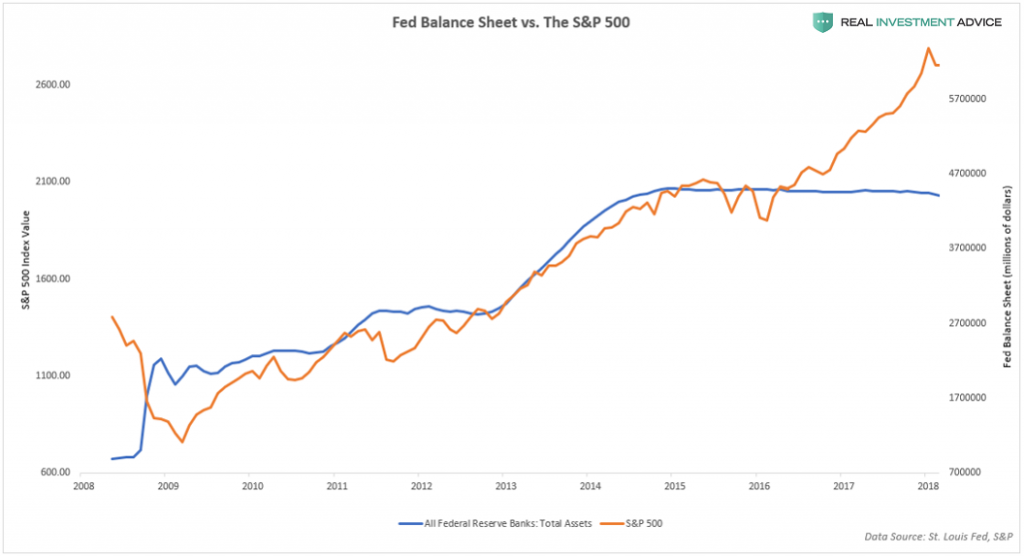
The chart below compares the Fed’s balance sheet to the S&P 500. Notice how each expansion of the Fed’s balance sheet led to a corresponding increase in the S&P 500.

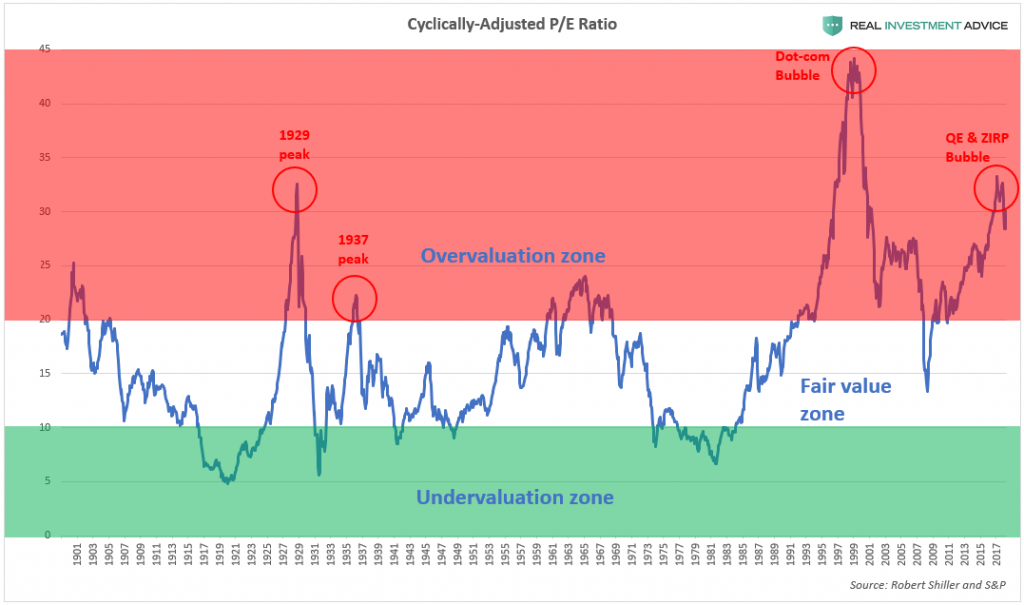
As a result of the Fed’s aggressive inflation of the stock market in the past decade, the S&P 500 rose much faster than earnings and is now at 1929-like valuations, which means that a painful correction is inevitable one way or another:
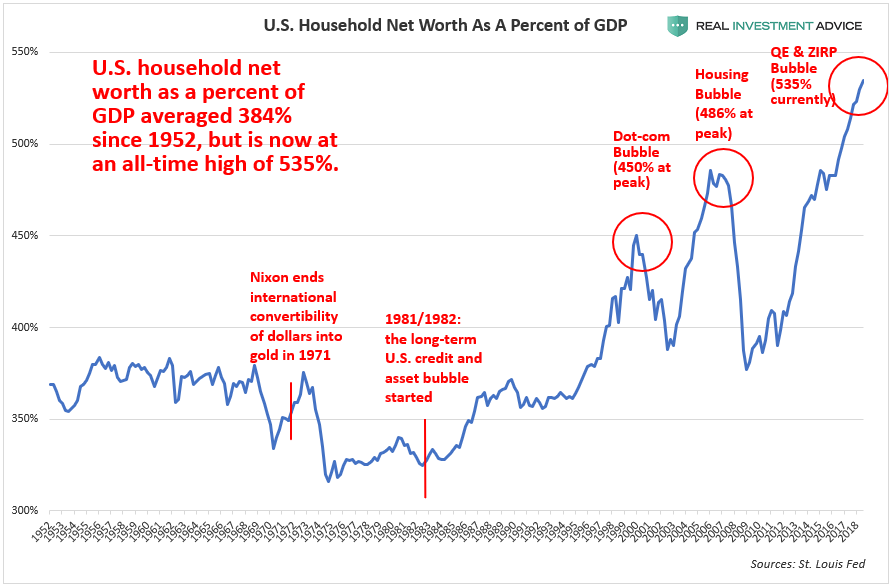
The Fed’s aggressive inflation of stocks and other assets has created a dangerous bubble in U.S. household wealth (see my presentation about this). U.S. household net worth has hit record levels relative to the GDP in recent years, which is a sign that household wealth is overly inflated and heading for an inevitable crash. The last two times household wealth became so stretched relative to the GDP were during the dot-com bubble and housing bubble, both of which ended in disaster. Terrifyingly, the current household wealth bubble blows the last two out of the water. There is a direct link between how large our current household wealth bubble is and how interest rates have been at record low levels for a record length of time. Unfortunately, the coming household wealth crash will be proportional to the run-up. (The Fed-driven household wealth bubble is also the main driver of growing U.S. wealth inequality, as I explained in Forbes recently.)
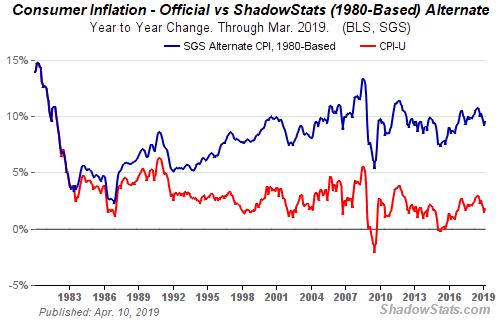
In addition to the fact that U.S. consumer price inflation has been low since the Great Recession because inflation has been concentrated in asset prices, there are many reasons to believe that consumer price inflation is actually running a lot hotter than mainstream economists think it is (or want you to think it is). According to John Williams, the proprietor of Shadow Government Statistics, the U.S. CPI formula has been changed over the years for the purpose of understating inflation.
For example, if we use the same CPI formula as we did in 1980 (blue line), it shows that inflation has been running at a nearly 10% annual rate for the past decade rather than the roughly 2% annual rate that today’s CPI (red line) indicates:
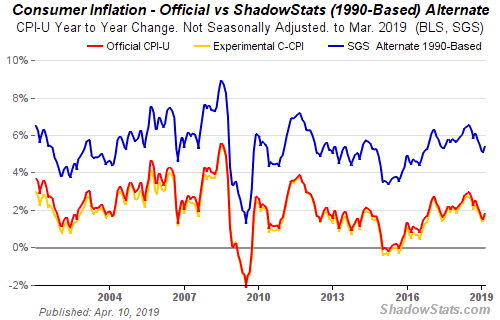
Similarly, the 1990 CPI formula (blue line) shows that inflation has been running at a roughly 5% annual rate rather than 2%:
One of the primary ways that our modern CPI formula understates inflation is through hedonic quality adjustments. In simple terms, consumer goods that experience technological improvements are considered to have fallen in price when calculating the CPI even if the price has stayed the same or even increased in real life. For example, if a computer with an eight-core processor costs $1,000 today and most computers have sixteen-core
processors but cost $1,300 in two years from now, it may get recorded as only costing $800 for the purpose of calculating the CPI. Of course, that’s no consolation to the consumer who actually has to pay $1,300.
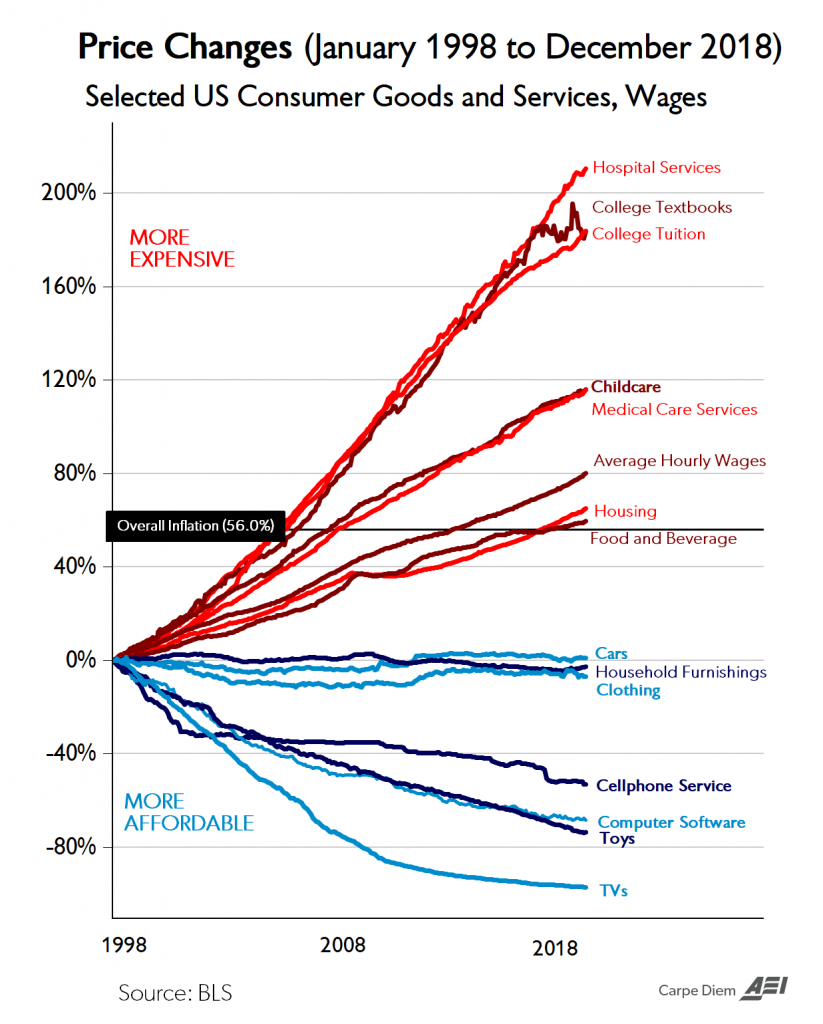
Because so many high-tech consumer products have entered our lives over the past forty years and those products have improved at a rapid rate, they have masked the very real inflation that has occurred in big ticket necessities like housing, healthcare, childcare, and higher education. Sure, it’s great that laptops, cell phones, and big screen TVs have been falling in price while gaining more features, but that doesn’t help Americans who are going bankrupt due to exorbitant medical bills, being crushed under the weight of student loans, and can’t find affordable housing anywhere.
The chart below from the American Enterprise Institute shows the dichotomy between high-tech consumer products, which have been falling in price, and big ticket necessities that have surged in price and are becoming increasingly out of reach for many Americans:
To summarize, America has a very real inflation problem, but it’s not where everyone is looking. The pervasive, but wrong belief that interest rates should remain at ultra-low levels will only serve to further inflate the asset bubbles that the mainstream economics world is ignoring or in denial of. Unfortunately, these bubbles are eventually going to burst and will cause an economic depression. We should not expect a different outcome when the same characters who completely missed the housing bubble’s obvious warning signs are still employed at the Fed, the big banks, investment firms, academia, and financial media.


Lance Roberts is a Chief Portfolio Strategist/Economist for RIA Advisors. He is also the host of “The Lance Roberts Podcast” and Chief Editor of the “Real Investment Advice” website and author of “Real Investment Daily” blog and “Real Investment Report“. Follow Lance on Facebook, Twitter, Linked-In and YouTube
Customer Relationship Summary (Form CRS)
Also Read


