


The question I get most often is “when is the next bear market?” There are three specific items that tend to predict bear markets and recessions with some accuracy.
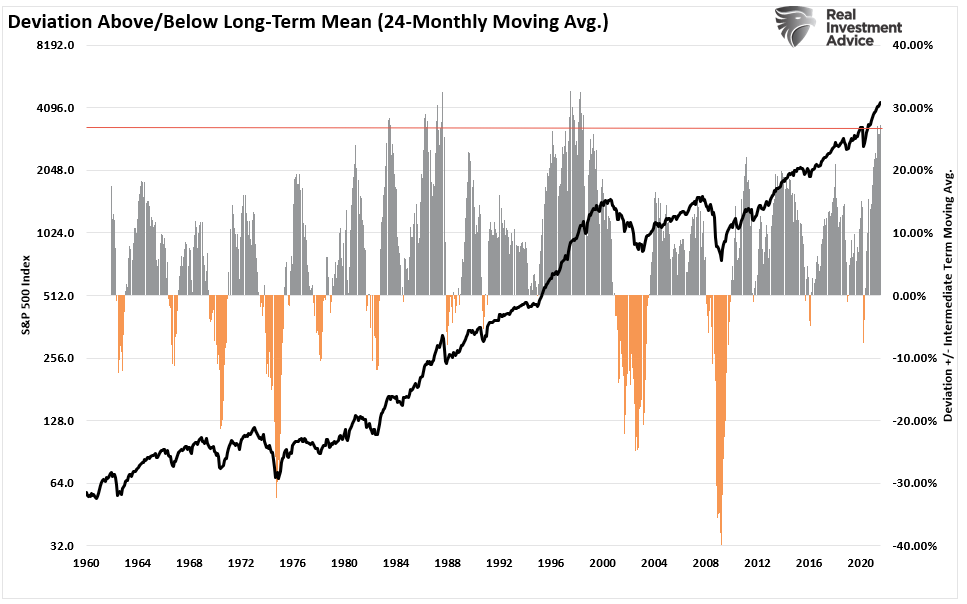
However, before we get to those points, a “bear market” requires excesses that need reversion. In other words, a mean-reverting event needs “fuel.” There are several measures that suggest excesses are sufficient to fuel a meaningful reversion.
Deviation From Long-Term Means
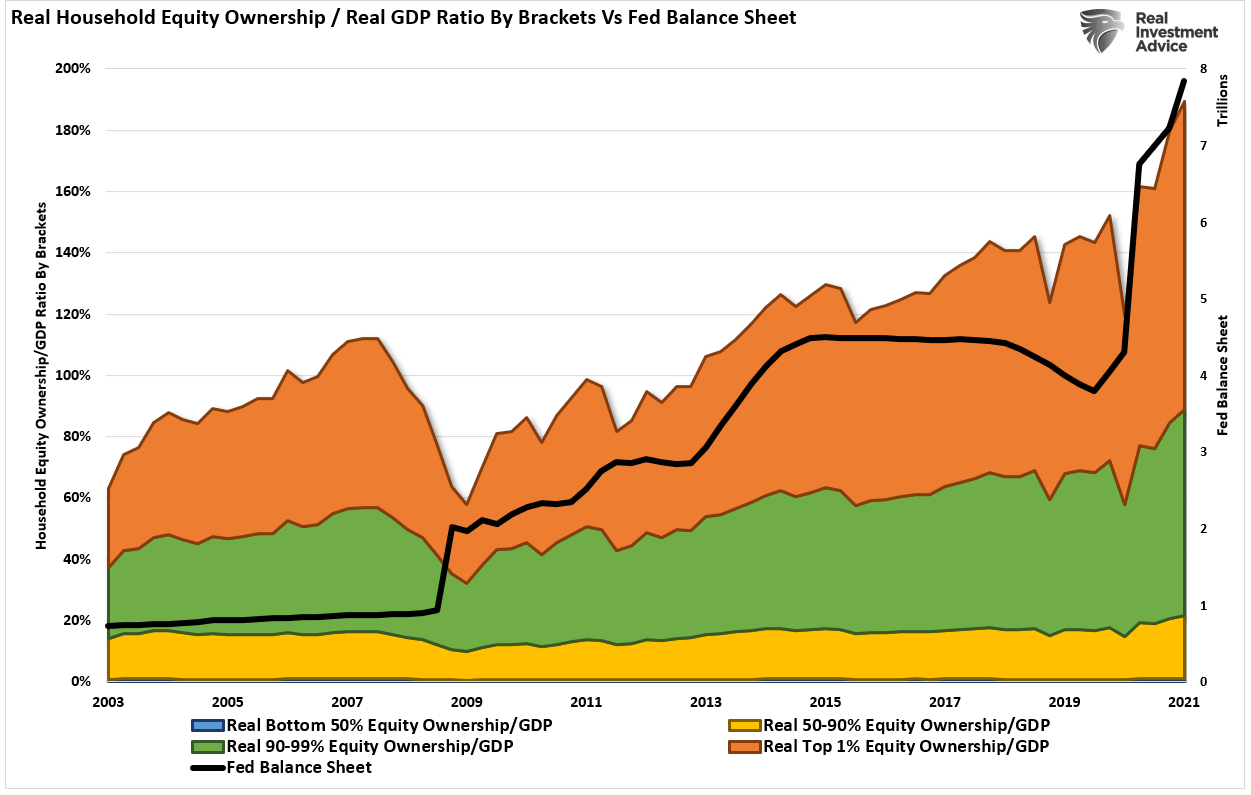
Household Equity Ownership
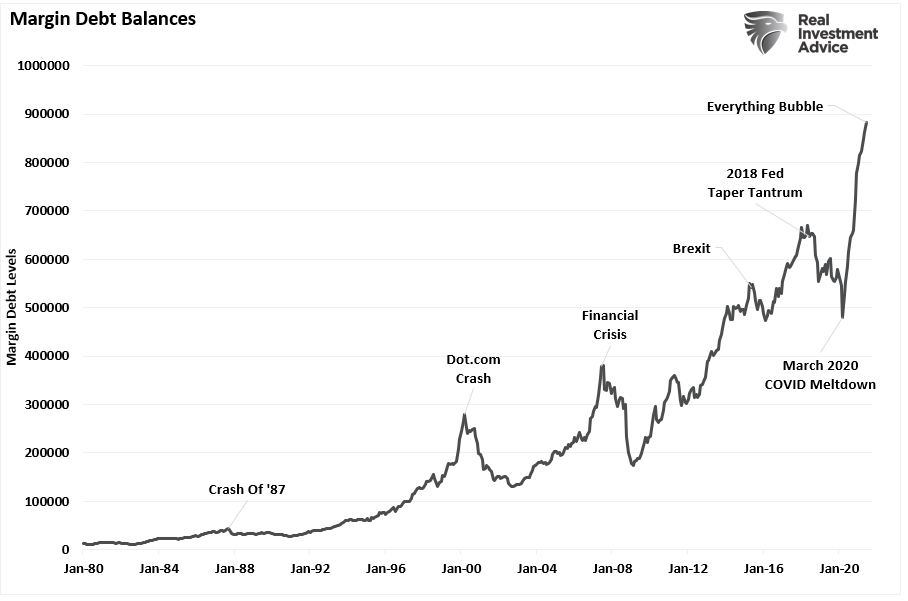
Margin Debt
Importantly, none of these measures mean a “bear market” is imminent. A catalyst is needed to cause a change in sentiment from “greed” to “fear.” As noted, there are three indicators that historically note when the “clock starts ticking” to the next bear market.

Yield Curve
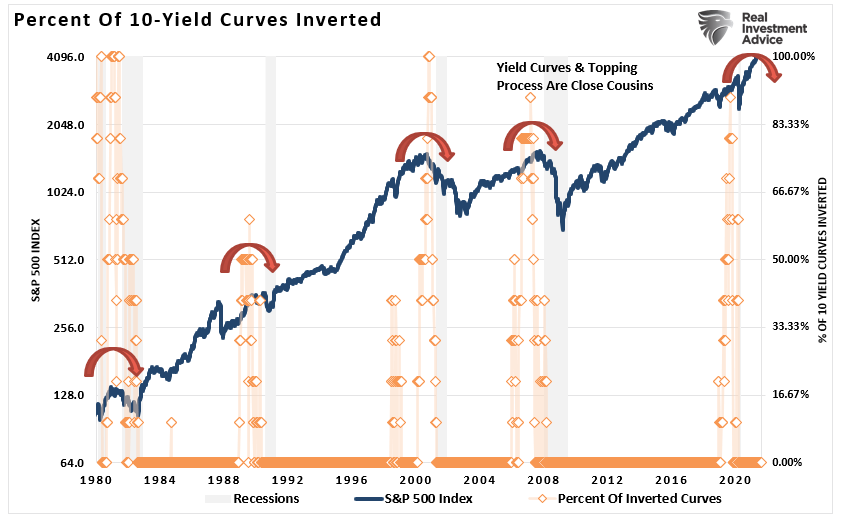
The yield curve is one of the most important indicators for determining when a recession, and a subsequent bear market, approaches. The chart below shows the percentage of yield curves that invert out of 10-possible combinations.
Investors should never dismiss the message sent by the bond market. Bonds are essential for their predictive qualities, which is why analysts pay an enormous amount of attention to U.S. government bonds, specifically to the difference in their interest rates. Why is this?
Unlike stocks, there is a finite value to bonds. At maturity, the lender receives the principal along with the final interest payment. Therefore, bond buyers are aware of the price they pay today for their return tomorrow. Unlike an equity buyer taking on “investment risk,” a bond buyer is “loaning” money to another entity for a specific period. Therefore, the “interest rate” takes into account several “risks:”
- Default risk
- Rate risk
- Inflation risk
- Opportunity risk
- Economic growth risk
Since the future return of any bond, on the date of purchase, is calculable to the 1/100th of a cent, a bond buyer will not pay a price that yields a negative return in the future. (This assumes a holding period until maturity. One might purchase a negative yield on a trading basis if expectations are benchmark rates will decline further.)
Therefore, since bonds are loans to borrowers, the interest rate of a bond is tied to the prevailing rate environment at the time of issuance.
There is a high historical correlation to the economy and prices over the longer term. Oil prices, trade tensions, political uncertainty, the dollar, credit risk, earnings, etc., all get reflected in the interest rate for different durations of loans.
Which Yield Curve Matters
Which yield curve matters mostly depends on whom you ask.
DoubleLine Capital’s Jeffrey Gundlach watches the 2-year vs. 5-year spreads. Michael Darda, the chief economist at MKM Partners, says it’s the 10-year and the 1-year spread. Others say the 3-month and 10-year yields matter most. The most-watched is the 10-year versus the 2-year spread.
So which is it? As discussed in “Which Yield Curve Matters:”
“While the 3-5 yield spread is currently in negative territory, it has not been confirmed by other yield spreads across the spectrum. As shown in the chart below, the best signals of a recessionary onset have occurred when a bulk of the yield spreads have gone negative simultaneously. However, even then, it was several months before the economy actually slipped into recession.”
Following the “Dot.com” crash, the entire tragic event was considered an anomaly, a once-in-a-100-year event that would not replicate again. Unfortunately, just 4-years later, in 2006, investors again were told to ignore the yield curve inversion as it was a “Goldilocks economy” and “sub-prime mortgages were contained.”
Advice to ignore yield curve inversions has not worked out well for investors.
The quad-panel chart below shows the 4-previous periods where 50% of 10-different yield curves became inverted. I have drawn a horizontal red dashed line where 50% of the 10-yield curves we track are inverted. I have also denoted the optimal point to reduce risk relative to the subsequent low.
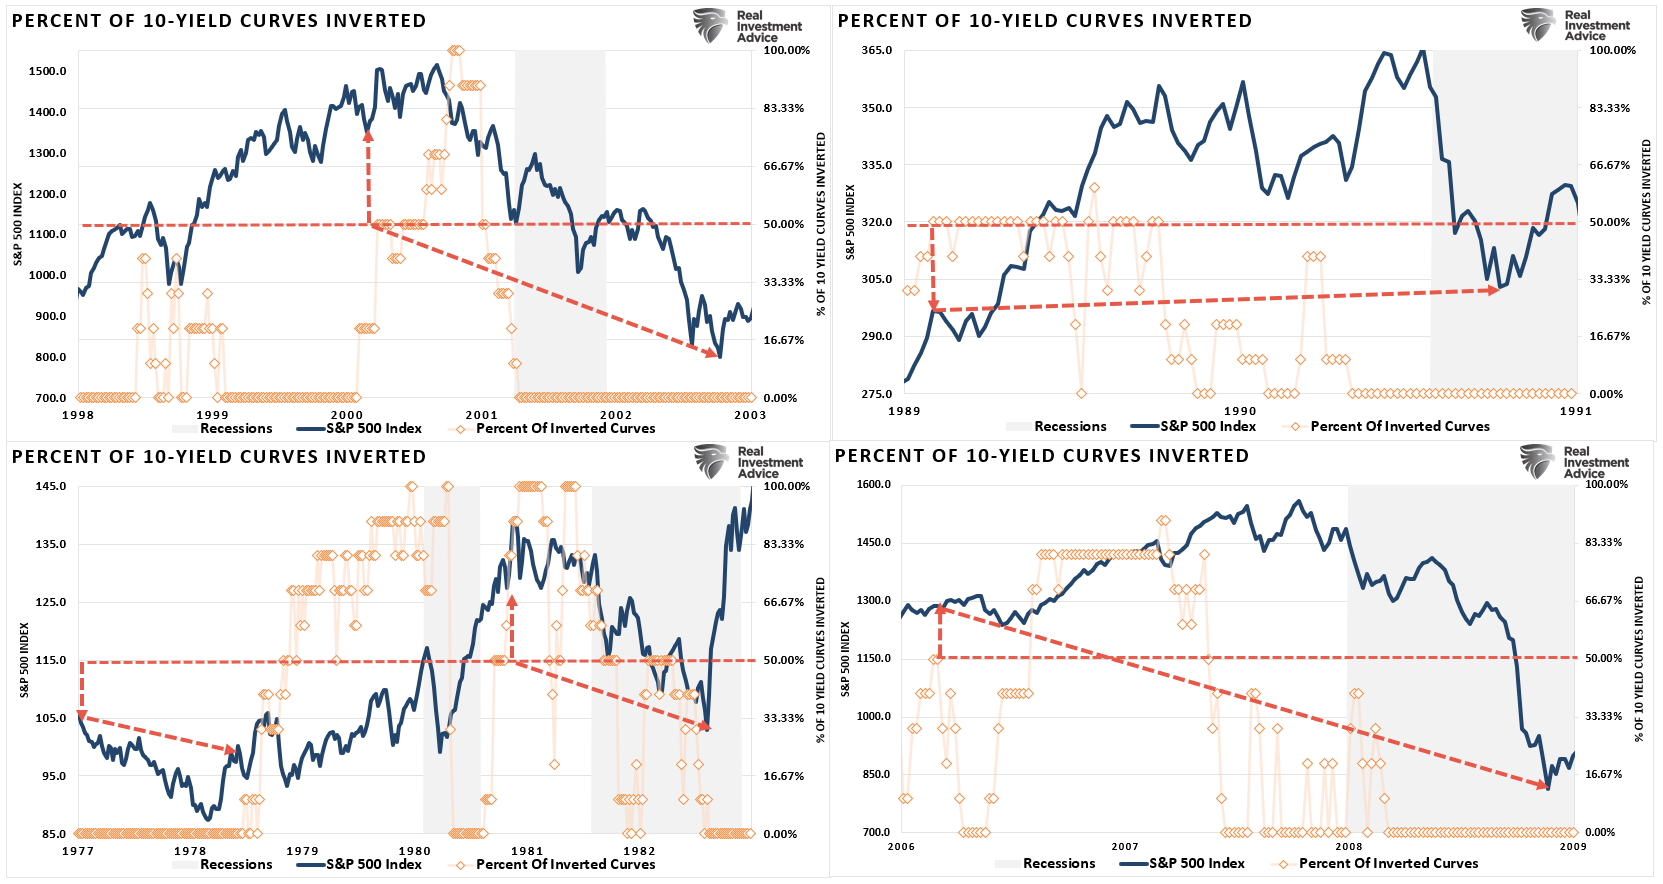
In every case, the market did rally a bit after the initial reversion before the eventual reversion.
No Inversion Yet
The chart below is the percentage of the 10-yield spreads that are currently inverted. At the moment, that number is at zero suggesting there is no risk of a recession or “bear market.“. However, as you will note, when inversions do begin to occur, they tend to occur quickly.
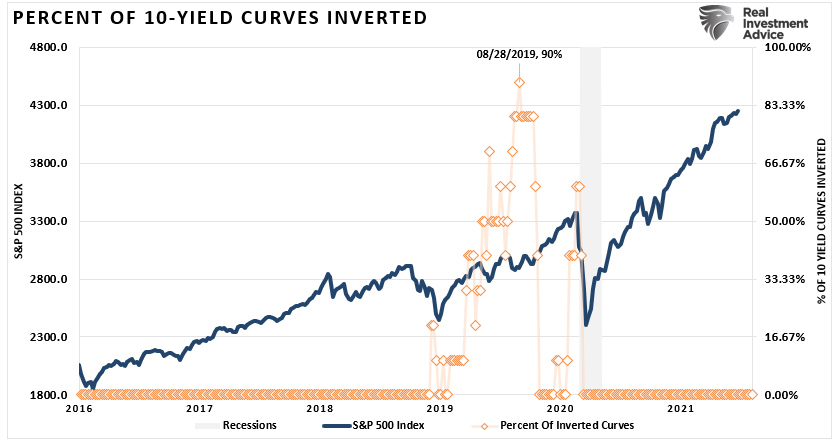
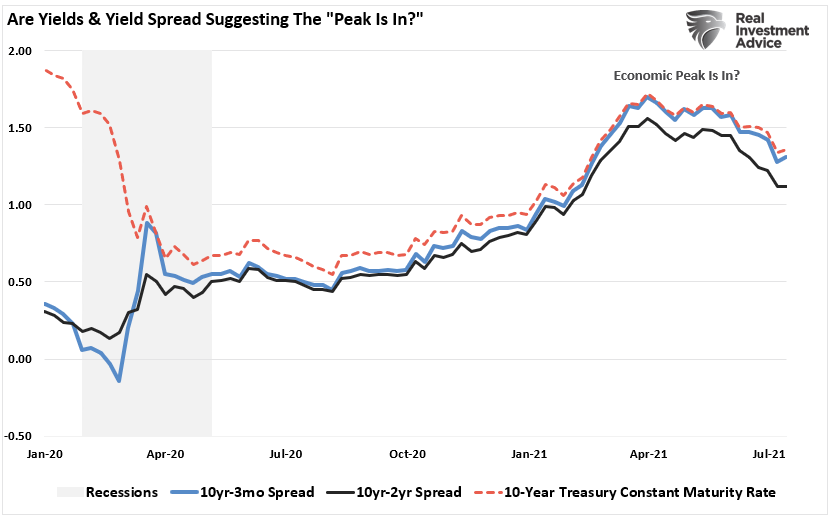
Historically speaking, from the time yield curves begin to invert, the span to the next recession runs roughly 9-months. However, note that yield curves are currently declining, suggesting economic growth will weaken. If this trend continues, another “inversion” would not be a surprise.
Given the strong track record of predicting recessions historically, when the next inversion occurs the media will be quick to dismiss it just as they did in 2019.
They will likely be wrong again.

Fed Taper
Just recently, the Federal Reserve started to “think about thinking about tapering” its bond purchases. However, the issue of “tapering” is not as much about the Fed’s actual reduction of bond purchases as it is about psychology.
“The key to navigating Quantitative Easing! and Fed policy in general is to recognize that their effect on the stock market relies almost entirely on speculative investor psychology. See, as long as investors get inclined to speculate, they treat zero-interest money as an inferior asset, and they will chase any asset with a yield above zero (or a past record of positive returns). Valuation doesn’t matter because investors psychologically rule out the possibility of price declines in the first place.” – John Hussman
In other words, “QE” is a mental formation. The only thing that alters the effectiveness of the Fed’s monetary policy is investor psychology itself.
Such was a point we made in the “Stability/Instability Paradox.”
“With the entirety of the financial ecosystem now more heavily levered than ever, due to the Fed’s profligate measures of suppressing interest rates and flooding the system with excessive levels of liquidity, the ‘instability of stability’ is now the most significant risk.”
There is a correlation between expanding the Fed’s balance sheet and the S&P 500 index. Whether the correlation is due to liquidity moving into assets through leverage or just the “psychology” of the “Fed Put,” the result is the same.
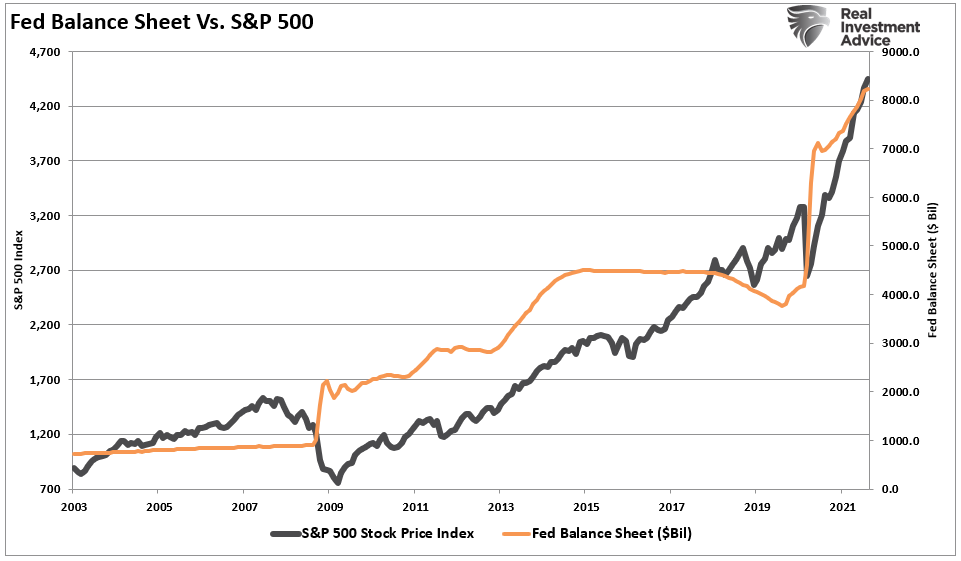
Therefore, it should also not be surprising that when the Fed starts “tapering” their bond purchases, the market tends to witness increased volatility. The grey shaded bars in the chart below show when the balance sheet is either flat or contracting.
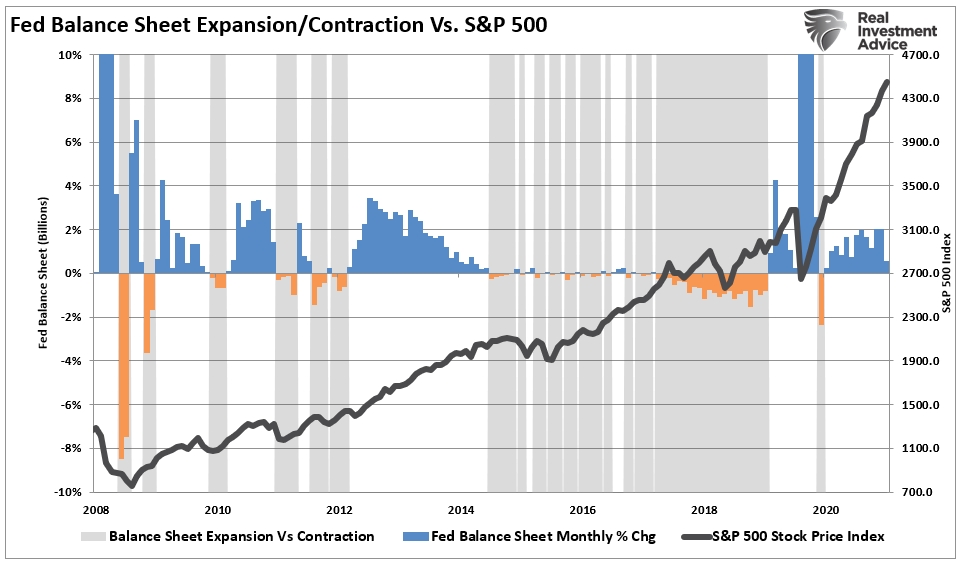
Notably, the time from the initial tapering of assets and a market correction is almost immediate.
However, taper leads to rate hikes.

Fed Rate Hikes
The risk of a market correction rises further when the Fed is both tapering its balance sheet and increasing the overnight lending rate.
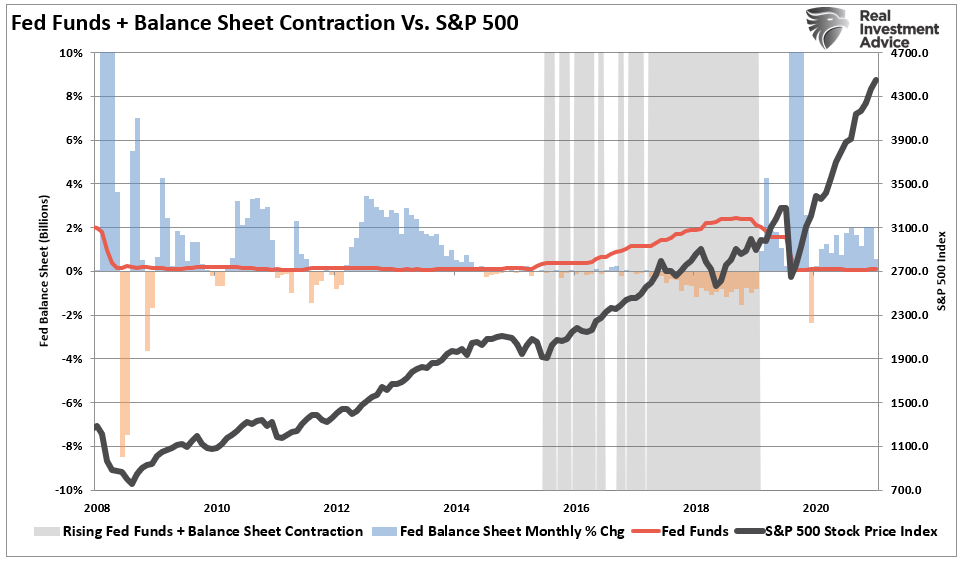
What we now know, after more than a decade of experience, is that when the Fed starts to slow or drain its monetary liquidity, the clock starts ticking to the next corrective cycle.
As discussed previously, the Fed should be using the $120 billion in monthly QE to start hiking rates to prepare for the next recession slowly. But, instead, they continue to kick the “policy can” further down the road. The longer they wait, the harder it will be to pull off normalization without risking significant market volatility and reversing the economic recovery.
Of course, history already shows such is what will happen. Once the Fed begins to hike interest rates, corrections in markets occur quickly generally within 2-4 quarters. However, recessions and bear markets generally take a while longer and have been extended due to ongoing interventions. The current median time frame between the first rate hike and the onset of a recession is 11-quarters. (The shaded green bars denote rate hike campaigns.)
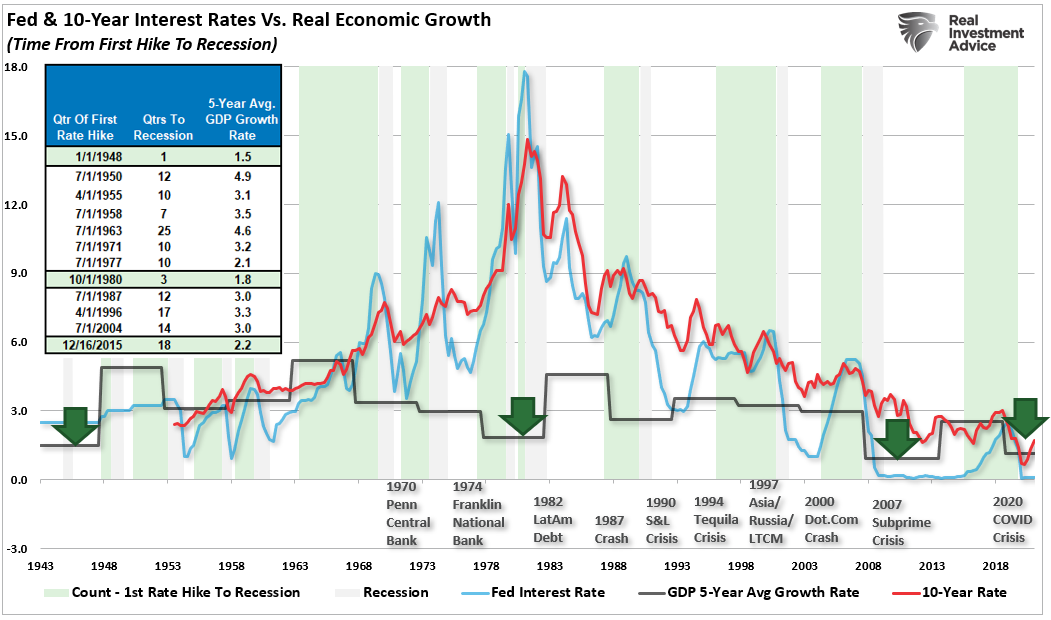
Notably, there are ZERO times in history where the Fed hikes rates that did not end negatively.

Conclusion
There is currently no indication of a recession. Nevertheless, the Fed continues to purchase $120 billion a month in bonds keeping the “psychological Fed put” in place.
The Fed is also keeping the overnight lending rate at zero, and the yield curve is nowhere close to inverting just yet.
However, these items will change quickly, and when they do, the clock will start ticking towards the next recession and bear market.
As noted in Slowly At First:
“Understanding that change is occurring is what is essential. But, unfortunately, the reason investors ‘get trapped’ in bear markets is that when they realize what is happening, it is far too late to do anything about it.
Bull markets lure investors into believing ‘this time is different.’ When the topping process begins, that slow, arduous affair gets met with continued reasons why the ‘bull market will continue.’ The problem comes when it eventually doesn’t. As noted, ‘bear markets” are swift and brutal attacks on investor capital.’”
Pay attention to these indicators. The Fed is discussing taper. The yield curve is flattening, and there is a risk the Fed will hike rates next year. These are all actions very reminiscent of previous market topping processes.
However, tops are hard to identify during the process as “change happens slowly.”


Lance Roberts is a Chief Portfolio Strategist/Economist for RIA Advisors. He is also the host of “The Lance Roberts Podcast” and Chief Editor of the “Real Investment Advice” website and author of “Real Investment Daily” blog and “Real Investment Report“. Follow Lance on Facebook, Twitter, Linked-In and YouTube
Customer Relationship Summary (Form CRS)
Also Read


