


We are happy to share the Weekly Gamma Bands Update by Viking Analytics. The report uses options gamma to help you better manage risk and your equity allocations.
Gamma Band Update 09/21/20
- From an options market analysis perspective, the SPX continues to sit at an important inflection point. Some of our indicators have turned cautious, while at least one indicator remains bullish.
- Friday, September 18th was the important “quad witching” quarterly expiration, and the market was treated to a week of volatility.
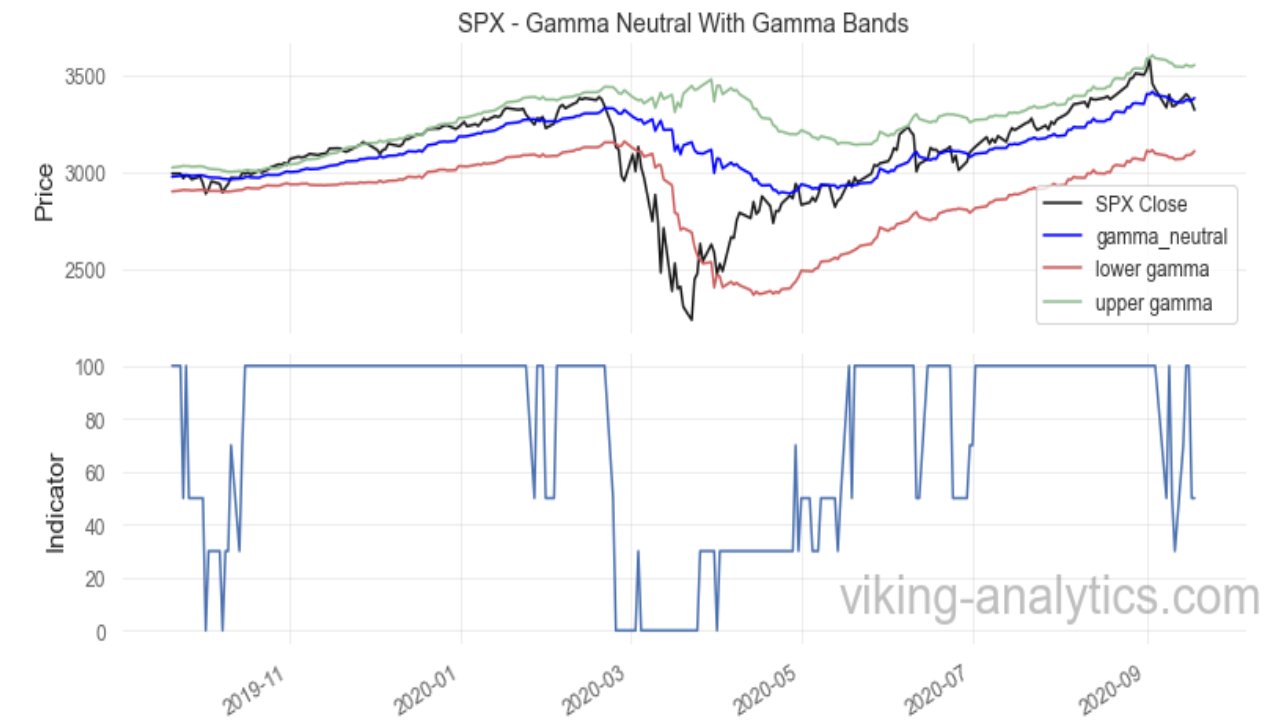
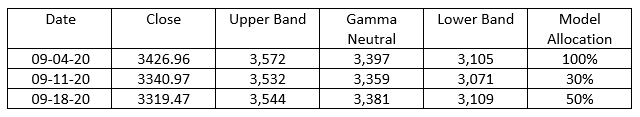
- The S&P 500 (SPX) has traded and closed in and around the Gamma Neutral level all week, and closed below to end the week. The Gamma Neutral level has shifted slightly higher.
- Since the SPX has higher volatility below Gamma Neutral, our indicator has reduced SPX exposure to 50% out of 100%.
- If the SPX closes on a daily basis below the lower band (currently near 3,110), our indicator will cut SPX exposure to 0%.
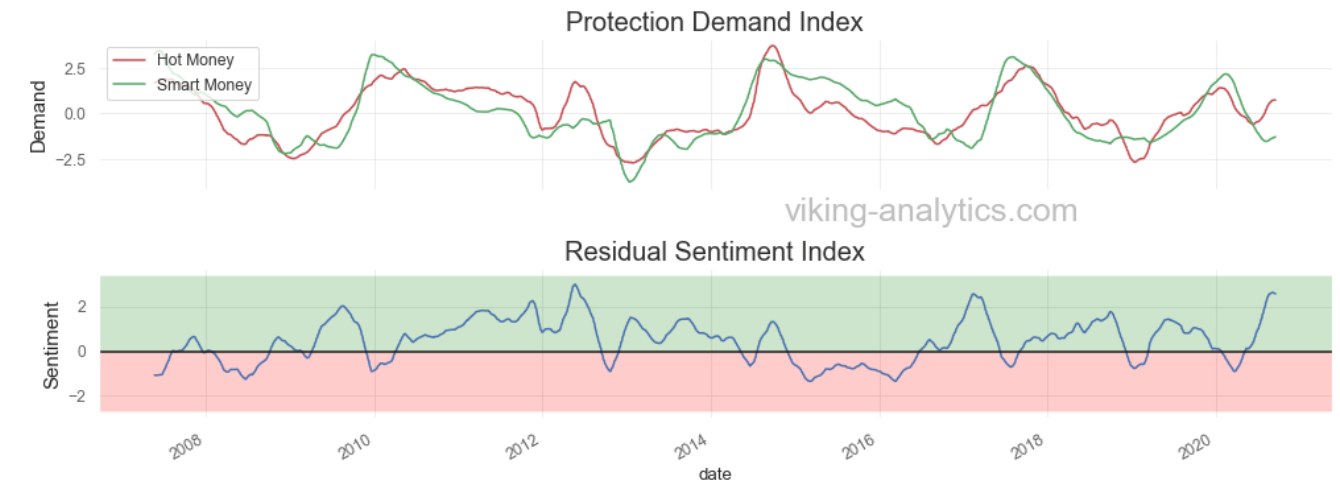
- Our options Smart Money Indicator remains bullish, however, and we discuss this in greater detail below.
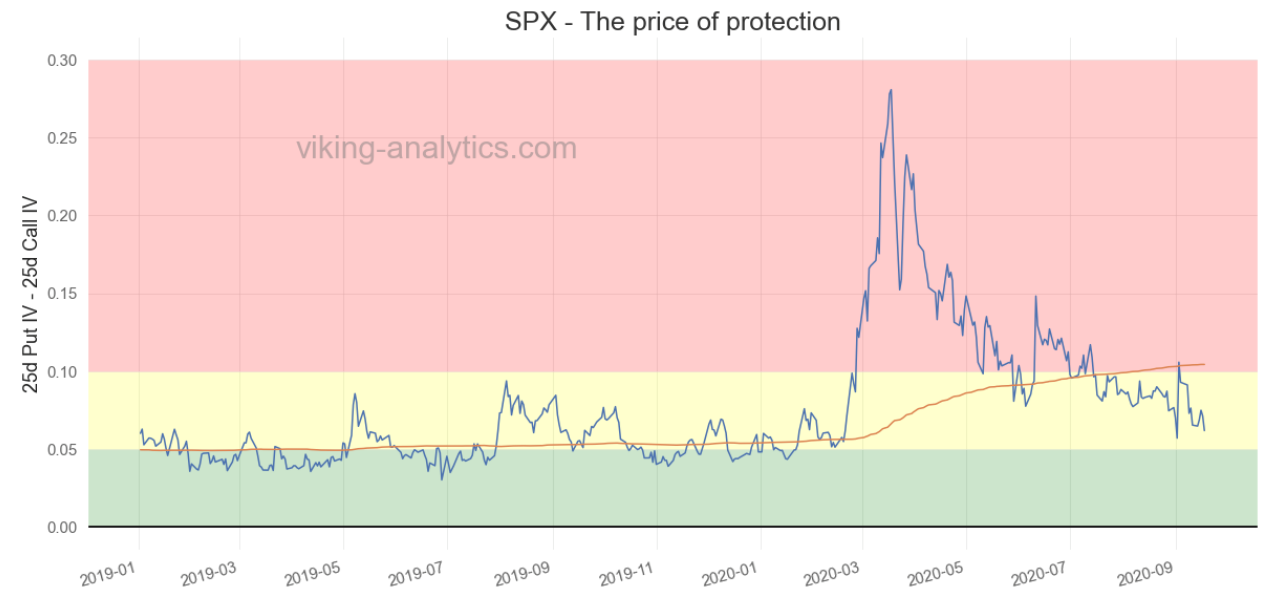
- SPX skew, which measures the relative cost of puts to calls, is in our view neutral at the moment.
Smart Money Residual Index
This indicator compares “smart money” options buying versus “hot money” options buying. Generally, smart money will purchase options to ensure stable returns over a longer-term. Smart money has in-depth knowledge and data in support of their options activity. In contrast, “Hot money” acts based on speculation, seeking a large payoff.
At the moment, hot money is more cautious than smart money, and the back-test supports a long position during this time. When the Residual Sentiment Index in the second graph turns to red, then this model will cut all equity exposure to zero. When the market is in the red regime below, the market has an overall negative return.
SPX Skew – the Price of Protection
We also consider the cost of buying puts versus the cost of buying calls. When puts have a big premium to calls, then the market is seen to have extreme fear (in the red zone below). During the September sell-off through Friday, the premium for buying puts has declined. This is surprising considering the news narratives seem to indicate heightened market anxiety. We consider skew to be neither bullish nor bearish at the moment.
Gamma Band Background
Market participants are increasingly aware of how the options markets can affect the equity markets in a way that can be viewed as the “tail wagging the dog.”
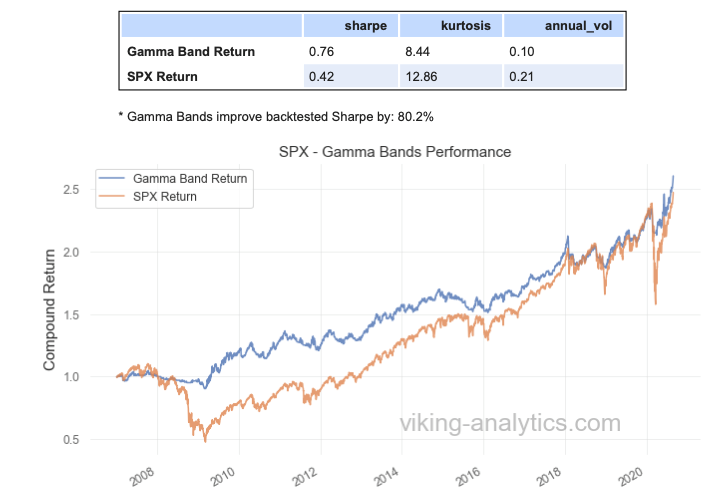
We created a simple Gamma Band indicator to demonstrate the effectiveness of the Gamma Neutral level in reducing equity tail risk. In our model, we compare the daily close of the SPX to the Gamma Neutral and Lower band levels to adjust our equity exposure allocation from 0% to 100%. This is a “slow” but reliable signal if one’s goal is to increase risk-adjusted returns. We also publish faster, daily signals in a portfolio model which we call Thor’s Shield. Free samples of our daily SPX report and Thor’s Shield model can be downloaded from our website.
We back-tested this strategy from 2007 to the present and realized an 80% increase in risk-adjusted returns (measured by the Sharpe ratio). The annual volatility of this approach, versus a long-only position, falls from 21% to 10%.
Authors
Viking Analytics is a quantitative research firm that creates tools to navigate complex markets. If you would like to learn more, please visit our website, or download a complimentary report.
Erik Lytikainen, the founder of Viking Analytics, has over twenty-five years of experience as a financial analyst, entrepreneur, business developer, and commodity trader. Erik holds an MBA from the University of Maryland and a B.S. in Mechanical Engineering from Virginia Tech.
Rob McBride has 15+ years of experience in the systematic investment space and is a former Managing Director at a multi-billion dollar hedge fund. Furthermore, he has deep experience with market data, software, and model building in financial markets. Rob has a M.S. in Computer Science from the South Dakota School of Mines and Technology.

Erik Lytikainen, the founder of Viking Analytics, has over twenty five years of experience as a financial analyst, entrepreneur business developer and commodity trader. Erik holds an MBA from the University of Maryland and a BS in Mechanical Engineering from Virginia Tech. You can learn more about his work on his website: www.viking-analytics.com.
Also Read


