


We share the Weekly Gamma Bands Update by Viking Analytics. The report uses options gamma to help you better manage risk and your equity allocations.
Gamma Band Update
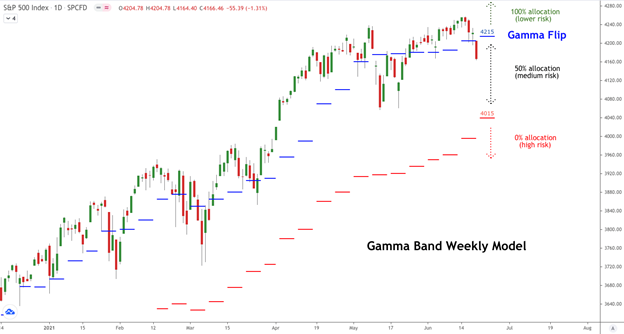
After hitting an all-time closing high on Monday, the S&P 500 (SPX) sold off over the next four days to close the week below our Gamma Flip level. The important mid-year option expiration on Friday, combined with the FOMC meeting added to the volatility this past week. Even though the market declined this past week, the Gamma Flip levels moved higher for at least two reasons: 1) the June options rolled off the board, and 2) increased implied volatility tends to raise the Gamma Flip level due to the relatively high put-call ratios.
The Gamma Band model[1] has entered this week with a 50% allocation to SPX. When the daily price closes below “Gamma Flip” (currently near 4,215), the model will reduce exposure in order to avoid price volatility and sell-off risk. If the market closes on a daily basis below the lower gamma level (currently near 4,015), the model will reduce the SPX allocation to zero.
Investors who keep an eye on various gamma-related levels are more aware when market volatility is expected to increase. One application of Gamma Bands is to maintain high allocations to stocks when risk is expected to be lower. For investors who have been conditioned to “buy low and sell high,” it is counter-intuitive to increase allocations when the market rises, but this approach has shown to increase risk-adjusted returns in the back-test.
The Gamma Band model is one of several indicators that we publish daily in our SPX Report. With stocks continuing to extend historically high valuations, risk management tools are more important than ever to manage the next drawdown, whenever it may come.
A sample of the SPX report can be downloaded. Please visit our website to learn more about our daily reports and quantitative algorithms.
The Gamma Flip – Background
Many market analysts have noted that daily volatility in the S&P 500 will change when the value of the SPX moves from one gamma regime to another. Some analysts call this level the “gamma flip.” The scatterplot below shows how price volatility (on the y-axis) is increasingly lower as the value of SPX rises higher above the Gamma Neutral level (on the right side of the chart). When the value of the S&P closes lower than Gamma Neutral (to the left of the chart), volatility increases.

Gamma Band Model – Background
The purpose of the Gamma Band model is to show how tail risk can be reduced by following a few simple rules. The daily Gamma Band model has improved risk-adjusted returns by over 60% since 2007. The graph below demonstrates how this approach can limit drawdowns while maintaining good returns. A quick video introduction of the Gamma Band model can be seen by following this link.

Disclaimer
This is for informational purposes only and is not trading advice. The information contained in this article is subject to our full disclaimer on our website.
[1] The Gamma Band model in our SPX Market Report adjusts position size DAILY based upon the daily closing levels of SPX value and calculated Gamma Neutral. The Weekly Gamma Band model is shown for illustrative purposes only.
Authors
Erik Lytikainen, the founder of Viking Analytics, has over twenty-five years of experience as a financial analyst, entrepreneur, business developer, and commodity trader. Erik holds an MBA from the University of Maryland and a BS in Mechanical Engineering from Virginia Tech.
Rob McBride has 15+ years of experience in the systematic investment space and is a former Managing Director at a multi-billion dollar hedge fund. Rob has deep experience with market data, software and model building in financial markets. Rob has a M.S. in Computer Science from the South Dakota School of Mines and Technology.

Erik Lytikainen, the founder of Viking Analytics, has over twenty five years of experience as a financial analyst, entrepreneur business developer and commodity trader. Erik holds an MBA from the University of Maryland and a BS in Mechanical Engineering from Virginia Tech. You can learn more about his work on his website: www.viking-analytics.com.
Also Read


