


We share the Weekly Gamma Bands Update by Viking Analytics. The report uses options gamma to help you better manage risk and your equity allocations.
Gamma Band Update
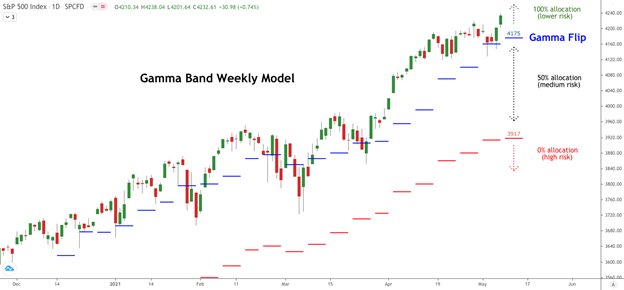
The S&P 500 (SPX) passed an important technical test this past week right near our Gamma Flip levels and launched to new highs. We agree with many others that options and VIX order flow have become one of the primary “fundamentals” of the market, and this past week is an example of why this perspective matters. As long as SPX closes above its gamma neutral level, stocks remain in a bullish mode.
Our Gamma Band model[1] maintained a 100% allocation to the S&P 500 (SPX) last week, and the Gamma Flip level moved higher to 4,175. When the daily price closes below “Gamma Flip,” the model will reduce exposure in order to avoid price volatility. If the market closes on a daily basis below the lower gamma level (currently near 3,917), the model will reduce the SPX allocation to zero.
Investors who keep an eye on various gamma-related levels are more aware of when market volatility is expected to increase. One application of Gamma Bands is to maintain high allocations to stocks when risk is expected to be lower. For investors who have been conditioned to “buy low and sell high,” it is counter-intuitive to increase allocations when the market rises, but this approach has shown to increase risk-adjusted returns in the back-test.
Perhaps Bubble-ishious?
Gamma Bands is one of several indicators that we publish daily in our SPX Report. Overall, we continue to rate our indicators as “cautiously bullish” or perhaps bubble-ishious. Perhaps we are in the middle of a final melt-up in a multi-year bull market. With stocks continuing to extend historically high valuations, risk management tools are more important than ever to manage the next drawdown, whenever it comes.
A sample of the SPX report can be downloaded from this link. Please visit our website to learn more about our daily reports and quantitative algorithms.
The Gamma Flip – Background
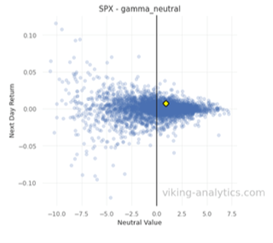
Many market analysts have noted that daily volatility in the S&P 500 will change when the value of the SPX moves from one gamma regime to another. Some analysts call this level the “gamma flip.” The scatterplot below shows how price volatility (on the y-axis) is increasingly lower as the value of SPX rises higher above the Gamma Neutral level (on the right side of the chart). When the value of the S&P closes lower than Gamma Neutral (to the left of the chart), volatility increases.
Gamma Band Model – Background
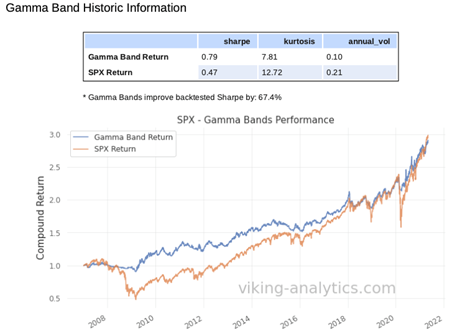
The purpose of the Gamma Band model is to reduce tail risk. The daily Gamma Band model has improved risk-adjusted returns by over 60% since 2007. The graph below demonstrates how this approach can limit drawdowns while maintaining good returns. A quick video introduction of the Gamma Band model can be seen by following this link.
Disclaimer
This is for informational purposes only and is not trading advice. The information contained in this article is subject to our full disclaimer on our website.
[1] The Gamma Band model in our SPX Market Report adjusts position size DAILY based upon the daily closing levels of SPX value and calculated Gamma Neutral. The Weekly Gamma Band model is shown for illustrative purposes only.
Authors
Erik Lytikainen, the founder of Viking Analytics. He has over twenty-five years of experience as a financial analyst, entrepreneur, business developer, and commodity trader. Erik holds an MBA from the University of Maryland and a B.S. in Mechanical Engineering from Virginia Tech.
Rob McBride has 15+ years of experience in the systematic investment space. He is a former Managing Director at a multi-billion dollar hedge fund. Furthermore, he has deep experience with market data, software, and model building in financial markets. Rob has a M.S. in Computer Science from the South Dakota School of Mines and Technology.


Michael Lebowitz, CFA is an Investment Analyst and Portfolio Manager for RIA Advisors. specializing in macroeconomic research, valuations, asset allocation, and risk management. RIA Contributing Editor and Research Director. CFA is an Investment Analyst and Portfolio Manager; Co-founder of 720 Global Research.
Follow Michael on Twitter or go to 720global.com for more research and analysis.
Customer Relationship Summary (Form CRS)
Also Read


