


We share the Weekly Gamma Bands Update by Viking Analytics. The report uses options gamma to help you better manage risk and your equity allocations.
Gamma Band Update
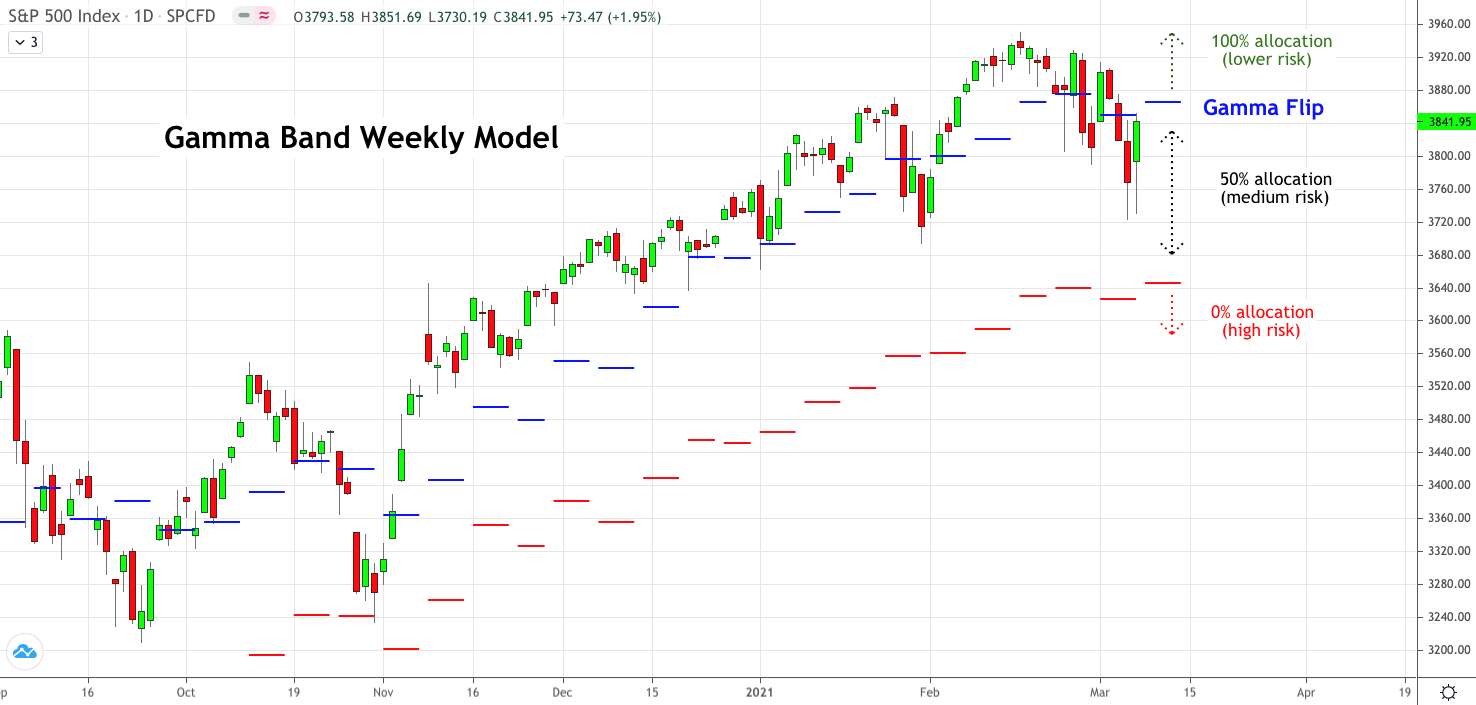
The Gamma Band model[1] has reduced allocation to the S&P 500 (SPX). When the daily price closes below the Gamma Neutral or “Gamma Flip” level (currently near 3,865[2]), the model will reduce exposure in order to avoid price volatility. If the market closes on a daily basis below the lower gamma level (currently near 3,645), the model will reduce the SPX allocation to zero.
This kind of model can be appropriate for investors who want upside exposure to the stock market, while protecting against downside tail risk. For investors who have been conditioned to “buy low and sell high,” it might seem counter-intuitive to increase allocations when the market rises, but this approach has shown to increase risk-adjusted returns in the back-test.
Last week, the Gamma Flip level shifted higher while volatility increased. As the quarterly March 19th quadruple witching date approaches, investors might expect continued up and down volatility. Reduced equity allocation is warranted for the next two weeks as long as price remains below the Gamma Flip level.
This is one of several signals that we publish daily in our SPX Report. A free sample of the SPX report can be downloaded from this link. Please visit our website to learn more about our daily reports and price signals.
The Gamma Flip – Background
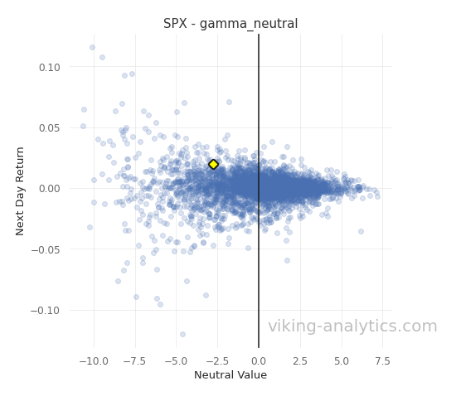
Many market analysts have noted that daily volatility in the S&P 500 will change when the value of the SPX moves from one gamma regime to another. Some analysts call this level the “gamma flip.” The scatterplot below shows how price volatility (on the y-axis) is increasingly lower as the value of SPX rises higher above the Gamma Neutral level (on the right side of the chart). When the value of the S&P closes lower than Gamma Neutral (to the left of the chart), volatility increases.
Gamma Band Model – Background
The purpose of the Gamma Band model is to reduce tail risk. The daily Gamma Band model has improved risk-adjusted returns by over 70% since 2007. The graph below demonstrates how this approach can limit drawdowns while maintaining good returns. A quick video introduction of the Gamma Band model can be seen by following this link.

Disclaimer
This is for informational purposes only and is not trading advice. The information contained in this article is subject to our full disclaimer on our website.
[1] The Gamma Band model in the SPX report adjusts position size daily based upon the daily closing levels of SPX value and calculated Gamma Neutral. The Weekly Gamma Band model is shown for illustrative purposes only.
[2] The Gamma Neutral level shifted higher this week for two reasons: 1) the quarterly March expiration has come nearer, and 2) the increase in volatility increases gamma across all strike prices. Since there are more puts than calls, these two factors result in more put gamma, which pushes the neutral level higher.
Authors
Erik Lytikainen, the founder of Viking Analytics. He has over twenty-five years of experience as a financial analyst, entrepreneur, business developer, and commodity trader. Erik holds an MBA from the University of Maryland and a B.S. in Mechanical Engineering from Virginia Tech.
Rob McBride has 15+ years of experience in the systematic investment space. He is a former Managing Director at a multi-billion dollar hedge fund. Furthermore, he has deep experience with market data, software, and model building in financial markets. Rob has a M.S. in Computer Science from the South Dakota School of Mines and Technology.

Erik Lytikainen, the founder of Viking Analytics, has over twenty five years of experience as a financial analyst, entrepreneur business developer and commodity trader. Erik holds an MBA from the University of Maryland and a BS in Mechanical Engineering from Virginia Tech. You can learn more about his work on his website: www.viking-analytics.com.
Also Read


