


We share the Weekly Gamma Bands Update by Viking Analytics. The report uses options gamma to help you better manage risk and your equity allocations.
Gamma Band Update
Entering the week of February 1, 2021, the Gamma Band model has cut its S&P 500 (SPX) exposure to 50%. When the daily price closes below the Gamma Neutral or “Gamma Flip” level as it did last week, the model will reduce exposure in order to avoid price volatility.
This kind of model can be appropriate for investors who want upside exposure to the stock market, while protecting against downside tail risk. If the S&P rotates to close back above 3,800, the model will rotate to a full allocation. If the market closes below 3,560, the model will reduce the SPX allocation to zero.
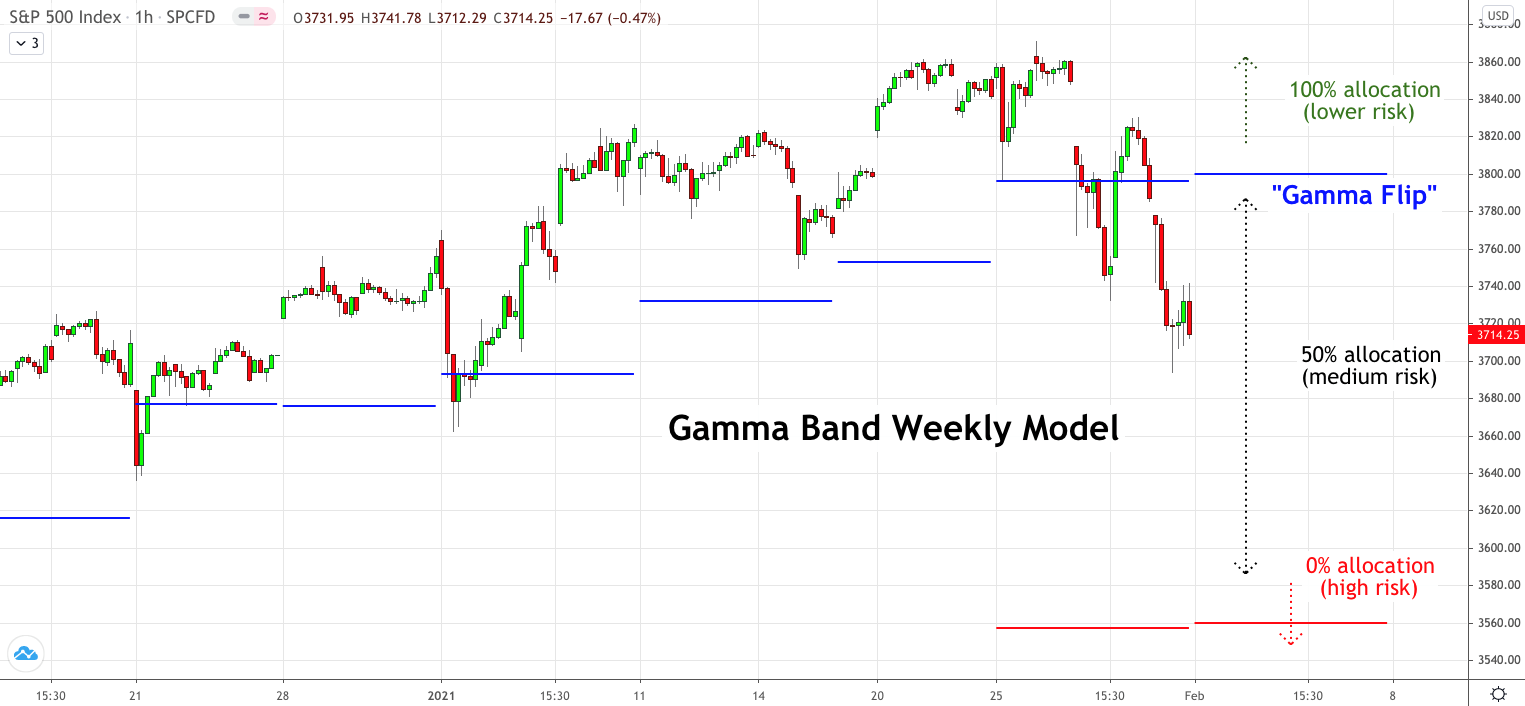
Gamma Band Model
Market participants are increasingly aware of how options gamma affects market risk and volatility. We have created a simple model that looks to cut equity exposure when risk is expected to increase. This strategy is appropriate for investors who want to limit large drawdowns in their portfolio.
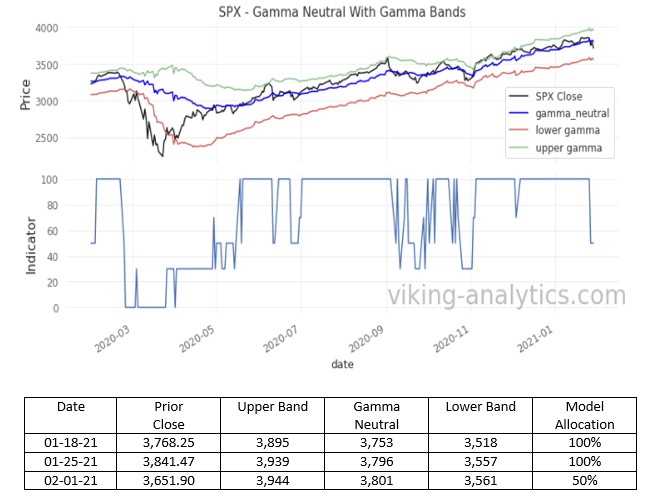
The upper chart below shows the relationship between the SPX, and the Gamma Neutral and related levels. The lower chart shows the daily allocation of the Gamma Band model for the past year.
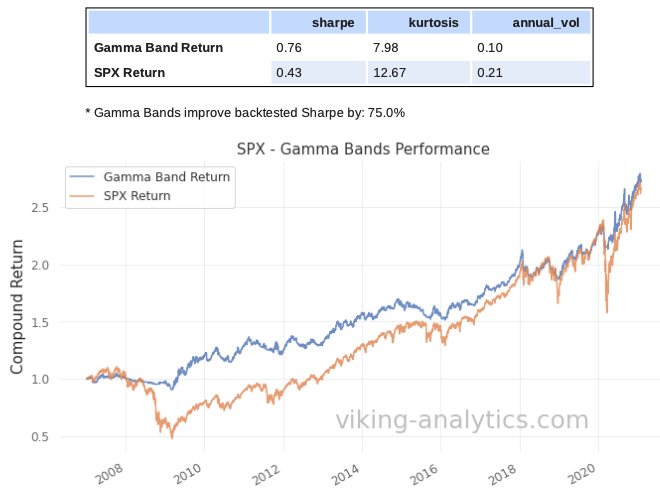
The Gamma Band model has resulted in a 75% improvement in risk-adjusted return since 2007 (measured by the Sharpe Ratio). A quick video introduction of the Gamma Band model can be seen by following this link.
Background on Gamma
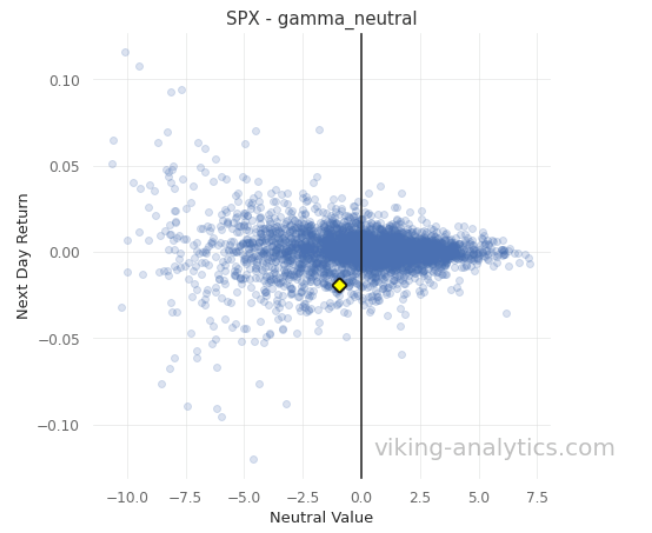
Many market analysts have noted that daily volatility in the S&P 500 will change when the value of the SPX moves from one gamma regime to another. Some analysts call this level the “gamma flip.” The scatterplot below shows how price volatility (on the y-axis) is increasingly lower as the value of SPX rises higher above the Gamma Neutral level (on the right side of the chart). When the value of the S&P closes lower than Gamma Neutral (to the left of the chart), volatility increases.
The purpose of the Gamma Band model is to reduce tail risk. The Gamma Band model has improved risk-adjusted returns by as much as 75% since 2007.
Disclaimer
This is for informational purposes only and is not trading advice. The information contained in this article is subject to our full disclaimer at www.viking-analytics.com.
Author
Viking Analytics is a quantitative research firm that creates tools to navigate complex markets. If you would like to learn more, please visit our website, or download a complimentary report.
Erik Lytikainen, the founder of Viking Analytics. He has over twenty-five years of experience as a financial analyst, entrepreneur, business developer, and commodity trader. Erik holds an MBA from the University of Maryland and a B.S. in Mechanical Engineering from Virginia Tech.
Rob McBride has 15+ years of experience in the systematic investment space. He is a former Managing Director at a multi-billion dollar hedge fund. Furthermore, he has deep experience with market data, software, and model building in financial markets. Rob has a M.S. in Computer Science from the South Dakota School of Mines and Technology.

Erik Lytikainen, the founder of Viking Analytics, has over twenty five years of experience as a financial analyst, entrepreneur business developer and commodity trader. Erik holds an MBA from the University of Maryland and a BS in Mechanical Engineering from Virginia Tech. You can learn more about his work on his website: www.viking-analytics.com.
Also Read


