


We share the Weekly Gamma Bands Update by Viking Analytics. The report uses options gamma to help you better manage risk and your equity allocations.
Gamma Band Update 12/14/20
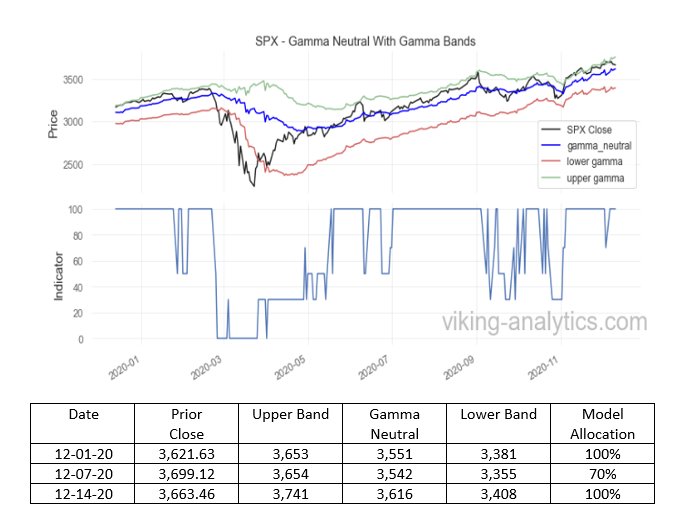
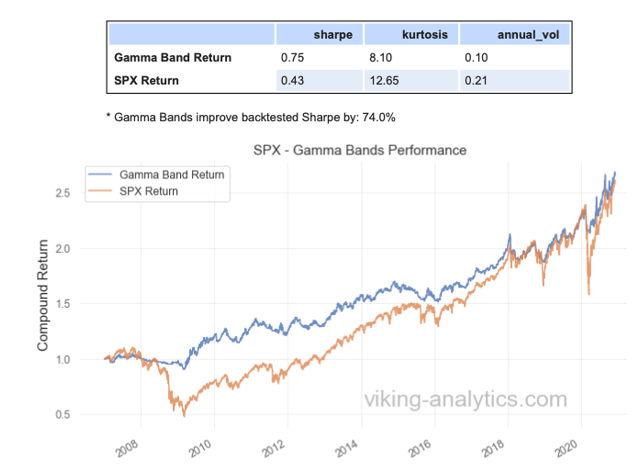
- The SPX Gamma Band model can be viewed as a long-only trend-following model that reduces exposure when options markets show elevated risk. Since 2007, following this model has similar returns to a long-only position in SPX, albeit with much lower risk exposure. The Gamma Band model has resulted in a 74% improvement in risk-adjusted return since 2007 measured by the Sharpe Ratio.
- The Gamma Band model has maintained a high exposure to the S&P 500 since the U.S. election. After a quick dip to 70% allocation last Monday, we have been back to a full 100% allocation for several days.
- The model will reduce SPX allocation when the value of the SPX closes on a daily basis below Gamma Neutral, which is currently near 3,616.
- Our binary Smart Money Indicator continues to have a full allocation; however, this index could turn cautionary after this Friday’s option expiration.
- SPX skew, which measures the relative cost of puts to calls, shows that the risk appetite of investors is becoming more cautious, but not bearish.
- We publish several signals each day, ranging from a fast signal in ThorShield to a less active signal (as represented by the Gamma Bands and published in the daily SPX report). Notably, our daily ThorShield allocation model will significantly reduce equity exposure at today’s close. A sample copy of all of our reports can be downloaded by visiting our website.
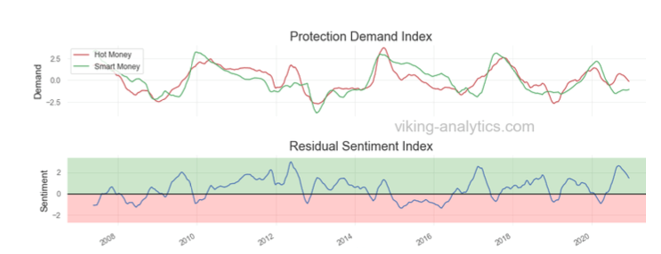
Smart Money Residual Index
This indicator compares “smart money” options buying to “hot money” options buying. Generally, smart money will purchase options to insure stable returns over a longer term. Smart money has in-depth knowledge and data in support of their options activity. In contrast, “Hot money” acts based on speculation, seeking a large payoff.
At the moment, hot money is more cautious than smart money, and the back-test for this model supports a long position during this time. When the Sentiment goes below zero (and the line moves from green to red), then this model will cut all equity exposure to zero. When the market is in the red regime below, the market has an overall negative return.
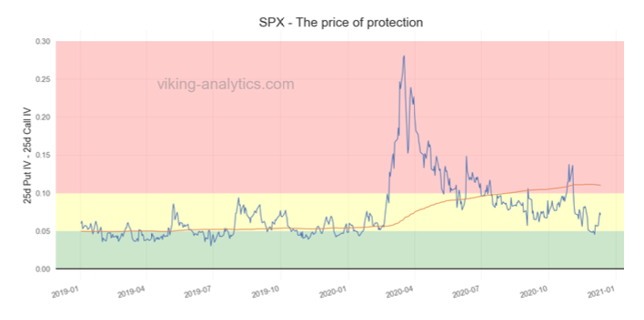
SPX Skew – the Price of Protection
In evaluating equity market risk, we also consider the cost of buying puts versus the cost of buying calls. When puts command a larger-than-usual premium to calls, then the market will have higher volatility (in the red zone below), and this might be a signal to reduce equity exposure.
Skew suggests that investors are neither bullish nor bearish at the moment.
Gamma Band Background
Market participants are increasingly aware of how the options markets can affect the equity markets in a way that can be viewed as the “tail wagging the dog.”
We created a Gamma Band indicator to demonstrate the effectiveness of the Gamma Neutral level in reducing equity tail risk. In our model, we compare the daily close of the SPX to the Gamma Neutral and Lower band levels to adjust our equity exposure allocation from 0% to 100%.
We back-tested this strategy from 2007 to the present and discovered a 74% increase in risk-adjusted returns (shown below). The Gamma Band model is a relatively slow but reliable signal if one’s goal is to increase risk-adjusted returns. Free samples of all of our daily reports can be downloaded from our website.
Authors
Viking Analytics is a quantitative research firm that creates tools to navigate complex markets. If you would like to learn more, please visit our website, or download a complimentary report.
Erik Lytikainen, the founder of Viking Analytics, has over twenty-five years of experience as a financial analyst, entrepreneur, business developer, and commodity trader. Erik holds an MBA from the University of Maryland and a B.S. in Mechanical Engineering from Virginia Tech.
Rob McBride has 15+ years of experience in the systematic investment space and is a former Managing Director at a multi-billion dollar hedge fund. Furthermore, he has deep experience with market data, software, and model building in financial markets. Rob has a M.S. in Computer Science from the South Dakota School of Mines and Technology.

Erik Lytikainen, the founder of Viking Analytics, has over twenty five years of experience as a financial analyst, entrepreneur business developer and commodity trader. Erik holds an MBA from the University of Maryland and a BS in Mechanical Engineering from Virginia Tech. You can learn more about his work on his website: www.viking-analytics.com.
Also Read


