


We share the Weekly Gamma Bands Update by Viking Analytics. The report uses options gamma to help you better manage risk and your equity allocations.
Gamma Band Update 10/26/20
- The Gamma Band model reduced exposure to 70% heading into the week. At the writing of this report mid-day on Monday, the SPX has traded down to 3,375, which would suggest a further reduction in exposure if the price closes below the Gamma Neutral level of 3,420.
- Our binary Smart Money Indicator continues to have a full allocation, as is discussed in greater detail below. The Smart Money indicator has fallen from very bullish levels but is a long way from changing to a flat allocation.
- SPX skew, which measures the relative cost of puts to calls, shows that put buyers are paying a meaningful premium over call buyers ahead of the U.S. presidential election.
- We publish several signals each day, ranging from a fast signal in ThorShield to a less active signal (as represented by the Gamma Bands and published in the daily SPX report). Samples of our SPX and ThorShield daily reports can be downloaded from our website.

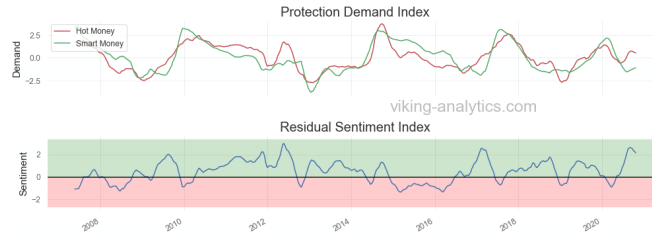
Smart Money Residual Index
This indicator compares “smart money” options buying to “hot money” options buying. Generally, the smart money will purchase options to ensure stable returns over the longer-term. Smart money has in-depth knowledge and data in support of their options activity. In contrast, “Hot money” acts based on speculation, seeking a large payoff.
At the moment, hot money is more cautious than smart money, and the back-test supports a long position during this time. When the Residual Sentiment Index in the second graph turns to red, then this model will cut all equity exposure to zero. When the market is in the red regime below, the market has an overall negative return.
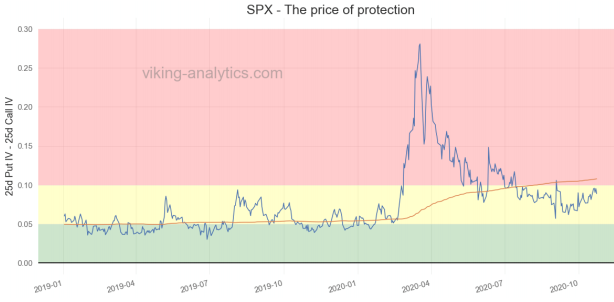
SPX Skew – the Price of Protection
In evaluating equity market risk, we also consider the cost of buying puts versus the cost of buying calls. When puts command a larger-than-usual premium to calls, then the market will have higher volatility (in the red zone below), and this can be a signal to reduce equity exposure.
Ahead of an important U.S. presidential election, put buyers are paying a premium for the protection.
Gamma Band Background
Market participants are increasingly aware of how the options markets can affect the equity markets in a way that can be viewed as the “tail wagging the dog.”
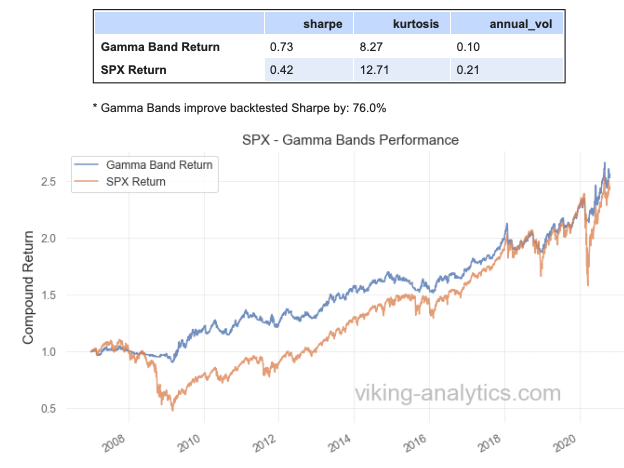
We created a Gamma Band indicator to demonstrate the effectiveness of the Gamma Neutral level in reducing equity tail risk. In our model, we compare the daily close of the SPX to the Gamma Neutral and Lower band levels to adjust our equity exposure allocation from 0% to 100%.
We back-tested this strategy from 2007 to the present and discovered a 76% increase in risk-adjusted returns (shown below). The Gamma Band model is a relatively slow but reliable signal if one’s goal is to increase risk-adjusted returns. We also publish a faster, daily signal in a portfolio model which we call Thor’s Shield. Thor Shield has a 20-year Sharpe of 1.5 and a rolling 1-year Sharpe of over 3.4. Free samples of our daily SPX report and Thor’s Shield model can be downloaded from our website.
Authors
Viking Analytics is a quantitative research firm that creates tools to navigate complex markets. If you would like to learn more, please visit our website, or download a complimentary report.
Erik Lytikainen, the founder of Viking Analytics, has over twenty-five years of experience as a financial analyst, entrepreneur, business developer, and commodity trader. Erik holds an MBA from the University of Maryland and a B.S. in Mechanical Engineering from Virginia Tech.
Rob McBride has 15+ years of experience in the systematic investment space and is a former Managing Director at a multi-billion dollar hedge fund. Furthermore, he has deep experience with market data, software, and model building in financial markets. Rob has a M.S. in Computer Science from the South Dakota School of Mines and Technology.


Michael Lebowitz, CFA is an Investment Analyst and Portfolio Manager for RIA Advisors. specializing in macroeconomic research, valuations, asset allocation, and risk management. RIA Contributing Editor and Research Director. CFA is an Investment Analyst and Portfolio Manager; Co-founder of 720 Global Research.
Follow Michael on Twitter or go to 720global.com for more research and analysis.
Customer Relationship Summary (Form CRS)
Also Read


