


We share the Weekly Gamma Bands Update by Viking Analytics. The report uses options gamma to help you better manage risk and your equity allocations.
Gamma Band Update 01/25/21
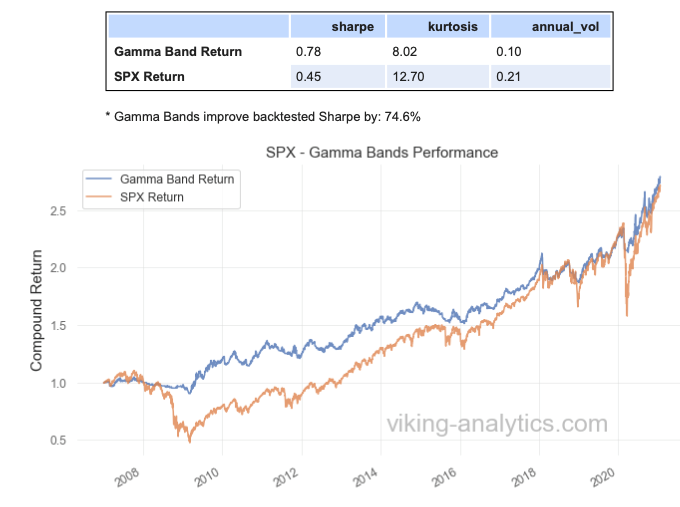
- The SPX Gamma Band model is a long-only trend-following model that reduces exposure when options markets show elevated risk. The Gamma Band model has resulted in a 75% improvement in risk-adjusted return since 2007 (measured by the Sharpe Ratio). A quick video introduction of the Gamma Band model can be seen by following this link.
- The Gamma Band model has maintained a high exposure to the S&P 500 since the U.S. election in November 2020. The model will generally maintain a 100% allocation as long as the price closes above Gamma Neutral, currently near 3,800.
- The model will cut S&P 500 exposure to 0% if the price closes below the lower gamma bound, currently at 3,557.
- The stock market is over-valued by many different fundamental and technical metrics. Nevertheless, our options indicators for SPX continue to maintain a full allocation.
- One strategy that could benefit from continued upside in SPX while protecting against downside risk would be to purchase out-of-the-money puts at the Gamma Neutral level and lower Gamma.
- We publish many different signals each day in four different pdf reports. A sample copy of all of our reports can be downloaded by visiting our website.
Gamma Band Model
The chart below shows the current level of the S&P 500 (black), along with the Gamma Neutral level and the upper/lower Gamma Bands.
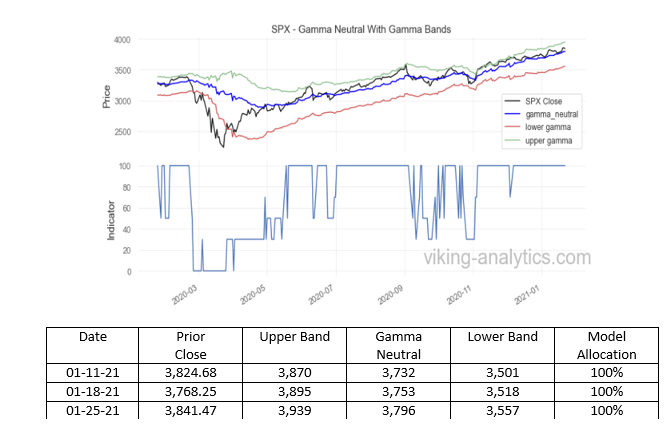
As the market continues to push above all-time highs, while being stretched on many fundamental and technical metrics, it is reasonable to consider risk management options. Since the Gamma Band model will cut long exposure when price closes below 3,800 and 3,550, investors could consider purchasing puts at these strike prices to cover a portion of their long exposure.
Gamma Band Background
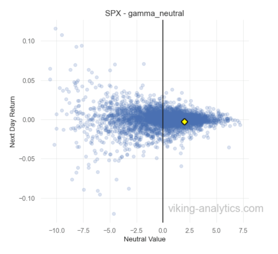
Many market analysts note daily volatility in the S&P 500 changes when the value flips from one gamma regime to another. We have labeled this regime change flip as the level of “Gamma Neutral.” The scatterplot below shows how price volatility (on the y-axis) is increasingly lower as the value of SPX rises higher above the Gamma Neutral level. When the value of the S&P closes below Gamma Neutral, volatility increases.
The purpose of the Gamma Band model is to increase risk-adjusted returns. Therefore, it reduces exposure when risk is expected to be higher (e.g. below the level of Gamma Neutral). This has shown to reduce equity tail risk and improve risk-adjusted returns by as much as 75% since 2007.
Disclaimer
This is for informational purposes only and is not trading advice. The information contained in this article is subject to our full disclaimer at www.viking-analytics.com.
Authors
Viking Analytics is a quantitative research firm that creates tools to navigate complex markets. If you would like to learn more, please visit our website, or download a complimentary report.
Erik Lytikainen, the founder of Viking Analytics. He has over twenty-five years of experience as a financial analyst, entrepreneur, business developer, and commodity trader. Erik holds an MBA from the University of Maryland and a B.S. in Mechanical Engineering from Virginia Tech.
Rob McBride has 15+ years of experience in the systematic investment space. He is a former Managing Director at a multi-billion dollar hedge fund. Furthermore, he has deep experience with market data, software, and model building in financial markets. Rob has a M.S. in Computer Science from the South Dakota School of Mines and Technology.

Erik Lytikainen, the founder of Viking Analytics, has over twenty five years of experience as a financial analyst, entrepreneur business developer and commodity trader. Erik holds an MBA from the University of Maryland and a BS in Mechanical Engineering from Virginia Tech. You can learn more about his work on his website: www.viking-analytics.com.
Also Read


