


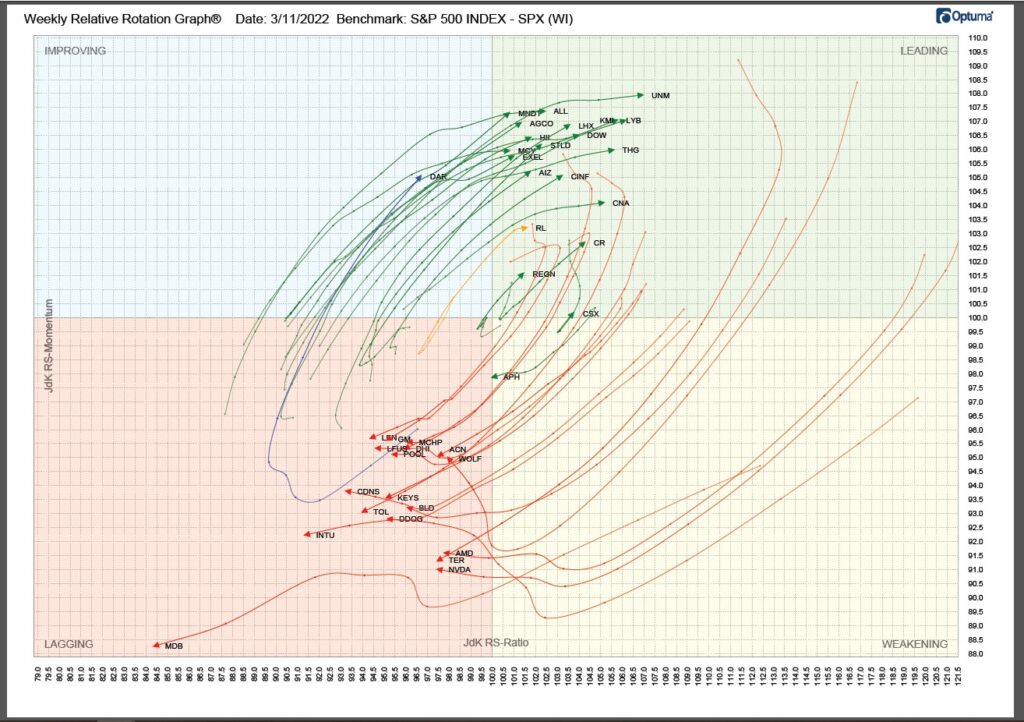
Relative Rotation Graph for Top 20 and Bottom 20 is provided below.
Also, use the following link that shows RRG over time – how stocks move in and out of favor over time: https://vimeo.com/manage/videos/710138044

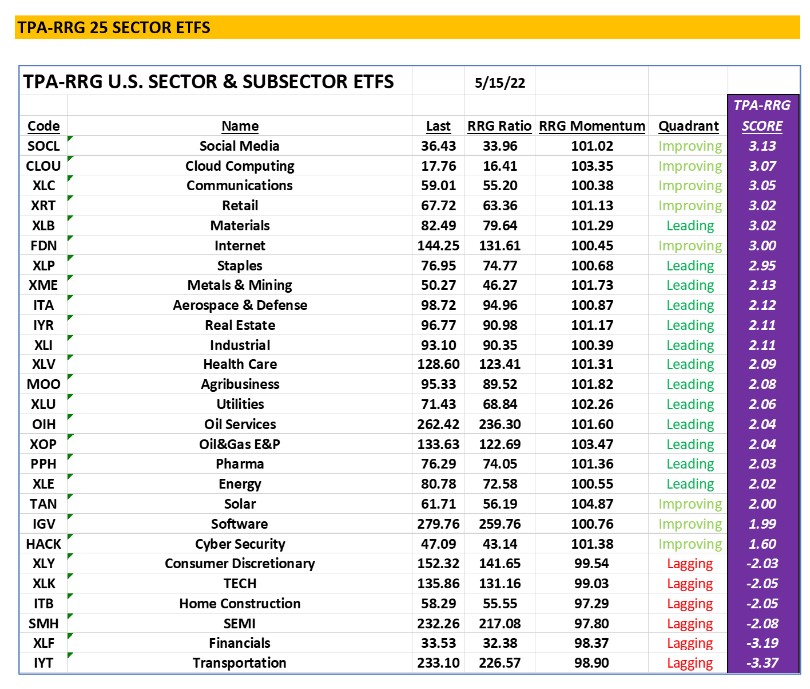
Sectors:
Social Media and Communication has made a real positive move in the past few weeks. This is a nod to risk coming back into the market and how oversold certain sectors had become. If this relative performance continues, watch for other beaten up areas like TECH and SEMIs to follow.
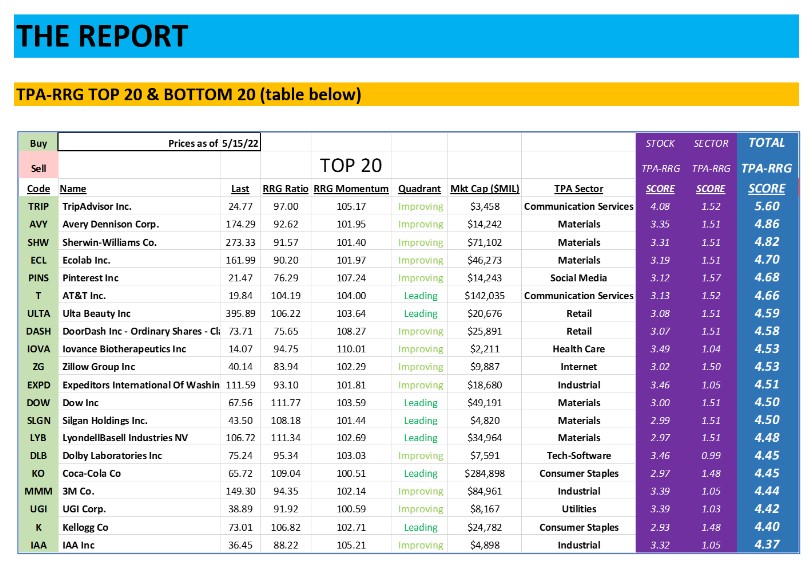
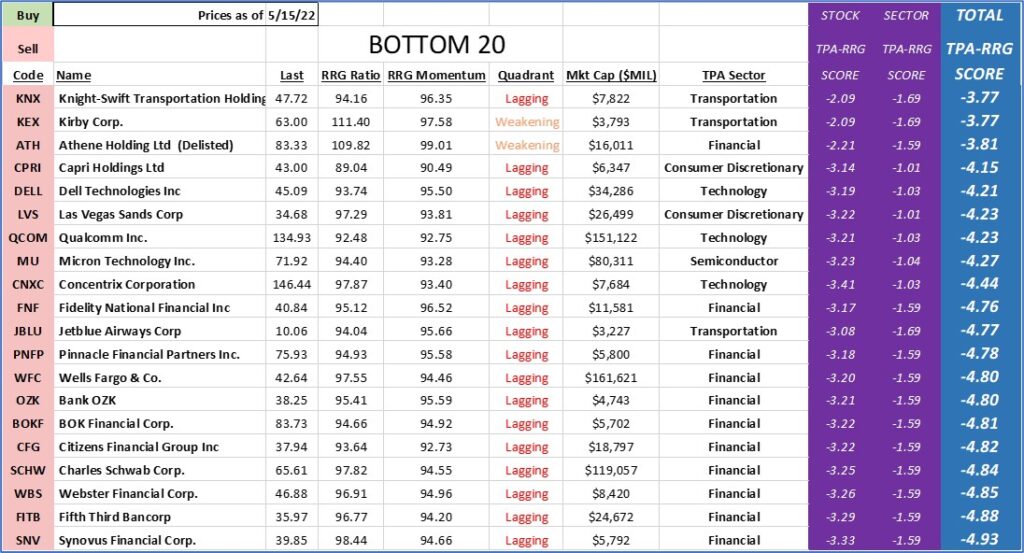
Top 20 & Bottom 20:
Although the Top 20 still contains a healthy does of Materials and defensive (Utilities and Staples) stocks, Social Media and Retail have crept into the mix.
The Bottom 20 is still predominated with Financial stocks. Russia will continue to weigh on the sector.
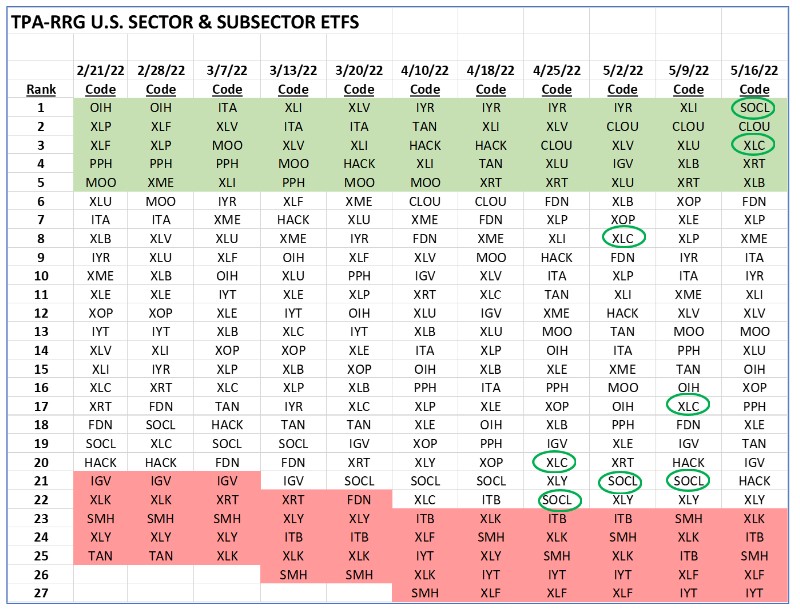
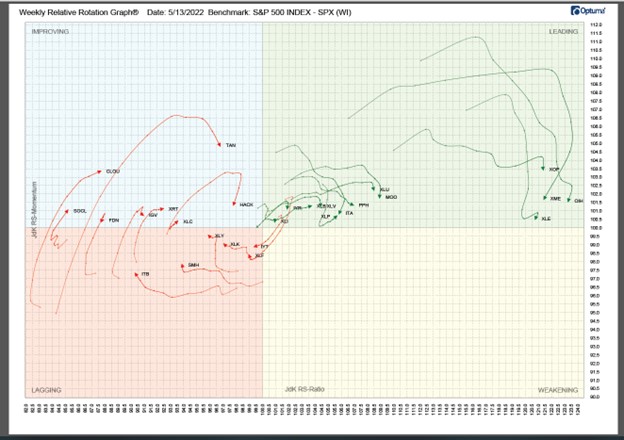
Relative Rotation Graph for 27 major sector & subsector ETFs provided below.
Also, use the following link that shows RRG over time – how sectors & subsectors move in and out of favor over time: https://vimeo.com/manage/videos/710132687
TPA-RRG SCORES FOR THE ENTIRE RUSSELL 1000
Click HERE for the entire Russell 1000 TPA-RRG Score and Rank Report.


Jeff Marcus founded Turning Point Analytics (TPA) in 2009 after 25 years on trading desks and 13 years as a head trader to provide strategic and technical research to institutional clients. Turning Point Analytics (TPA) provides a unique strategy that works as an overlay to clients’ good fundamental analysis. After 10 years of serving only large institutions, TPA now offers its research services to mid and small managers, RIA’s, and wealthy sophisticated individuals looking for a way to increase their returns and outperform their peers.
Subscribe 2 Week Trial
Customer Relationship Summary (Form CRS)
Also Read


