Relative Rotation Graph for Top 20 and Bottom 20 is provided below.
Also, use the following link that shows RRG over time – how stocks move in and out of favor over time: https://vimeo.com/manage/videos/715554974/privacy

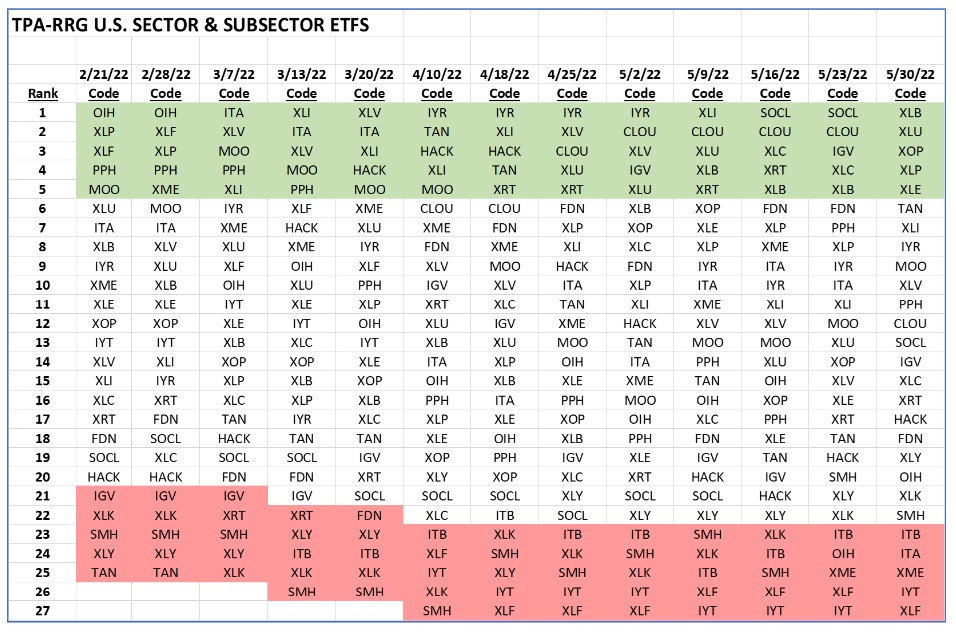
Sectors:
Positive Sectors:
- Utilities = safety
- Staples = safety
- Energy has moved back up as Energy price rise seems to be here to stay given geopolitical issues
Negative Sectors:
- Financials – Geopolitical pressures and turmoil. Uncertainty of rates.
- Transports – fuels prices and lingering Covid logistical issues
- Home Builders – mortgage rate spike, materials costs remain high
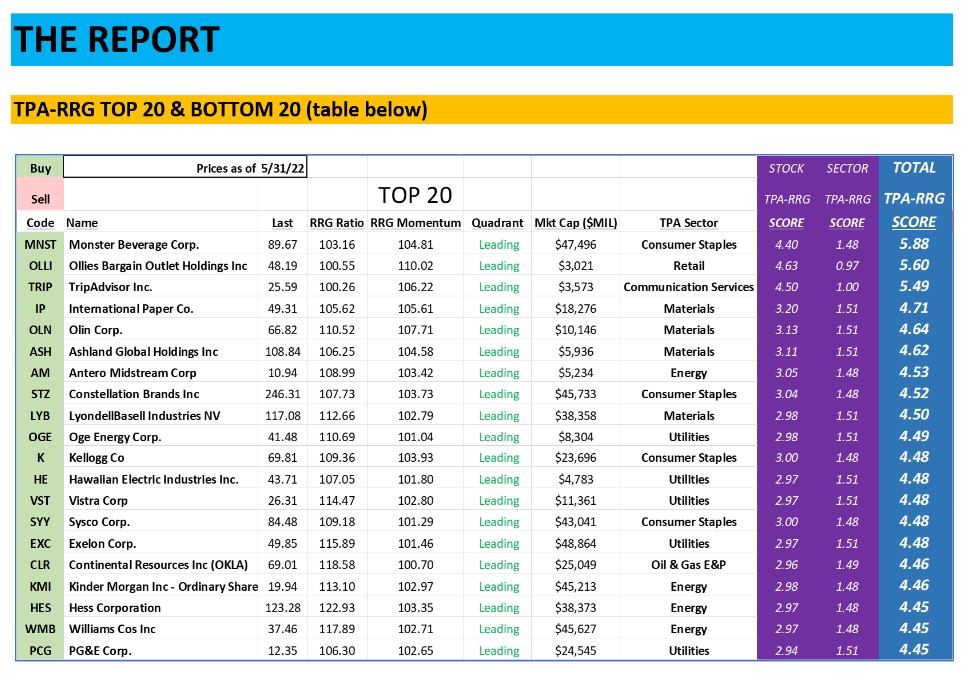
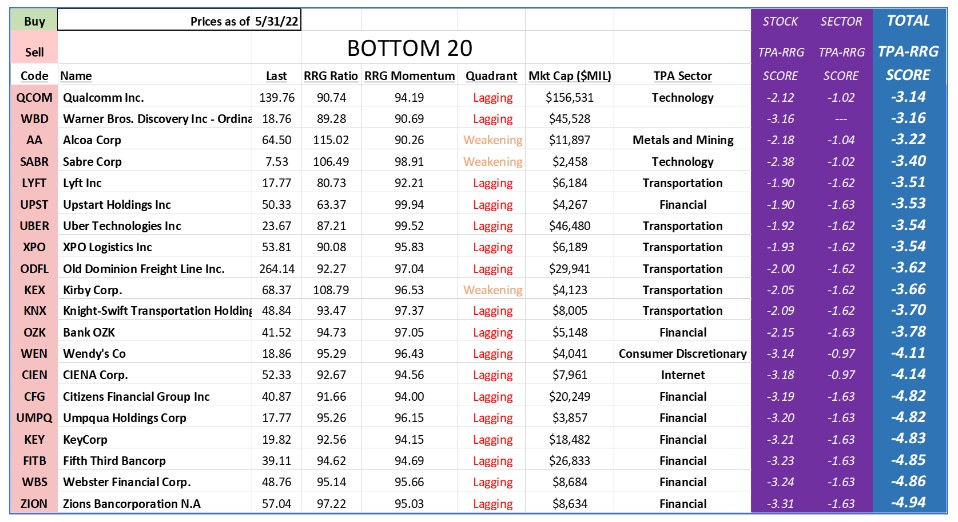
Top 20 & Bottom 20:
The Top 20 and Bottom 20 mirror sectors well. With Safe areas of the market remaining strong and Financials and Transports remaining weak.
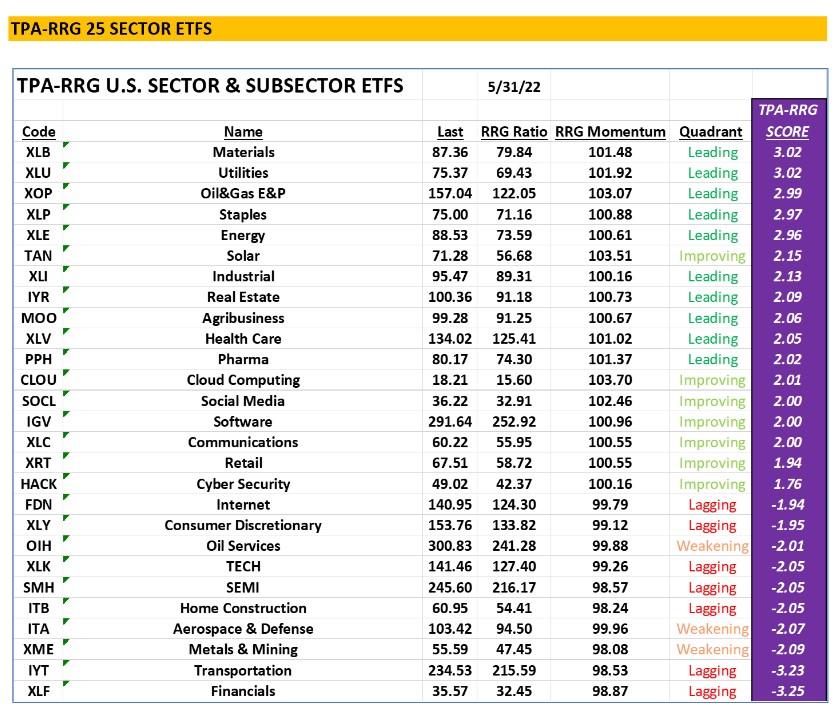
Relative Rotation Graph for 27 major sector & subsector ETFs provided below.
Also, use the following link that shows RRG over time – how sectors & subsectors move in and out of favor over time: https://vimeo.com/manage/videos/715545681/privacy


Jeff Marcus founded Turning Point Analytics (TPA) in 2009 after 25 years on trading desks and 13 years as a head trader to provide strategic and technical research to institutional clients. Turning Point Analytics (TPA) provides a unique strategy that works as an overlay to clients’ good fundamental analysis. After 10 years of serving only large institutions, TPA now offers its research services to mid and small managers, RIA’s, and wealthy sophisticated individuals looking for a way to increase their returns and outperform their peers.
Subscribe 2 Week Trial
Customer Relationship Summary (Form CRS)
Also Read