


Note from the RIAPro Team:
We are proud to offer TPA Analytics to you at a deeply discounted price. TPA has been serving institutional clients with their trading ideas and strategies. Now you can add the same long-short strategy and ideas to your portfolio as well.
Click on RIAPro+ today to add TPA Research to your subscription for just $20/month.
As a subscriber, you will receive real-time alerts of trading activity by TPA and a minimum of 2-reports each week.
Turning Point Analytics utilizes a time-tested, real-world strategy that optimizes the clients entry and exit points and adds alpha. TPA defines each stock as Trend or Range to identify actionable inflection points.
Thursday Was Brutal But Just One Day
Yesterday’s trading pattern fell in line with what TPA discussed last week. On 8/25, the World Snapshot, Buy Large Cap Value Versus Large Cap Growth at the Historic Extreme, explained that the:
Russell Large Cap Value index had become more oversold versus the Russell Large Cap Growth index that any other time in the past 40 years.
Oversold rallies of R1000 Value vs. R1000 Growth, since 1980, ranged between “+11% and +112%” and lasted between “6 months and 2-years.”
The idea is hardly a winner yet, but yesterday could be a start.
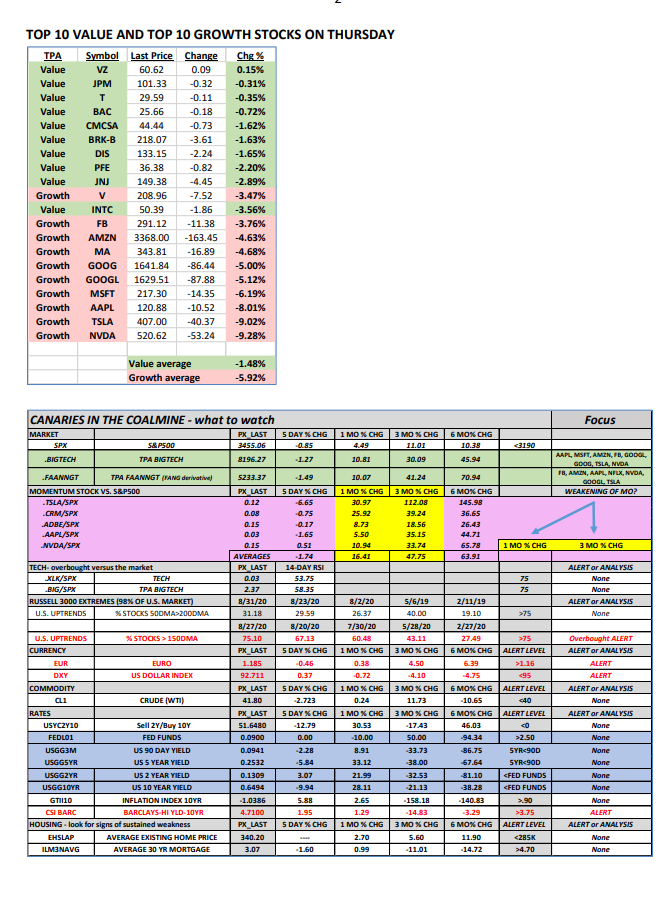
The table below shows that the average daily change for TPA’s top 10 Value stocks was -1.48%, far less than the -3.51% decline for the S&P500. On the other hand, the 10 Growth stocks TPA discussed on 8/25 were down an average of 5.92%.
TPA will continue to watch for a pattern to develop. So far, it is only one day. Clients should also monitor the Canaries in the Coalmine for a confirmed pattern change in momentum stocks (TSLA, CRM, ADBE, AAPL, and NVDA) mentioned in yesterday’s World Snapshot. These stocks finished the day as significant underperformers; TSLA -9.02%, CRM -4.22%, ADBE -4.87%, AAPL -8.01%, and NVDA -9.28%.
TPA MARKET SCOPE EXPLAINED
Market timing is not a complete investment strategy in and of itself, and one should not utilize it as a tool for successful investing.
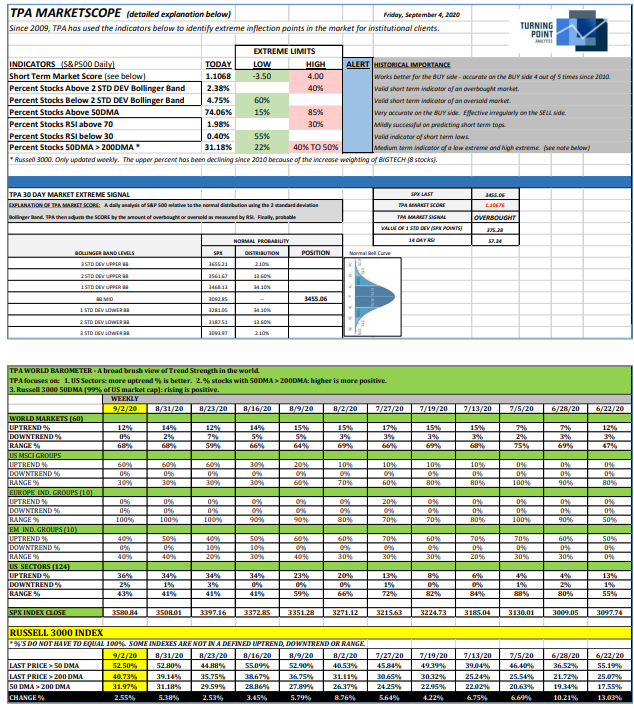
Knowing when stocks are at extremes can present investors with opportunities and help them to avoid pitfalls. The TPA Marketscope uses a set of carefully watched indicators to assess if the market is at or near extremes. When the market becomes oversold, risk-return favors buying and not selling, and when the market is overbought, risk-return favors selling and not buying.
TPA developed the seven indicators below after years of observation, and the extreme limits used have historically been levels that mark short-term and medium-term inflection points.
Indicators explained:
- Short term market score – is a daily analysis of the S&P500 relative to the normal distribution using the 2-standard deviation Bollinger Band. TPA then adjusts the score by the amount of overbought or oversold as measured by RSI.
- Percent stocks above or below the 2-standard deviation Bollinger Band – Bollinger Bands identify ranges using standard deviations away from a moving average. They, therefore, measure volatility (the width of the band) and extremes (using normal statistical distributions). In a normal distribution, 2-standard deviations identify 96% of all occurrences. As a stock reaches the apex of the 2-standard deviation Bollinger Band, it becomes more probable that the price will regress to the mean. TPA has found that historically market reversions are very likely when
40% of stocks are above, or 60% of stocks are below the 2-standard deviation Bollinger Band. - Percent stocks above the 50DMA. When a large number of stocks (85%) are trading above their 50DMA, the market is at an overbought extreme. When a small number of stocks (15%) are trading above the 50DMA, the market becomes oversold.
- Percent stocks RSI above 70 or below 30 – RSI is a measure of the speed and size of a recent move in a stock or index; the greater the price move and the quicker that move has taken place, the higher RSI. TPA has found that historically market extremes occur when 30% of stocks are trading above RSI 70 or when 55% of stocks are trading below RSI 30.
- Percent stocks 50DMA>200DMA – This is a longer-term measure of extremes. An uptrend is defined when short term prices consistently trade above longer-term prices. An example of an uptrend is Last > 20DMA > 50DMA > 200DMA. Technically, a long-term uptrend is defined by the 50DMA trading above the 200DMA. TPA has found that historic oversold extremes occur when 22% or fewer stocks are trading 50DMA>200DMA. The overbought extreme has become trickier since it has been declining since 2010 as a small number of TECH stocks have garnered an increasingly large percentage weighting in the S&P500. Currently, the extreme is approximately 40% to 50% of stocks trading 50DMA >200DMA.
TPA notes that not all of these indicators are equally consistent. Clients should use the “Historical Importance” comments to determine the weight they will assign to each alert.


Lance Roberts is a Chief Portfolio Strategist/Economist for RIA Advisors. He is also the host of “The Lance Roberts Podcast” and Chief Editor of the “Real Investment Advice” website and author of “Real Investment Daily” blog and “Real Investment Report“. Follow Lance on Facebook, Twitter, Linked-In and YouTube
Customer Relationship Summary (Form CRS)
Also Read


