


The Crosscurrents of In/De-flation Part 2
- Extraordinary times call for extraordinary measures.
- Extraordinary times and extraordinary measures do not usually lead to ordinary outcomes.
In the first part of this article, The Crosscurrents of In/De-Flation, we raise the specter that inflation may result from the synchronized combination of a variety of factors, including surging money supply, fractured supply chains, and in time, economic resurgence.
The current environment is deflationary, but what matters for investors is what will happen to prices tomorrow. Because monetary stimulus and economic activity are dynamic, answering the question is akin to solving an enormous jigsaw puzzle. Adding to the complexity and frustration, the image of this puzzle is changing as we work through it.
Regardless of what our half-finished puzzle looks like today, we must plan and strategize for contingencies that are out of the realm of recent experiences. Many investors view inflation as a low-probability event because of the dramatic decline in global economic activity.
Further influencing the consensus outlook is the economic experience coming out of the financial crisis. At that time, many thought that the radical policy steps taken in 2008-2009 would generate price inflation. It did not, at least not in traditional form.
Lastly, very few economists and investors have worked in a true inflationary era.
Analysis On In/De-flation
As we are fond of saying, you cannot predict, but you can prepare. Although inflation appears to be dead, those events that seem most unlikely would also be the most devastating due to a lack of preparedness.
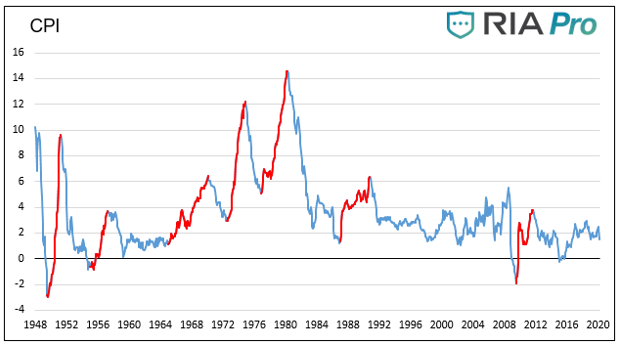
To prepare for the possibility of an inflationary outcome, we analyzed equity data going back to 1938. The data allows us to assess how the stocks of 49 specific industries performed during the seven inflationary periods noted in the first article and shown below. We also broke out the two inflationary periods of the 1970s as they most resemble today’s environment.

Cumulative Industry Returns
The chart below shows cumulative returns for the 49 industries through the seven inflationary periods. The gains and losses over each period compound upon each other. We break out the two periods in the 1970s in the second graph.
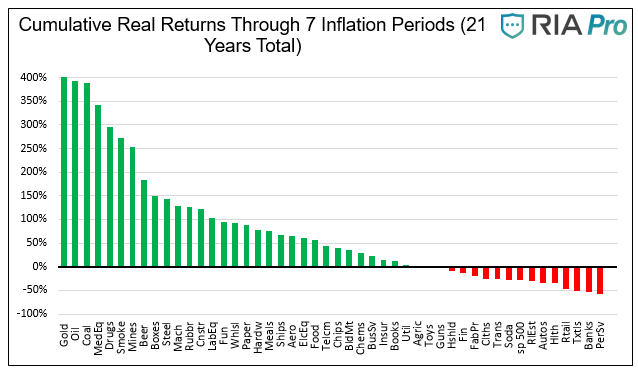
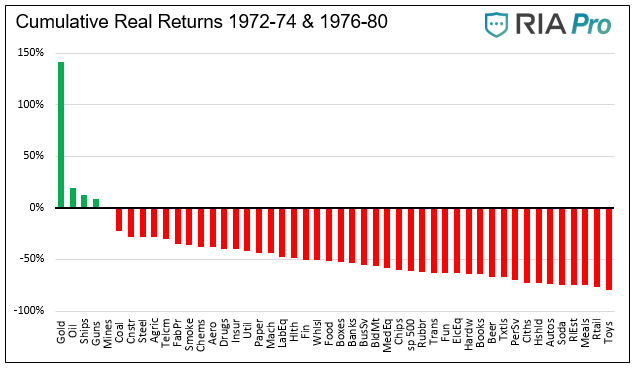
The dissimilarity between the returns of the 1970s and the other five periods is imposing. As shown, only four industries had positive real (after inflation) returns in the 1970s. Thirty-one industries had positive real returns through all seven periods, including the 1970s.
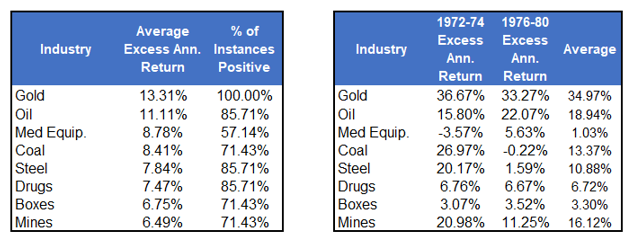
Excess Returns
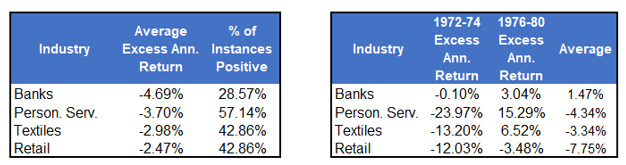
The bar chart below shows the excess returns versus the S&P 500 by each inflation era for the top eight industries. Below the chart is the excess return data for the top eight and bottom four sectors for all periods, as well as just the two episodes in the 1970s.
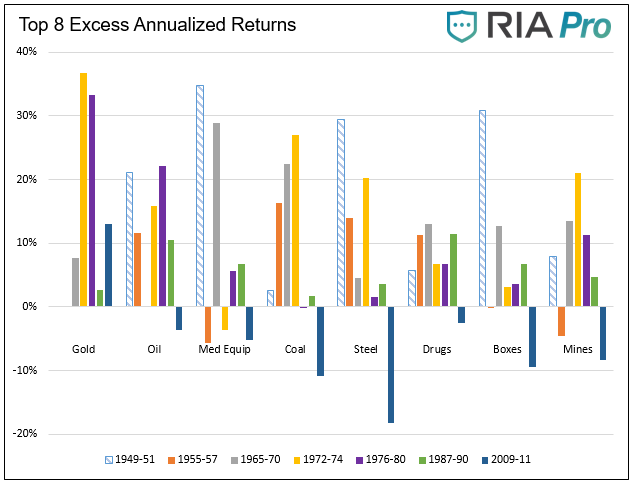
Best performing industries.
Worst performing industries.
Equity Valuations and Inflation
Now we take a step back and consider overall market valuations and how they react to bouts of inflation.
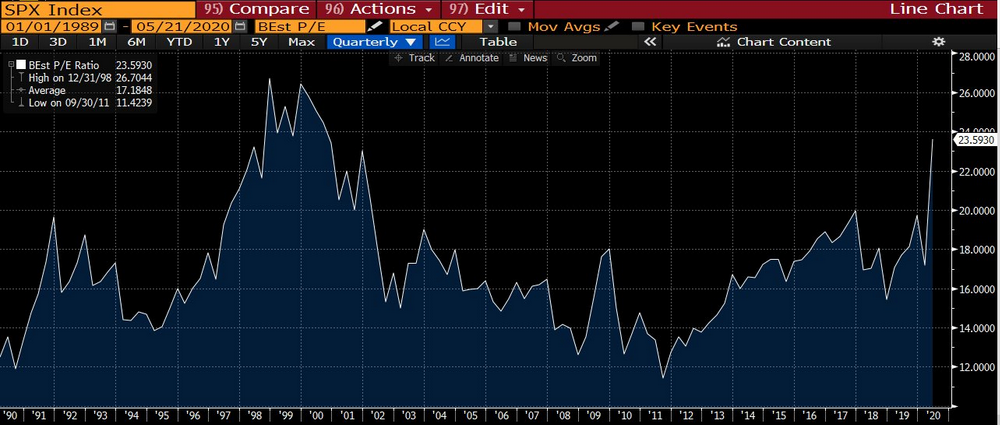
Equity valuations are a function of confidence. The price to earnings ratio (PE), for instance, measures the multiple the market is willing to pay for the future cash flows of a company or index. PE’s should be highest when the economic environment is not only favorable but predictable. Conversely, PE’s tend to be lowest during recessions and unstable financial periods.

Valuations from the months and years before Covid19 were historically high. Today, despite the economic devastation, they are even higher. As shown below, the price to forward earnings for the S&P 500 is accelerating and sits at levels last seen in the dotcom bubble.
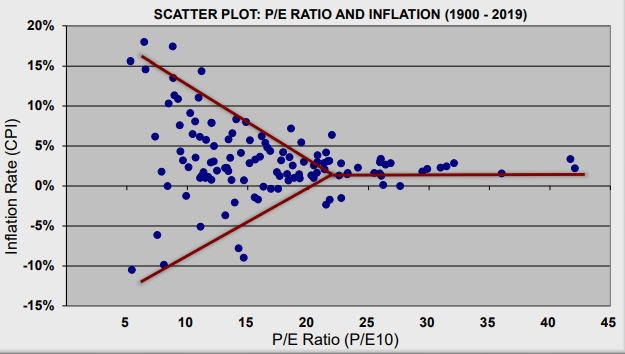
The scatter plot and bullet points below show that PE’s tend to be highest during periods with stable prices and lower during periods of inflation and deflation.
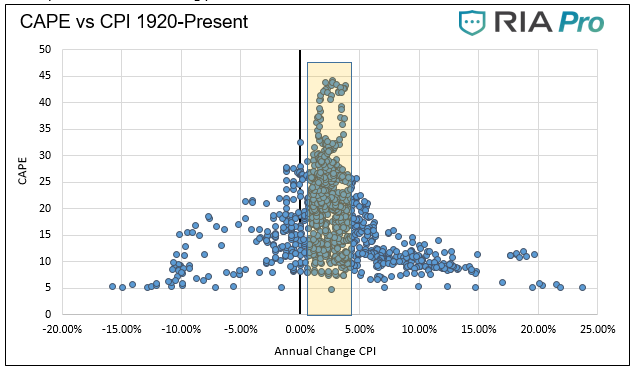
- Shiller’s CAPE ratio (CAPE) averaged 15.80 when inflation was less than 1%.
- CAPE averaged 13.29 when inflation was higher than 4%.
- CAPE averaged 20.43 when inflation was between 1% and 4%
Analysis from Ed Easterling at Crestmont Research in the table and chart below confirm our findings.
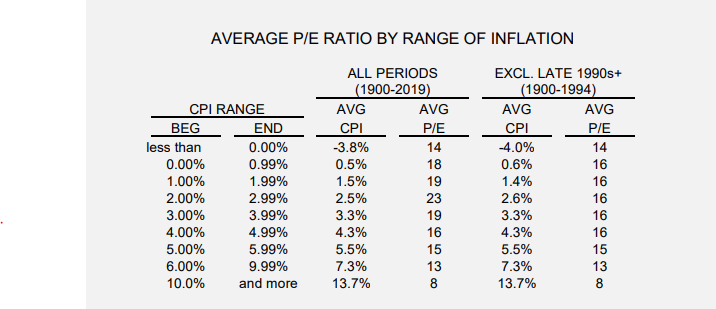
Copyright 2004-2020, Crestmont Research (www.CrestmontResearch.com)

Margins and Valuations
Inflation tends to shrink profit margins and is, therefore, a key factor in valuations. Below we present a proxy for profit margins using total corporate profits as a percent of GDP. The data in the graph is closely aligned with data from S&P but covers a more extended span allowing us to cover all seven inflationary periods.
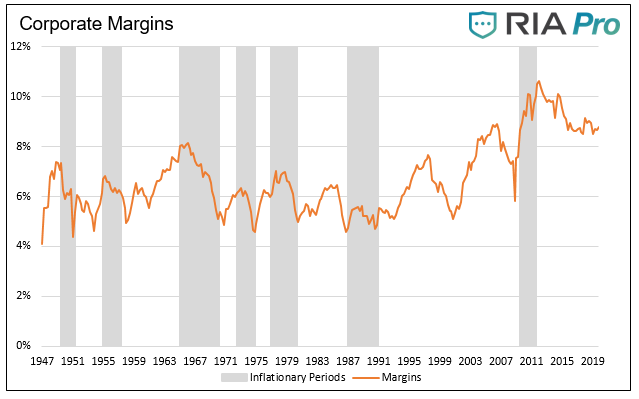
In five of the seven inflation periods, including both episodes in the 1970s, corporations experienced margin compression. The late 1980s/early 1990s was rather flat. The last era of inflation, post the 2008/09 recession, was the only one that saw margin improvement.
Currently, margins are off recent highs but still historically unparalleled. Odds are they revert to the norm if there is a whiff of inflation.
If inflation occurs, and history repeats, reduced margins, and lower valuations will cause many stocks to underperform grossly. Picking the right stocks and sectors will prove invaluable.
Summary Of In/De-Flation
What is sure about our current set of circumstances is that there are no experts on whom to rely. More than ever, we should consider the most unlikely outcomes as possibilities. Investors’ ability to protect wealth will depend on not being caught surprised.
The puzzle image will continue to change, with existing pieces going away and new pieces showing up. Inflation, if it does make an appearance, would be a significant wild card forcing investors to make very difficult, puzzle-altering, decisions.
Inflation will also force investors to throw away their processes and logic that has guided them well for the last thirty years.


Michael Lebowitz, CFA is an Investment Analyst and Portfolio Manager for RIA Advisors. specializing in macroeconomic research, valuations, asset allocation, and risk management. RIA Contributing Editor and Research Director. CFA is an Investment Analyst and Portfolio Manager; Co-founder of 720 Global Research.
Follow Michael on Twitter or go to 720global.com for more research and analysis.
Customer Relationship Summary (Form CRS)
Also Read


