


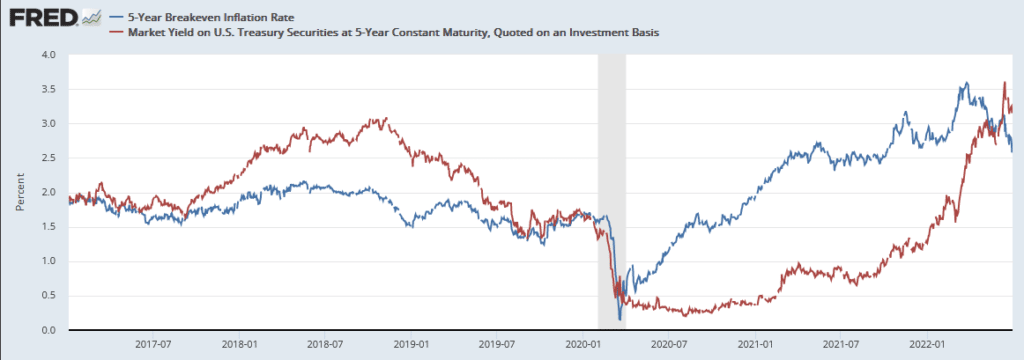
Bond markets are presenting quite a conundrum for investors. Over the last three months, the yield on five-year Treasury notes (red) has risen by .57%. This occurred despite implied five-year inflation expectations (blue) falling by over 1%. Believe it or not, inflation expectations are now down to levels seen last October. Most often in the bond markets, yields and inflation expectations are well correlated. So why are they moving in opposite directions?
For starters, five-year yields rose much slower than inflation expectations for the last two years. That was mainly the result of massive Fed bond purchases (QE), which kept bond market yields artificially low. With the Fed now reducing its balance sheet, a case can be made the bond market is worried about the growing supply of bonds. That said, the correlation between yields and inflation expectations is robust over time. If economic activity keeps weakening and inflation shows more signs of peaking, the demand for bonds should rise and more than offset the additional supply. Such an outcome is likely very bullish for bonds.

What To Watch Today
Economy
- Factory Orders, May (+0.5% expected, +0.3% prior)
- Factory Orders Excluding Transportation, May (+0.3% prior)
- Durable goods orders, May final (+0.7% expected, +0.7% prior)
- Durables excluding transportation, May final (+0.7% prior)
- Non-defense capital goods orders excluding aircraft, May final (+0.5% prior)
- Non-defense capital goods shipments excluding aircraft, May final (+0.8% prior)
Earnings
- No notable companies are expected to report.
Market Rallies To Start July….Can It Carry Through?
On Friday, the market rallied holding recent support. While the short-term advance was certainly welcome, as we have seen repeatedly this year, rallies have quickly been met by “trapped longs” looking to exit the market. However, the month of July tends to be more bullishly biased, and given the extremely negative sentiment a “reflexive rally” is certainly due.
From a contrarian view, a bullish rally is needed to lure the “bears” off-sides. Currently, there is TOO much bearishness in the market for a bear market to continue. As Bob Farrell once quipped, “when all experts agree, something else tends to happen.” What is needed is enough of a rally to get Jim Cramer proclaiming the “bear market bottom” is in, which will be a great point to most likely short the market once again.

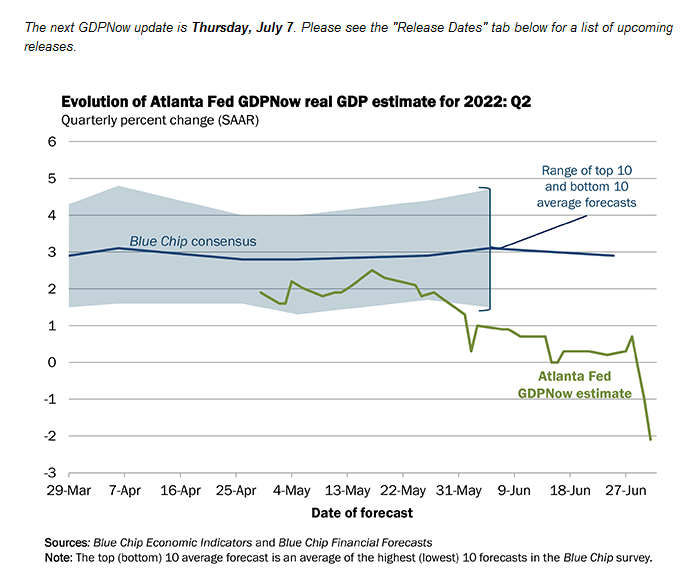
Atlanta Fed GDPNow Goes Very Negative
“The GDPNow model estimate for real GDP growth (seasonally adjusted annual rate) in the second quarter of 2022 is -2.1 percent on July 1, down from -1.0 percent on June 30. After this morning’s Manufacturing ISM Report On Business from the Institute for Supply Management and the construction report from the US Census Bureau, the nowcasts of second-quarter real personal consumption expenditures growth and real gross private domestic investment growth decreased from 1.7 percent and -13.2 percent, respectively, to 0.8 percent and -15.2 percent, respectively.” – Atlanta Fed
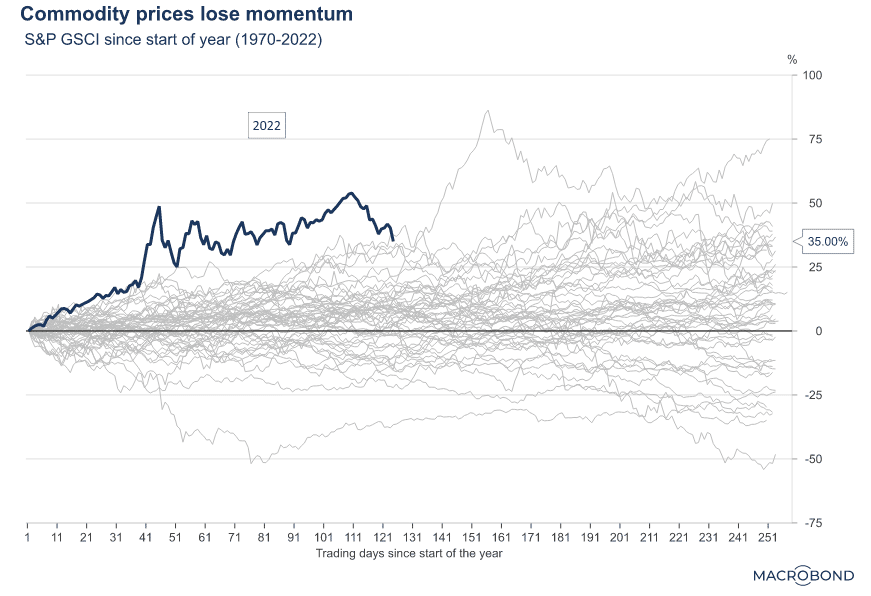
Commodity Prices
We recently discussed how the price of copper and many other vital industrial metals were off 20-50% from recent highs. The price declines are another hopeful sign that broader price pressures are abating. The graph below from MacroBond shares some historical context for this year’s rise in commodity prices. As it shows, the Goldman Sachs Commodity Index (GSCI) has fallen from recent highs. However, despite those declines, the year-to-date rise in commodity prices is still the second-highest in the last 50+ years for the first half of a year. If the index stays at current levels (+35%), it would still be the seventh-largest gain in the index for a year.
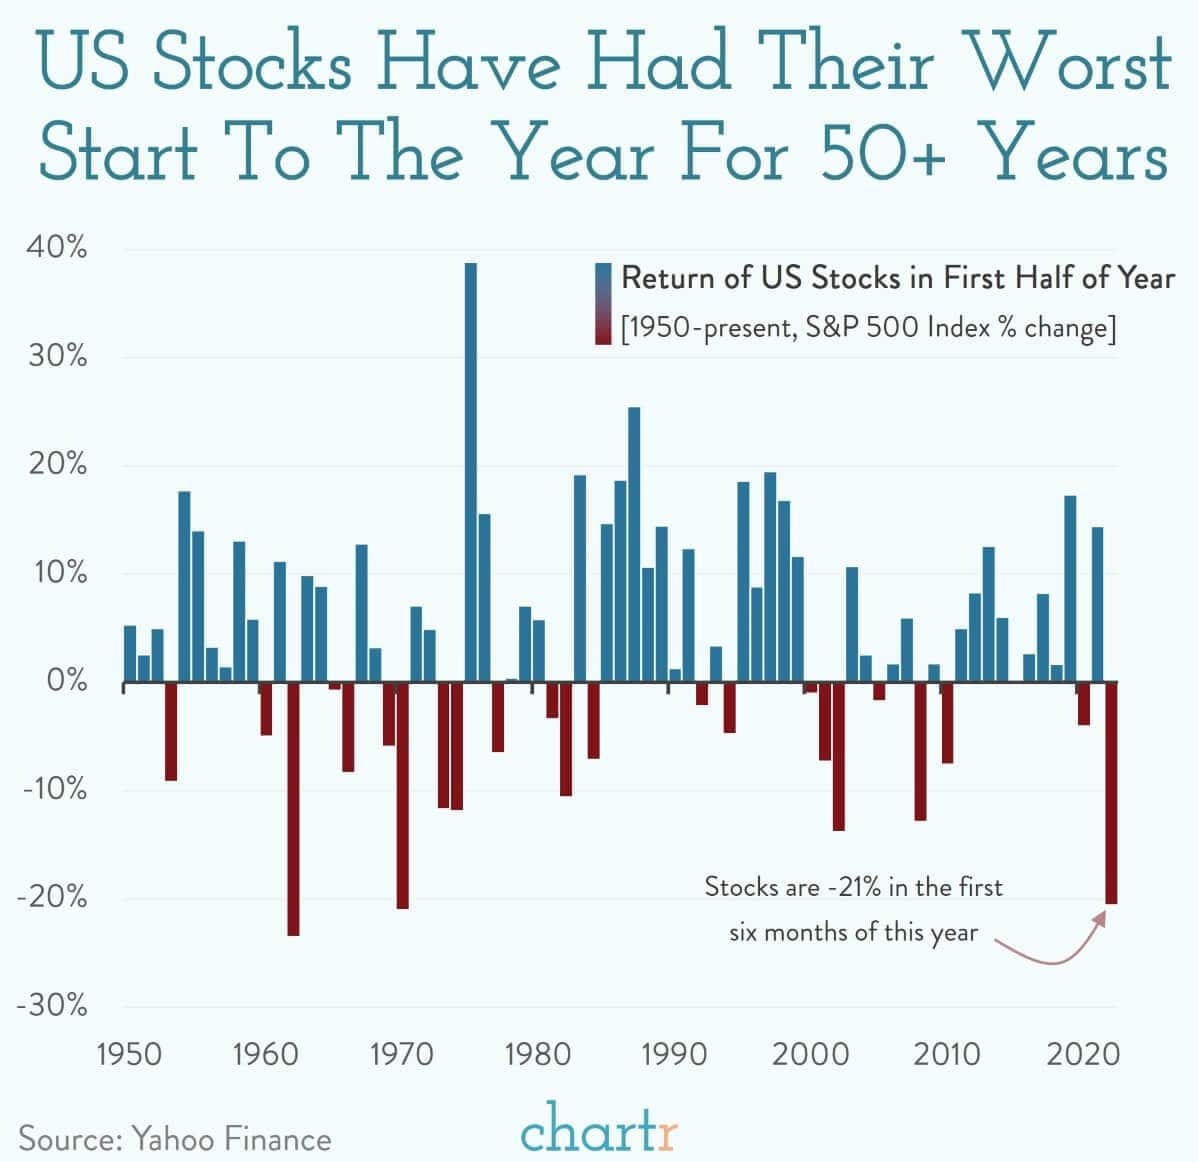
Worst Start In 50-Years
“The flagship S&P 500 Index declined 20.6% in value, putting 2022 off to the worst start for 52 years, when the index fell 21% in 1970. Before that you have to go back to 1962 when stocks fell 23.5% in the first half of the year — a crash which became known as the Kennedy Slide.
Where do we go from here?
The stock market is not the economy, but investors do try to anticipate what’s coming down the road — and JPMorgan analysts suggested a few weeks ago that the movement in stocks implies an 85% chance that the US economy does go into recession — and some high-profile investors already think we’re in one.
Trying to predict what stock markets do next is a notoriously humbling endeavour, but the historical data is reasonably optimistic. Of the 23 times that stocks have fallen in the first half of the year they’ve gone on to rise in the second half of the year on 12 occasions.” – Chartr
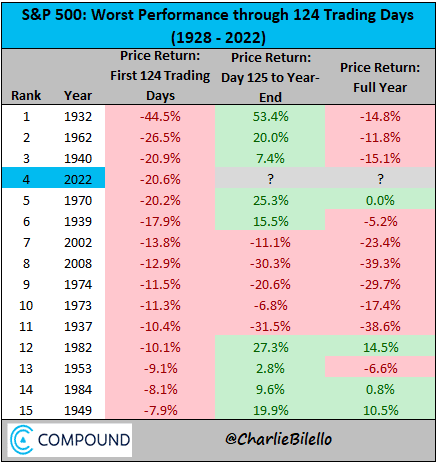
What Does History Predict for the Second Half?
Charlie Biello’s table below shows the 15 worst starts through the first half of the year going back almost a hundred years. The data is far from conclusive on what we might expect for the second half of the year. For example, the worst start to a year was in 1932. At the time, the S&P 500 fell by 44.5%. However, it rallied back strongly in the second half for the most significant second-half gain in the table. Gains followed two-thirds of the first-half losses. However, only two of the 15 instances had meaningful gains for the entire year.
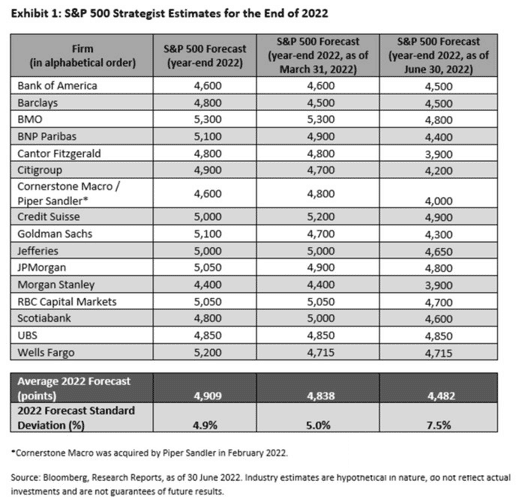
What Does Wall Street Expect for the Second Half?
The table below from Cornerstone Macro shows the progression of 2022 S&P 500 forecasts from Wall Street brokers/banks. The S&P 500 closed on December 31, 2021, at 4766. At the time, analysts thought the S&P 500 would rise by about 5% on average for the year. Only three of the 16 predicted a decline. Since then, their collective estimates have dropped by about 10%, but they remain optimistic the market will be up in the second half. However, only three of the 16 brokers, shown below, think the S&P 500 will close positive for 2022. They all think the second half of the year will produce gains.
We remind you Wall Street almost always presents optimistic outlooks. It’s not necessarily because they are bullish but because they sell stocks for a living. Further, stocks tend to rise more often than not. Accordingly, bullish forecasts are often correct, regardless of the rigor put behind the estimate.
Please subscribe to the daily commentary to receive these updates every morning before the opening bell.
If you found this blog useful, please send it to someone else, share it on social media, or contact us to set up a meeting.
Also Read


