


In Mid-August, I posited a potential bullish run on the S&P index to 3750. For that to occur from the levels we discussed then, several things would have to happen. One of those was a “vaccine.” Yesterday, the market surged higher on news the Pfizer was close to delivering a COVID-19 vaccine. Such sent investors scrambling on hopes that a vaccine will set the course for continued economic recovery.
In yesterday’s post, “Investors Ignore Evidence,” we discussed the problems with the “fundamental backdrop.” Most notably was the more extreme valuation of the market currently. To wit:
“There are two crucial points to take away from the data.
- There are several periods throughout history, where market returns were not only low but negative. (Given that most people only have 20-30 functional years to save for retirement, 20 years of low returns can devastate plans.)
- Periods of low returns follow periods of excessive market valuations and encompass the majority of negative return years.”
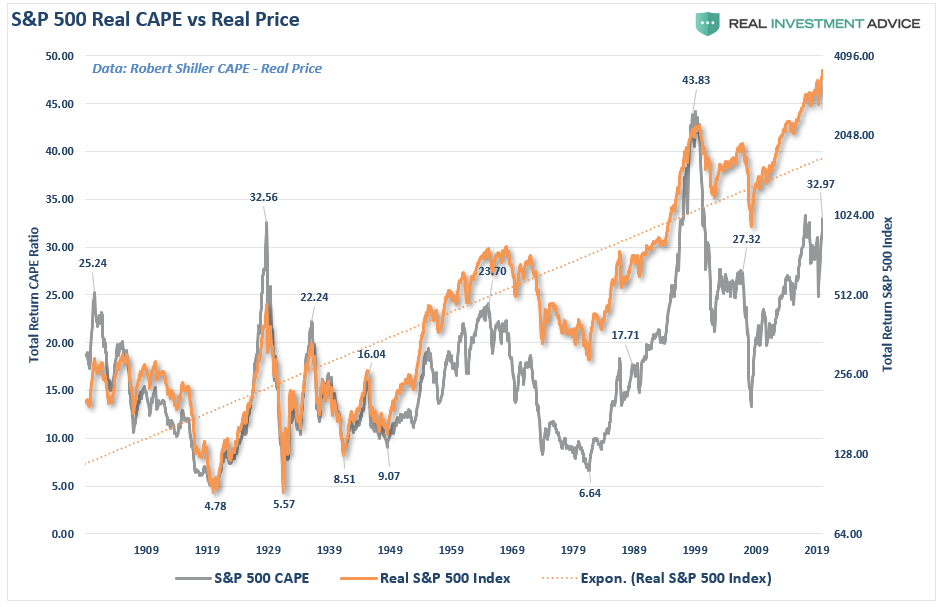
Importantly, as I also noted, valuations are often dismissed in the short-term because there is no immediate impact on price returns. By their very nature, valuations are HORRIBLE predictors of 12-month returns.
Such is why I want to focus solely on the current technical backdrop of the market.

Don’t Get Too Excited.
Before we get into the market’s short-term technical conditions, watch this short “3-minutes Video” from yesterday morning.
While the “vaccine” is certainly good news and gets people back to work, it inhibits the potential for more stimulus, and specifically QE. With employment rapidly heading back to “full employment,” and a vaccine potentially leading to an inflationary surge, the Fed may quickly become trapped in providing more support.
In the very short-term, the other problem is that markets are now back to extreme overbought levels following the gains last week.
Bulls Target 3750
Let me go back to the analysis from August.
“Technical analysis works well when there are defined “knowns” such as a previous top (resistance) or bottom (support) from which to build analysis. However, when markets break out to new highs, it becomes much more of a ‘wild @$$ guess’ or ‘WAG.’
I previously denoted several “risk/reward ranges.”
“With the markets closing just at all-time highs, we can only guess where the next market peak will be. Therefore, to gauge risk and reward ranges, we have set targets at 3500, 3750, and 4000.”
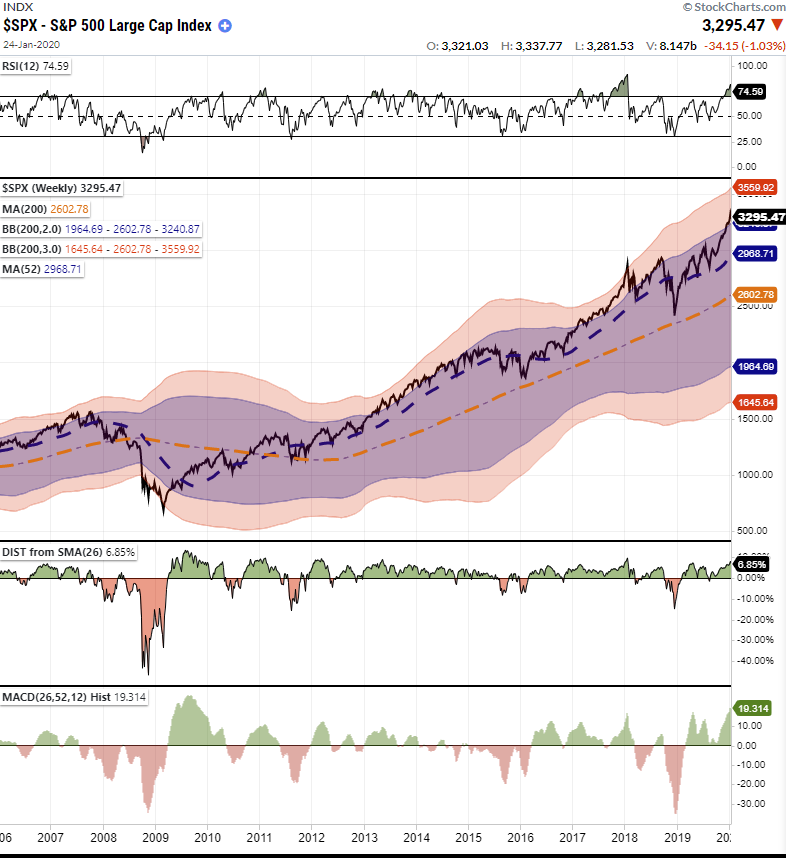
I have updated the chart below. The “black arrow” was where I initially did the analysis.

Since that point, the market has spent the last couple of months making very little headway. However, as noted in the past weekend in “Market Surges As Election Turns Into Optimal Outcome:”
“It was quite the reversal. The rally pushed the market back above the 50-dma and the downtrend of lower highs. Such sets the market up for a retest of all-time highs next week.”
On Monday, the market hit new all-time highs, keeping our target of 3750 intact for now.

Not Out Of The Woods
However, before you get all excited and go throwing your money into the market, you may want to step back and re-evaluate your risk. If you haven’t liked the ups and downs in the market over the last couple of months, you have too much “risk” in your portfolio.
The volatility most likely isn’t over. Particularly as we head into 2021.
Furthermore, while we did expect this rally and added exposure in our portfolios, the previous “oversold” condition has now been completely reversed. As shown below, the market is now back to more extreme “overbought” conditions, which suggests limited upside from current levels. Also, the deviation from the 200-dma is now back to levels that have previously led to mild, short-term corrections.
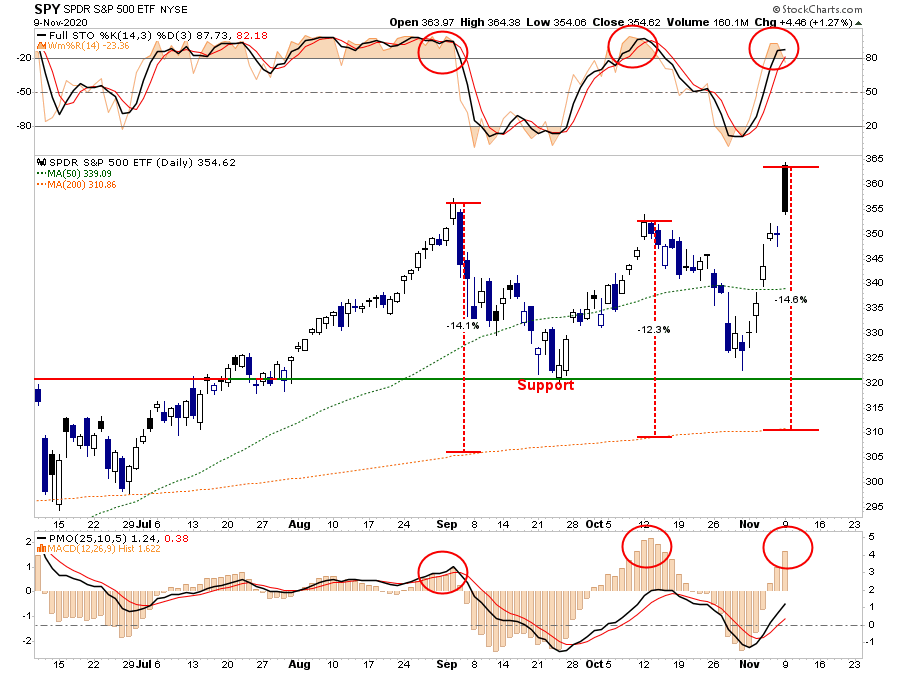
While it is undoubtedly feasible the markets will end the year closer to 3750 than not, it is likely we will see better entry opportunities along with way.
More importantly, much of the rally yesterday was in the most heavily shorted and beaten-up sectors. Such tends to occur at the latter end of a rally rather than the beginning.

Bulls Chant Into A Megaphone
While the bulls are currently cheering “all-time highs,” it falls within the context of an ongoing topping process referred to as a “megaphone” pattern. Here is the definition:
“A broadening formation is a price chart pattern characterized by increasing price volatility and diagrammed as two diverging trend lines, one rising and one falling.
These formations are relatively rare during normal market conditions over the long-term since most markets tend to trend in one direction or another over time. The formations are more common when market participants have begun to process a series of unsettling news topics. Topics such as geopolitical conflict, a change in Fed policy, or a combination of the two, are likely to coincide with such formations.
Broadening formations are generally bearish for most long-term investors since they are characterized by rising volatility without a clear move in a single direction.”
It’s Just A Chart
This broadening, or megaphone, the market pattern is seen below on the monthly chart. Notably, despite the “correction” in March, the “bull market” that began in 2009 remains intact as the low monthly close did not break the 4-year moving average.
Furthermore, this is a “monthly” chart, so it takes a long period to form. As such, it is critical to consider this analysis in context. The chart does not mean the markets are about to crash, nor is it a useful tool to try and “time” the market.
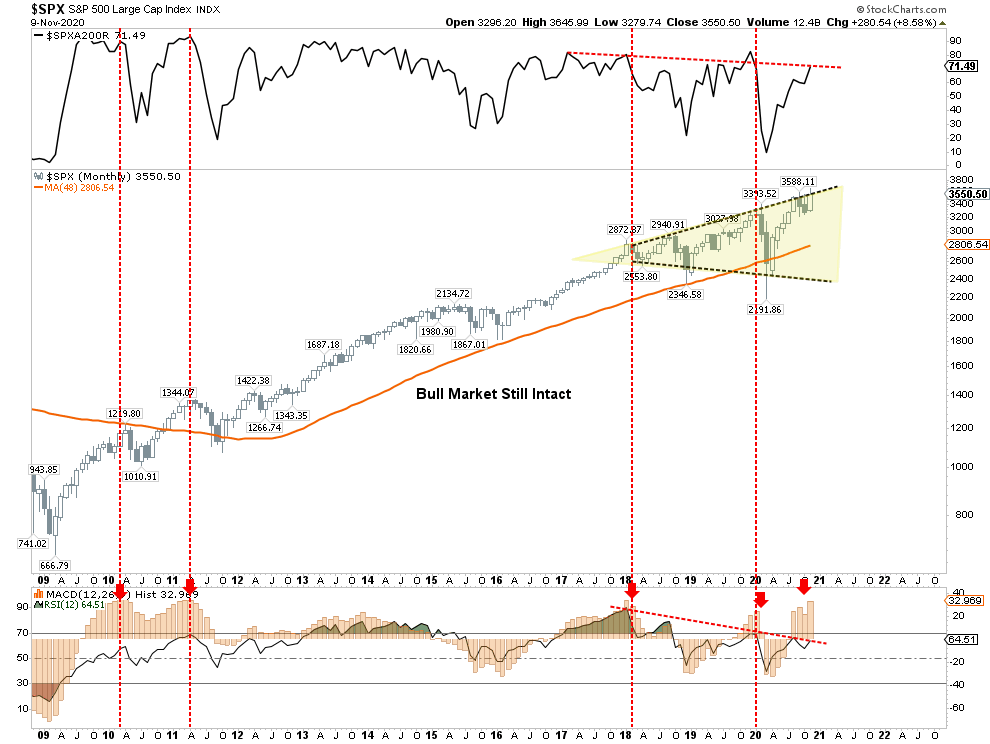
As I noted back in August when I first published this chart:
“The market will hit new highs as it reaches the top of the upper trendline, meeting more formidable resistance. With the market back to a more extreme overbought condition, the ‘low hanging fruit’ has been picked.”
It is worth noting the market rallied to the upper trend line on Monday and held there. The long-term negative divergence in relative strength, and the extreme overbought condition, are certainly concerning.
While the impetus of a “vaccine” is certainly welcome, it is not as if the market is starting to rally from deeply oversold conditions that would align valuations with a recessionary economy.
Instead, we are launching from an overvalued, extended, and deviated market from long-term means.
Warning Signs
In the short-term, the market seems headed higher. However, it is worth remembering that every previous peak of the market since 2016 has been from “all-time” highs.
With the market again back to all-time highs, there are numerous warning signs of excess built up, which could trigger a short-term correction.
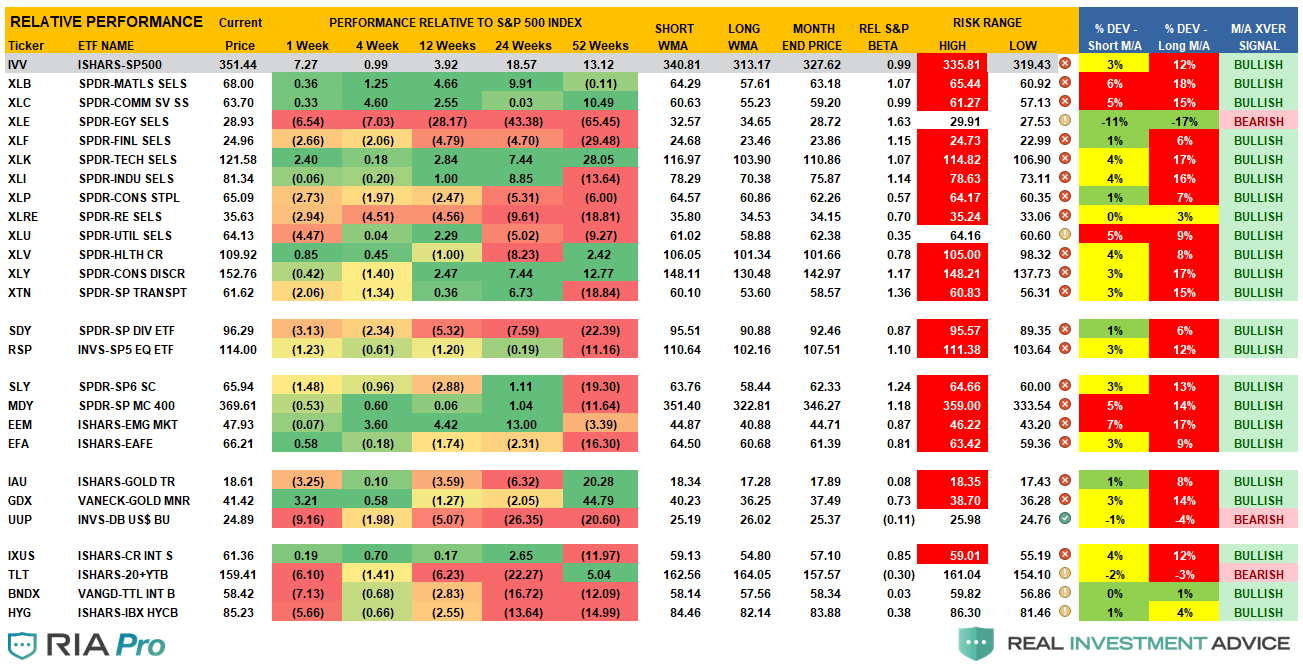
Currently, our Technical Gauge is back to more extreme levels (RIAPro technical gauge below)
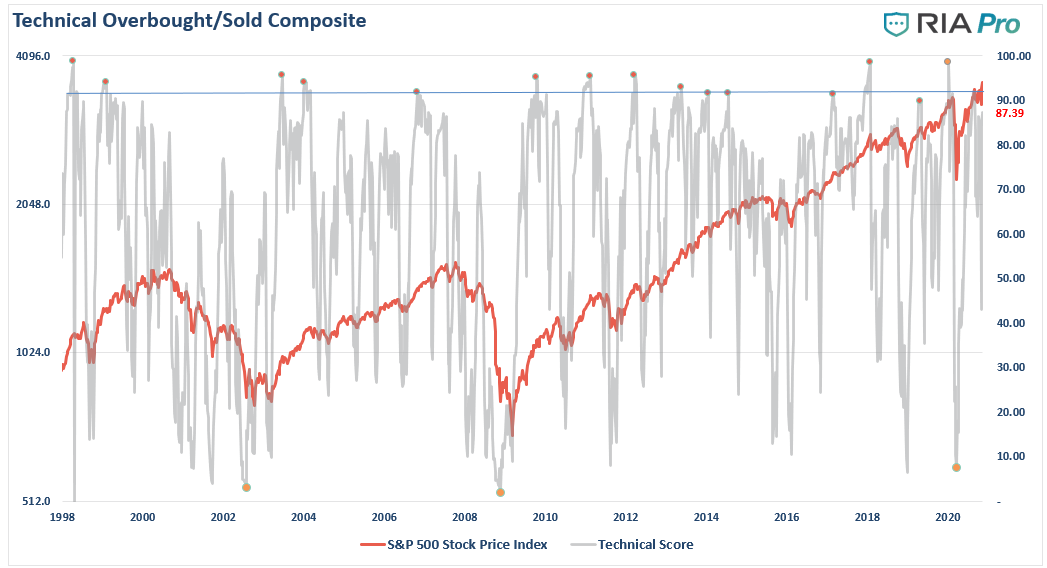
Almost every sector is above its monthly risk-ranges, suggesting a short-term correction is likely.
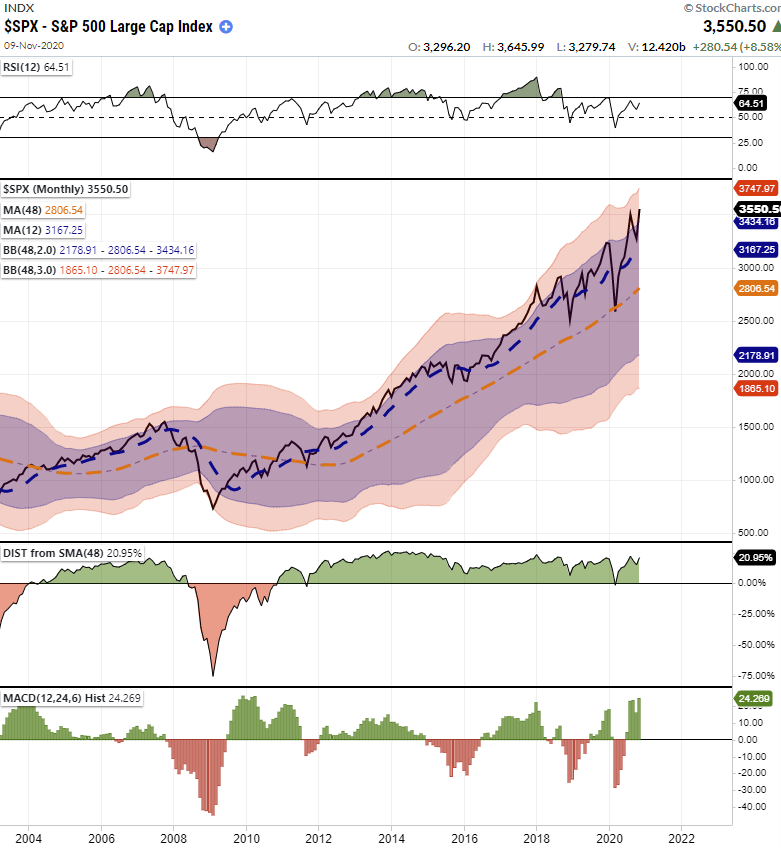
Lastly, the S&P 500 is pushing 3-standard deviations above the 4-year moving average. Such usually has been a point where a correction ensued.
Monthly, we also see a market that is signaling several cautionary signs.
- Despite the rally since 2018, the market has continued to exhibit a negative divergence in relative strength.
- The market is once again pushing 3-standard deviations above the 4-year moving average.
- The market is now 22.47% above the 4-year moving average, which matches previous highs.
Currently, the evidence is mounting that markets are reaching the limits of the current move. By itself, these signs reflect the prevailing extremely bullish attitude of market participants.
However, the more extreme extensions provide the “fuel” for a sell-off given an unexpected catalyst. The ensuing “reversion” tends to catch overly confident “bulls” off guard.

Conclusion
As we noted in the weekend’s newsletter:
“After the election passed, and we could see where the markets were positioning themselves, we reallocated that cash and took our equity exposure back to target weightings.
There were two primary reasons for the reversal. The first was that the sell-off had removed short-term risk over the last few weeks. The second was the outcome of the election perceived as favorable to the markets, as discussed above. There are still risks to that view until the election is officially over. Therefore, we will keep a close watch on holdings and tighten up our stops.“
Unfortunately, whatever short-term “entry point” existed to add equities to portfolios, the torrid rally extinguished it.
While the next two months tend to be positively biased, there is still a considerable risk to the markets, as shown in the charts above. Significantly, the more extreme deviations from long-term means do limit further upside.
It is important not to chase markets. Remain patient and wait for opportunities to add exposure and rebalance risks accordingly.
Yes, the markets are indeed bullishly biased, and while it may seem markets can only go higher, they generally don’t.
That tends to happen just when you least expect it.


Lance Roberts is a Chief Portfolio Strategist/Economist for RIA Advisors. He is also the host of “The Lance Roberts Podcast” and Chief Editor of the “Real Investment Advice” website and author of “Real Investment Daily” blog and “Real Investment Report“. Follow Lance on Facebook, Twitter, Linked-In and YouTube
Customer Relationship Summary (Form CRS)
Also Read


