


On December 5th, 1996, during a televised speech then Fed Chairman Alan Greenspan stated:
“Clearly, sustained low inflation implies less uncertainty about the future, and lower risk premiums imply higher prices of stocks and other earning assets. We can see that in the inverse relationship exhibited by price/earnings ratios and the rate of inflation in the past. But how do we know when irrational exuberance has unduly escalated asset values, which then become subject to unexpected and prolonged contractions as they have in Japan over the past decade?”
It is an interesting point given that the U.S. has sustained very low rates of inflation combined with both monetary and fiscal stimulus which have lowered risk premiums leading to an inflation of asset prices.
The advance has had two main storylines to support the bullish narrative.
- It’s an earnings recovery story, and;
- It’s all about tax cuts.
There is much to debate about the earnings recovery story. However, despite many who are suggesting this has been a ‘rational rise’ due to strong earnings growth, that is simply been the case of tax rate reductions and share-buybacks. (I only use ‘reported earnings’ which includes all the ‘bad stuff.’ Any analysis using “operating earnings” is misleading.)”

Since 2014, the stock market has risen (capital appreciation only) by 55% while reported earnings growth has risen by a total of 29% all of which is attributable to a change in the corporate tax rate. Such hardly justifies an 89.6% premium over earnings.
Of course, even reported earnings is somewhat misleading due to the heavy use of share repurchases to artificially inflate reported earnings on a per share basis. However, corporate profits BEFORE tax give us a better idea of what profits actually were since that is the amount earned before tax cuts were applied.

Here, a much different picture emerges as a 6.7% cumulative gain in profits makes it increasingly difficult to justify such a large gain in asset prices.
We can also use the data above to construct a valuation measure of the inflation-adjusted price divided by inflation-adjusted corporate profits. As with all the valuation measures we have discussed, with the P/CP (pretax) ratio at the second highest level in history, forward-return expectations should be lowered.
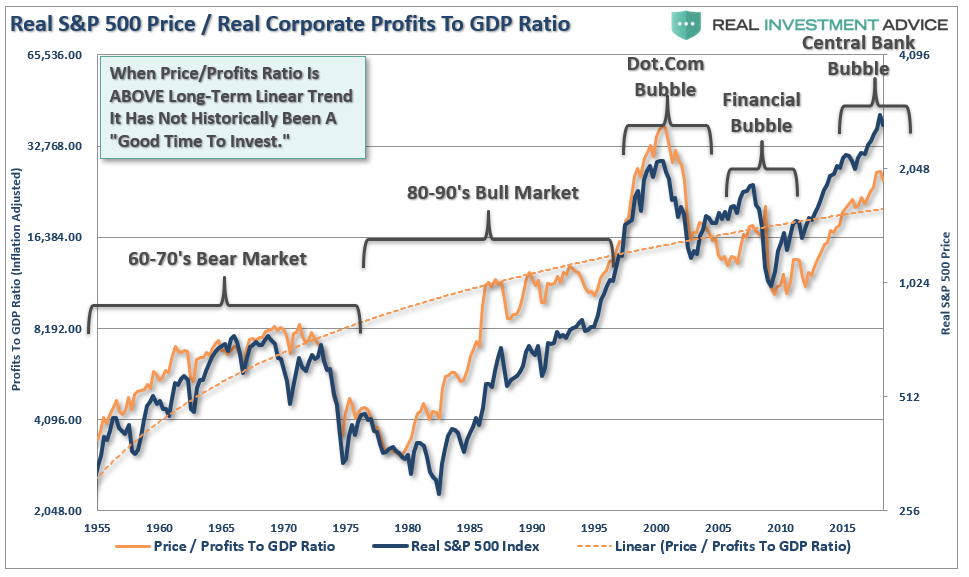
The reality, of course, is that investors are simply chasing asset prices higher as exuberance overtakes logic.
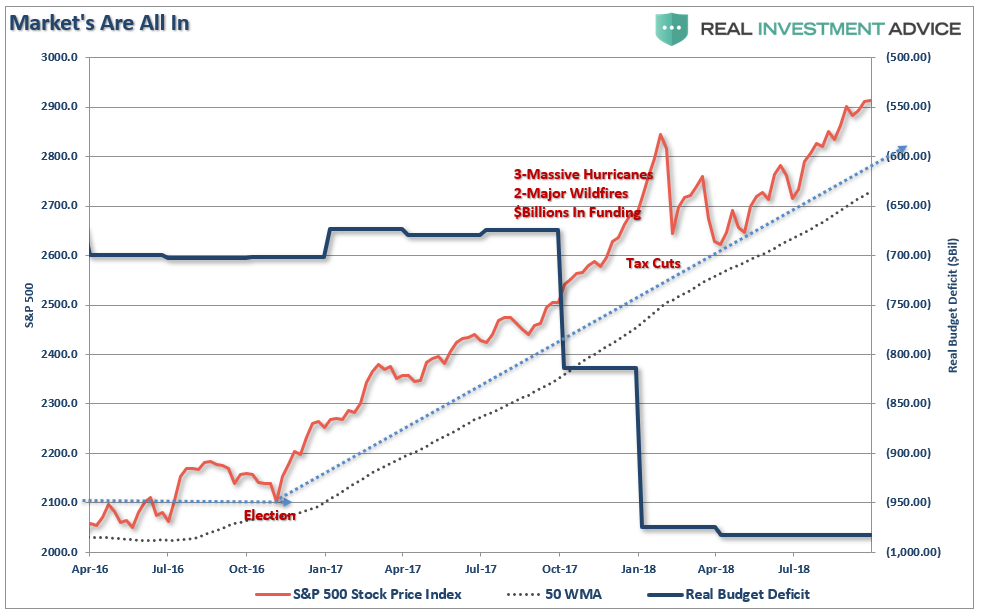
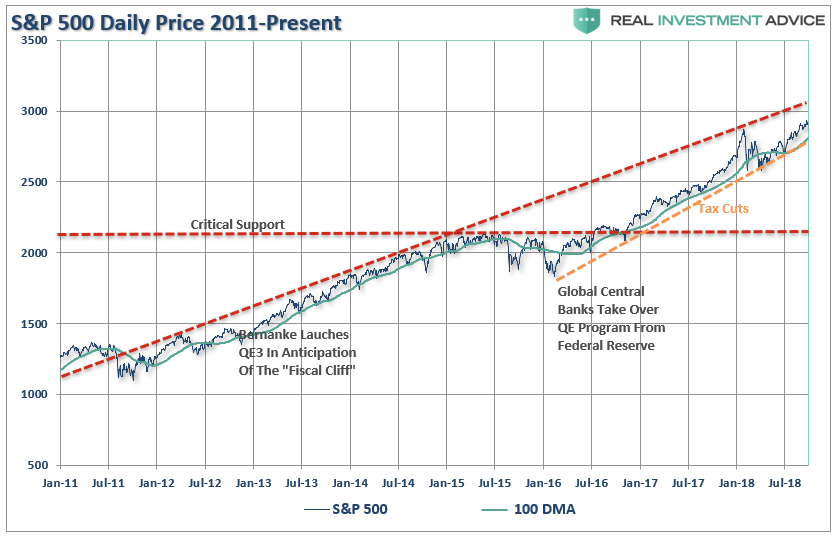
The second meme of “it’s all about tax cuts” is also not entirely accurate. The current rally, following the nearly 20% decline in early 2016 is actually an extension from the transition of “quantitative easing” from the Federal Reserve to the global Central Banks. What is clearly seen in the chart below is that as the Fed signaled the end of their QE program, and begin hiking interest rates, Global Central banks took the lead.
As I noted on Friday, that support from the major Central Banks is now reversing at a time where global economic growth has peaked and the fiscal support in the U.S. is fading.
A correction back to critical support, the 2015 peak, would entail a nearly 28% decline from current levels. More importantly, a decline of such magnitude will threaten to trigger “margin calls” which, as discussed previously, is the “time bomb” waiting to happen.
Here is the point. The “excuses” driving the rally are just that. Tax cuts and massive deficit spending by the government are fleeting supports. Given that tax reform didn’t lead to strong increases in real wage growth to support higher levels of consumption, the short-term boosts will begin to fade in the months ahead.
Importantly, on a quarterly basis, the market has pushed into the highest level of overbought conditions on record since 1999. The vertical red lines marked on the chart below show each previous peak which has correlated to a subsequent decline in the not terribly distant future.
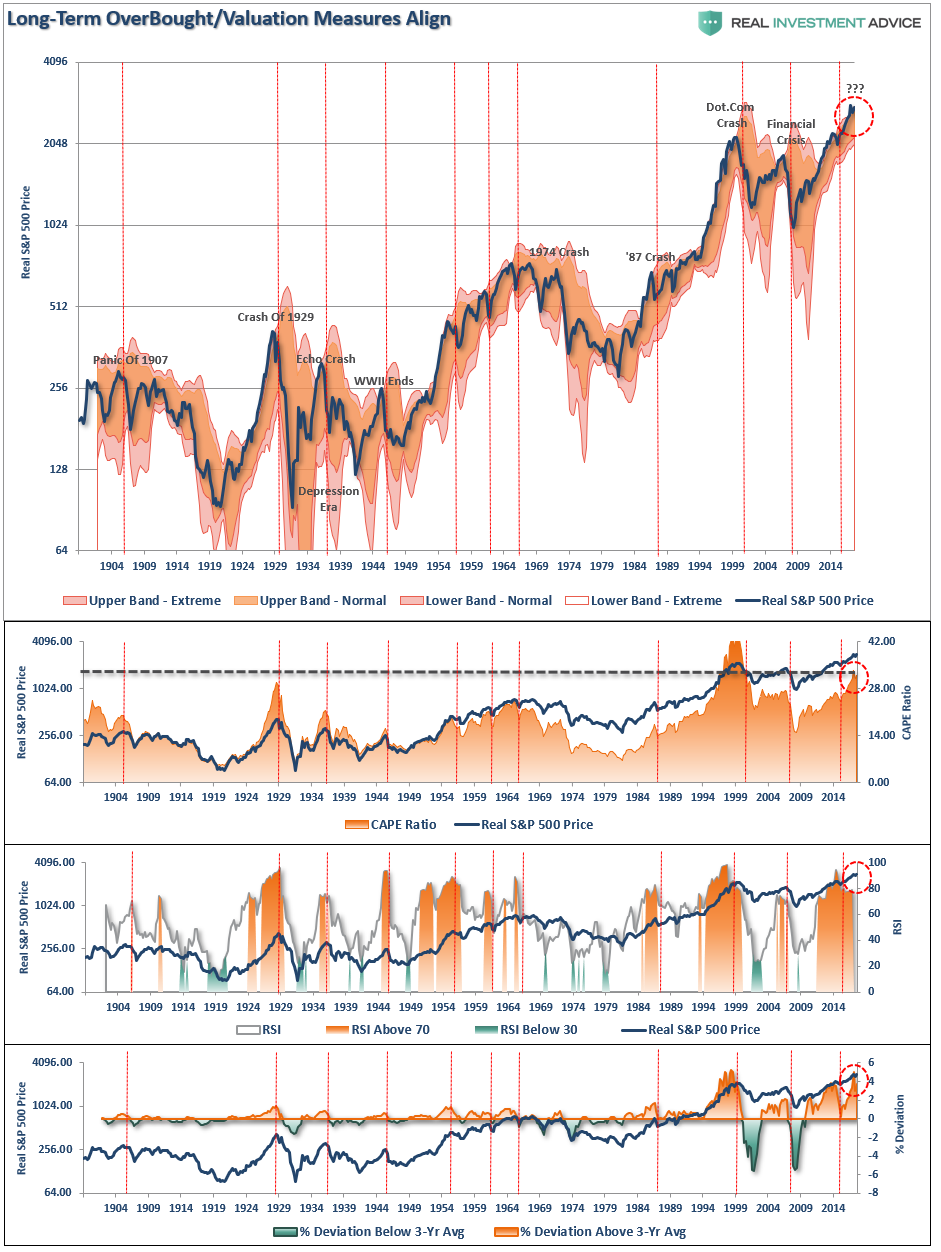
The problem for investors is not being able to tell whether the next correction will be just a “correction” within an ongoing bull market advance, or something materially worse. Unfortunately, by the time most investors figure it out – it is generally far too late to do anything meaningful about it.
As shown below, price deviations from the 50-week moving average has been important markers for the sustainability of an advance historically. Prices can only deviate so far from their underlying moving average before a reversion will eventually occur. (You can’t have an “average” unless price trades above and below the average during a given time frame.) Historically, “events” tend to occur when the deviation exceeds 100% from the long-term mean. Currently, that deviation is at 207%.
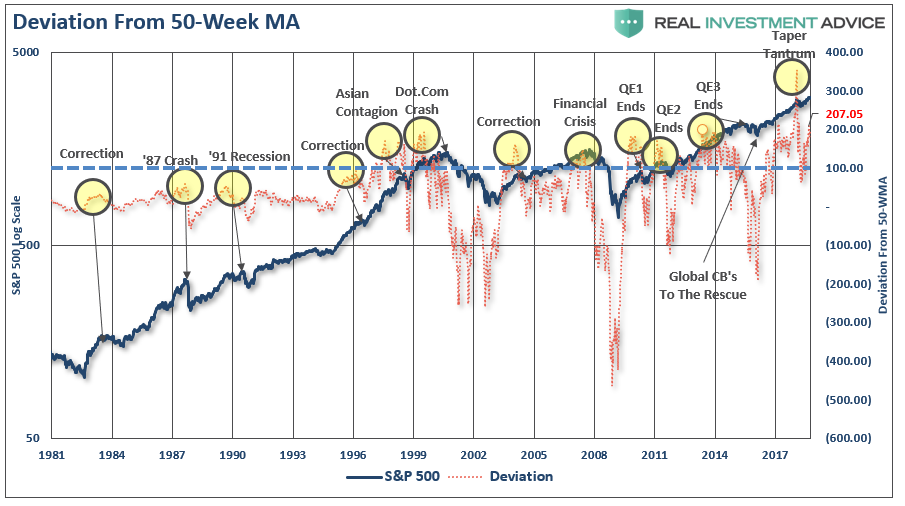
It is more than obvious that a correction will eventually come. The only question is just how big will it likely be?
Just how big could the next correction be?
As stated above, just a correction back to the initial “critical support” set at the 2015 highs would equate to roughly a 28% decline.
However, the risk, as noted above, is that a correction of that magnitude would begin to trigger margin calls, junk bond defaults, blow up the “VIX” short-carry, and trigger a wave of automated selling as the algorithms begin to sell in tandem. Such a combination of events could conceivably push markets to support at either the 2016 correction lows, or the 2007 market peak.
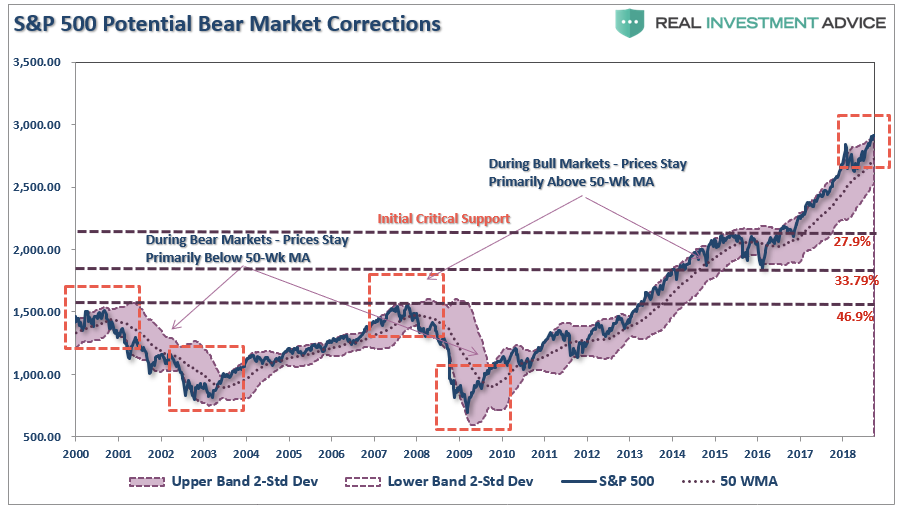
Such a correction would entail either a 34% or a 47% decline. Both would be detrimental to long-term financial planning goals.
That can’t happen you say?
It’s happened numerous times throughout history on far less buildups of leverage, debt, and investor “irrational exuberance.”
7-Impossible Trading Rules
As investors, we should always be mindful of the possibilities, but manage for the probabilities.
No one knows with certainty what the future holds which is why we must manage portfolio risk accordingly and be prepared to react when conditions change.
I am neither bullish or bearish. I follow a very simple set of rules which are the core of my portfolio management philosophy which focus on capital preservation and long-term “risk-adjusted” returns. As such, let me remind you of the 7-most difficult trading rules to follow:
1) Sell Losers Short: Let Winners Run:
It seems like a simple thing to do but when it comes down to it the average investor sells their winners and keeps their losers hoping they will come back to even.
2) Buy Cheap And Sell Expensive:
You haggle, negotiate and shop extensively for the best deals on cars and flat-screen televisions. However, you will pay any price for a stock because someone on television told you too. Insist on making investments when you are getting a “good deal” on it. If it isn’t – it isn’t. Don’t try and come up with an excuse to justify overpaying for an investment. In the long run – overpaying always reduces returns.
3) This Time Is Never Different:
As much as our emotions and psychological makeup want to always hope and pray for the best – this time is never different than the past. History may not repeat exactly but it surely rhymes awfully well.
4) Be Patient:
As with item number 2; there is never a rush to make an investment and there is NOTHING WRONG with sitting on cash until a good deal, a real bargain, comes along. Being patient is not only a virtue – it is a good way to keep yourself out of trouble.
5) Turn Off The Television:
Any good investment is NEVER dictated by day to day movements of the market which is merely nothing more than noise. If you have done your homework, made a good investment at a good price and have confirmed your analysis to correct – then the day to day market actions will have little, if any, bearing on the longer-term success of your investment. The only thing you achieve by watching the television from one minute to the next is increasing your blood pressure.
6) Risk Is Not Equal To Your Return:
Taking RISK in an investment or strategy is not equivalent to how much money you will make. It only relates to the permanent loss of capital that will be incurred when you are wrong. Invest conservatively and grow your money over time with the LEAST amount of risk possible.
7) Go Against The Herd:
The populous is generally right in the middle of a move up in the markets but they are seldom right at major turning points. When everyone agrees on the direction of the market due to any given set of reasons – generally something else happens. However, this also cedes to points 2) and 4); in order to buy something cheap or sell something at the best price – you are generally buying when everyone is selling and selling when everyone else is buying.
These are the rules. They are simple and impossible to follow for most. However, if you can incorporate them you will succeed in your investment goals in the long run. You most likely WILL NOT outperform the markets on the way up, but you will not lose as much on the way down. This is important because it is easy to replace a lost opportunity in investing – it is impossible to replace lost capital.
As an investor, it is simply your job to step away from your “emotions” for a moment and look objectively at the market around you. Is it currently dominated by “greed” or “fear?” Your long-term returns will depend greatly not only on how you answer that question, but how you manage the inherent risk.
Everyone approaches money management differently. This is just the way I do it.
All I am suggesting is that you do “something” rather than the alternative which has historically been much less beneficial to long-term financial goals. Because, eventually, the decline will come and investors will once again do exactly the opposite of what they should do.
They always do.
“The investor’s chief problem – and even his worst enemy – is likely to be himself.” – Benjamin Graham


Lance Roberts is a Chief Portfolio Strategist/Economist for RIA Advisors. He is also the host of “The Lance Roberts Podcast” and Chief Editor of the “Real Investment Advice” website and author of “Real Investment Daily” blog and “Real Investment Report“. Follow Lance on Facebook, Twitter, Linked-In and YouTube
Customer Relationship Summary (Form CRS)
Also Read


