


This past weekend, I asked if the decline in March was a bear market or just a big correction. The debate that ensued was polarizing, to say the least. However, defining the market using long-term analysis is essential in determining the current trend, potential outcomes, and portfolio assumptions.
The Recap
Let’s start with the analysis from “Was March A Bear Market?”
“Such brings up an interesting question. After a decade-long bull market, which stretched prices to extremes above long-term trends, is the 20% measure still valid?
To answer that question, let’s clarify the premise.
- A bull market is when the price of the market is trending higher over a long-term period.
- A bear market is when the previous advance breaks, and prices begin to trend lower.
The chart below provides a visual of the distinction. When you look at price “trends,” the difference becomes both apparent and useful.”

“This distinction is important.
- “Corrections” generally occur over very short time frames, do not break the prevailing trend in prices, and are quickly resolved by markets reversing to new highs.
- “Bear Markets” tend to be long-term affairs where prices grind sideways or lower over several months as valuations are reverted.
Using monthly closing data, the ‘correction’ in March was unusually swift but did not break the long-term bullish trend. Such suggests the bull market that began in 2009 is still intact as long as the monthly trend line holds.
However, I have noted the market may be in the process of a topping pattern. The 2018 and 2020 peaks are currently forming the “left shoulder” and “head” of the topping process. Such would also suggest the “neckline” is the running bull trend from the 2009 lows. A market peak without setting a new high that violates the bull trend line would define a “bear market.”

Defining Long-Term Market Cycles
That analysis brings up an interesting question.
What if the secular bull market that began in 1980 is still in process?
Before you adamantly deny this possibility, we need to consider the context of both long-term investor psychology cycles and valuations.
Let’s start with the following chart of investor psychology.
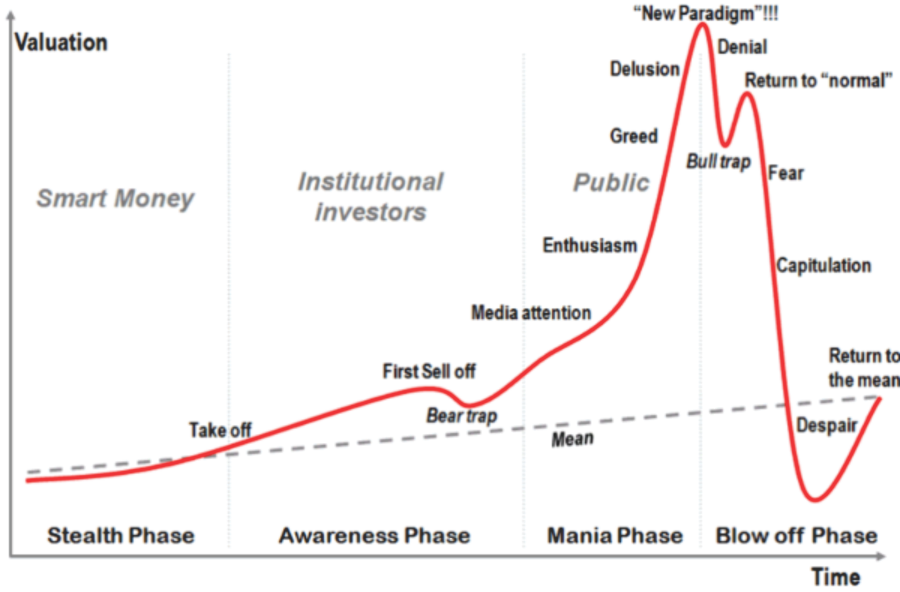
This chart is not new, and there are many variations similar to it, but do not dismiss the importance. Throughout history, individuals have repeatedly responded to market dynamics in the same fashion. At each delusional peak, it was always uttered, in some form or variation, “this time is different.”
Valuations Matter
I have often discussed the importance of full-market cycles.
“Long-term investment success depends more on the WHEN you start investing. Such is shown in the chart of valuation cycles.”
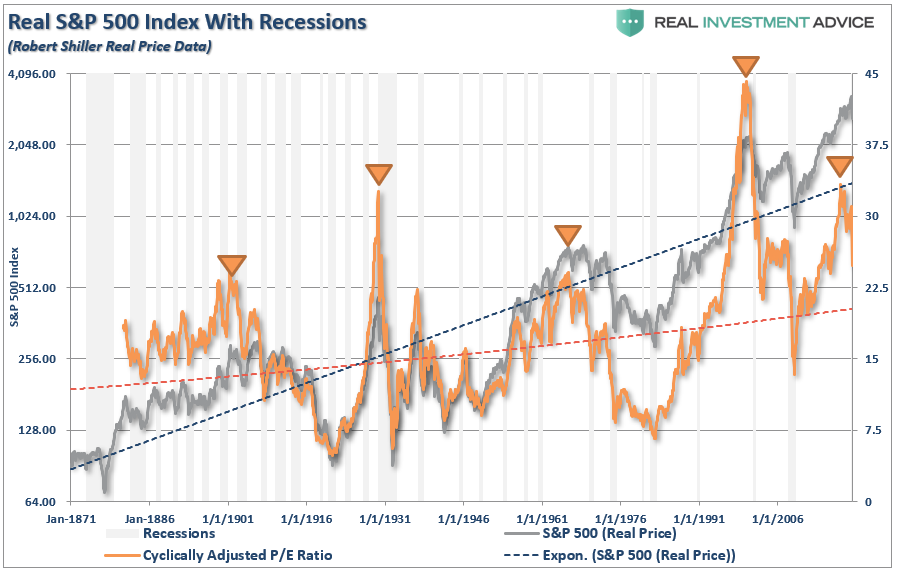
“Here is the critical point. The MAJORITY of the returns from investing came in just 4 of the 8-major market cycles since 1871. Every other period yielded a return that lost out to inflation during that time frame.”
However, by looking at each full-cycle period as two parts, bull and bear, it obscures the importance of the “full cycle.” What if instead of there being 8-cycles, we look at them as only three?
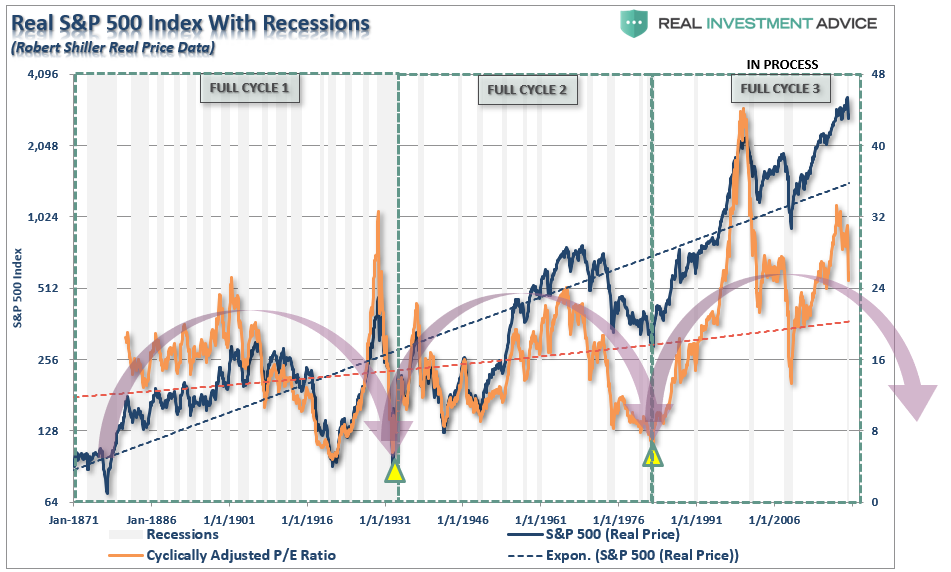
Note in the chart above that CAPE (cyclically adjusted P/E ratio) reverted well below the long-term trend in both prior full-market cycles. When viewed in this manner, we see the full-market cycle encompasses many bull and bear market cycles, but only completes when valuations are reset.
While valuations briefly dipped below the long-term trend in 2008-2009, they did not revert to previously low levels. Given valuations have remained elevated since 1982; it suggests the full-market cycle has yet to complete. Such a reversion would align the fundamental and psychological underpinnings seen at the beginning of the last two full-market cycles.

Long-Term Analysis – Is The 80’s Bull Still Running?
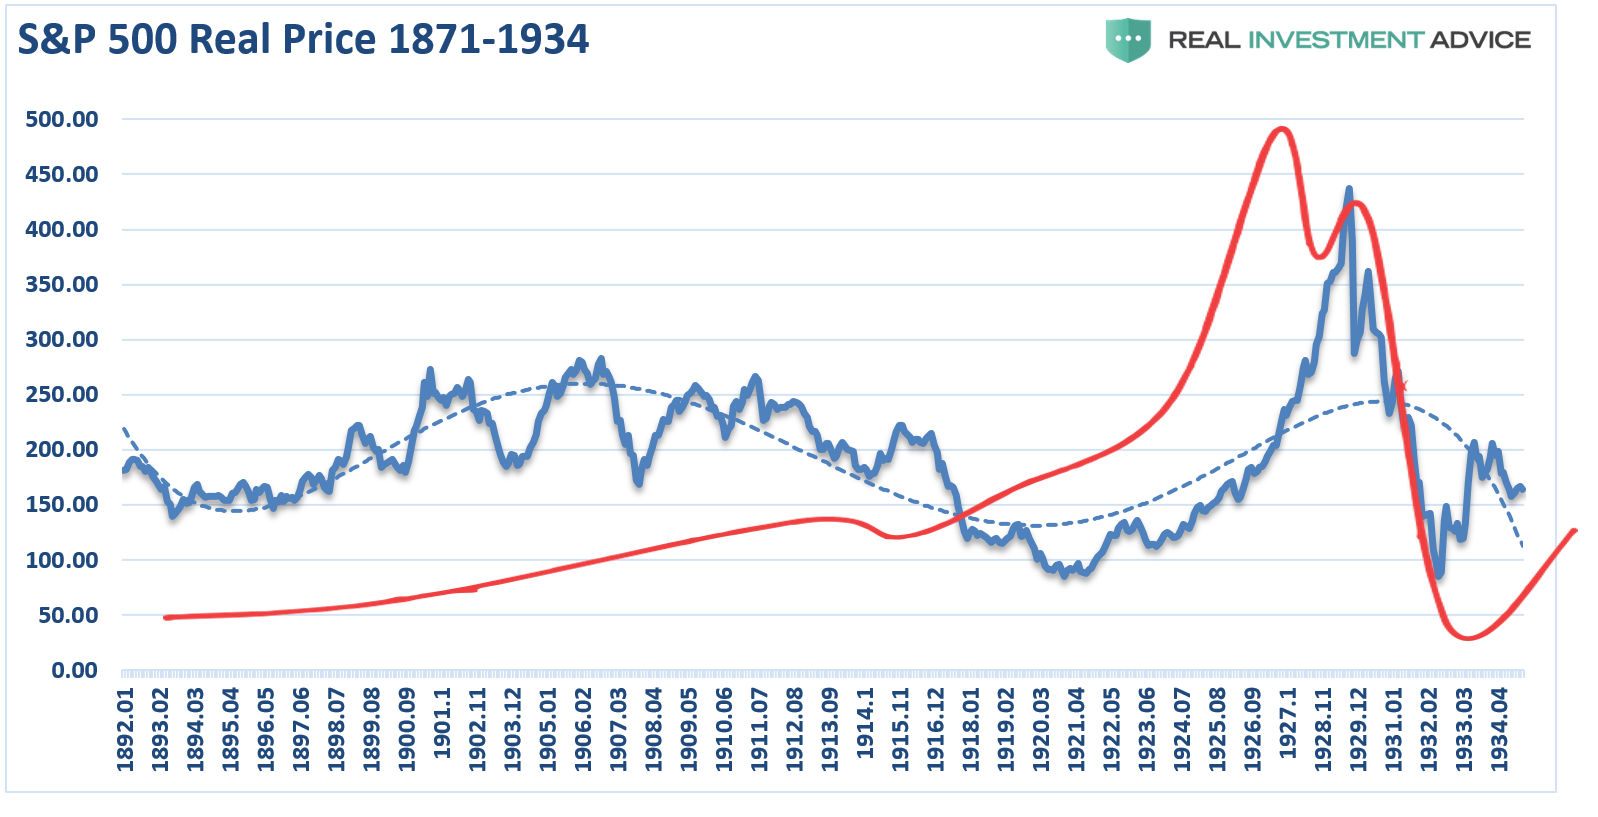
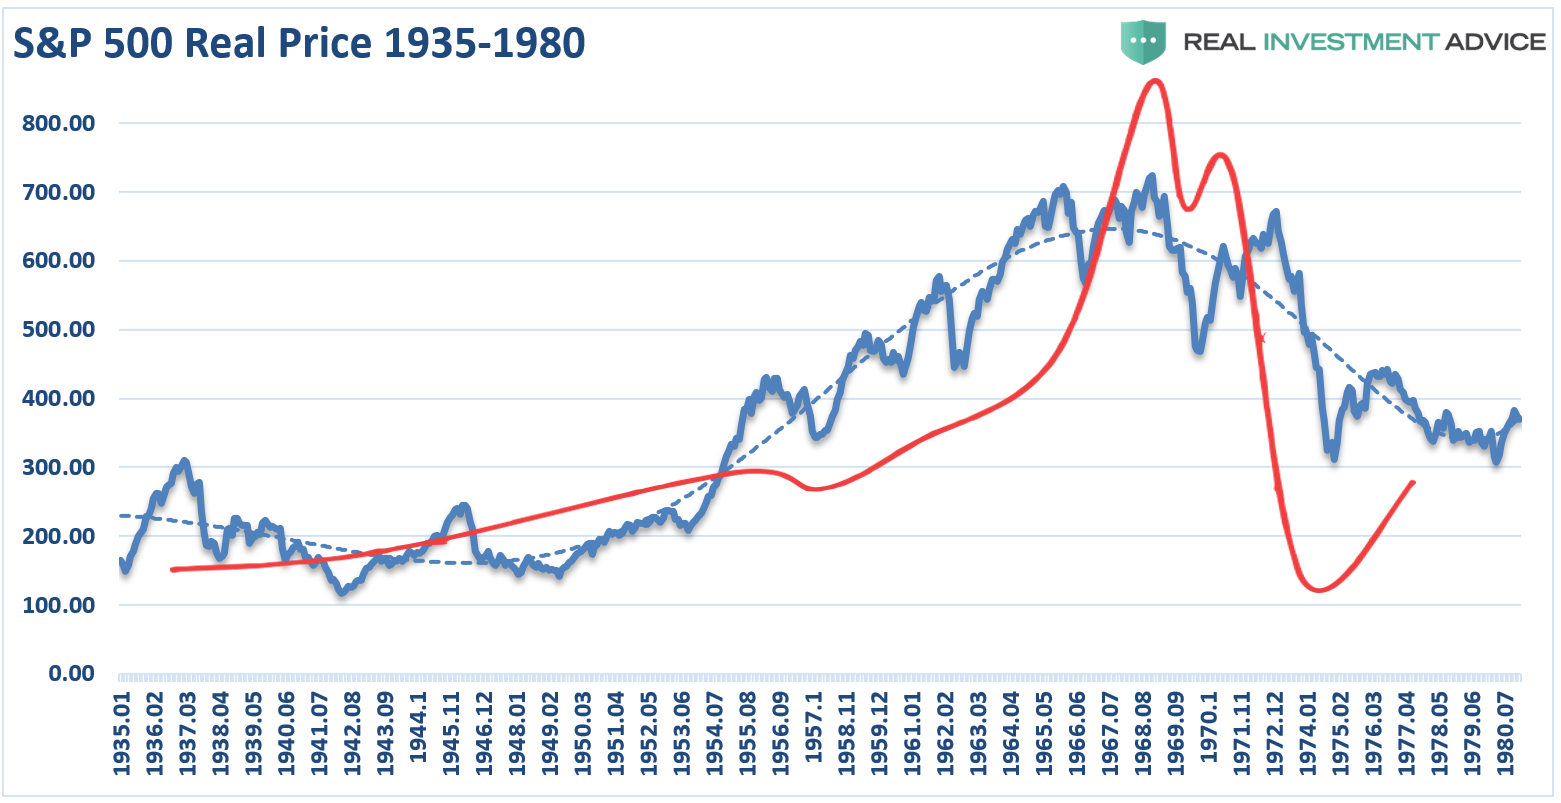
We can further examine the idea of long-term market cycles if we overly the psychological and time-frame analysis. The first full-market cycle lasted 63-years from 1871 through 1934. This period ended with the crash of 1929 and the beginning of the “Great Depression.”
The second full-market cycle lasted 45-years from 1935-1980. This cycle ended with the demise of the “Nifty-Fifty” stocks and the “Black Bear Market” of 1974. While not as economically devastating as the 1929-crash, it did greatly impair the investment psychology of those in the market.
The Running Bull Market
The current full-market cycle is only 38-years in the making. Here is a short-list of what prices are pushing up against:
- Elevated valuations
- Collapsing economic data
- Declining earnings and corporate profitability
- Weak economic growth
- Surging debt levels
- Deflationary economic pressures
- Suppressed wage growth
- Weakening demand from consumption
Even this short-list of headwinds makes it worth questioning whether the current full-market cycle has completed. Such is particularly the case when Central Banks are required to maintain ever-increasing levels of monetary interventions to keep financial markets functioning.
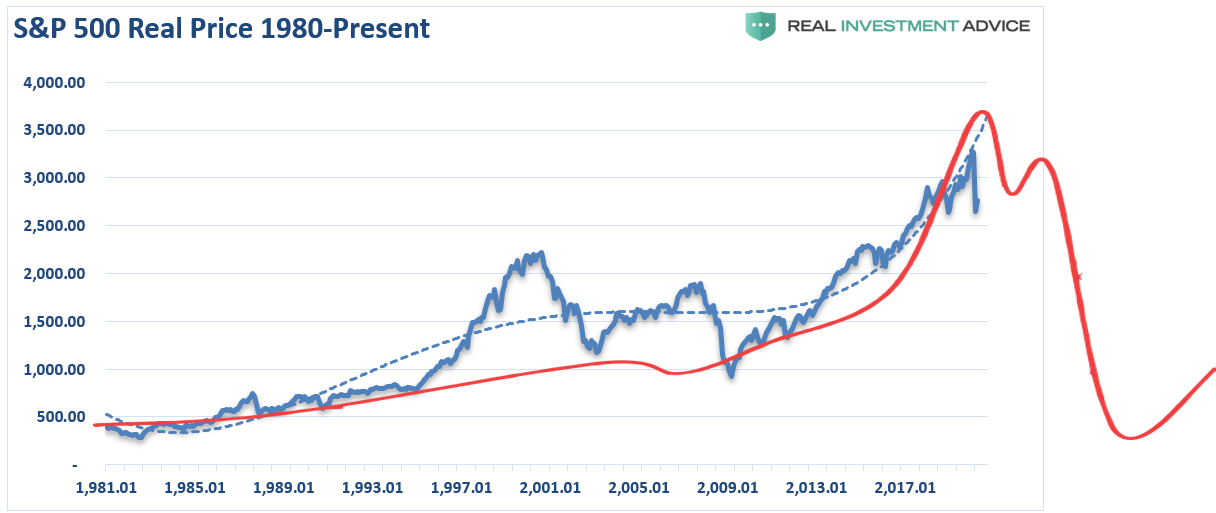
The idea of the “bull market,” which begin in 1980, is still intact is not a new one. As shown below, a chart of the market from 1980 to the present suggests the same.
The long-term bullish trend line remains, and the cycle-oscillator is only half-way through a long-term cycle. Furthermore, by the time the market resolves itself, a 61.8% retracement would reset markets back to the 1999 levels. Such is based only on the assumption that the long-term full market cycle has not yet completed.
I am NOT suggesting this is the case.
Instead, this is a thought-experiment about the potential outcome from the collision of weak economics, high levels of debt, valuations, and investor’s “irrational exuberance.”
Yes, this time could entirely be different.
It just never has been before.

Using Long-Term Analysis To Measure Potential Outcomes
Regardless of whether you agree with the premise, do not completely dismiss the importance of long-term price cycles. Currently, it is “in vogue” to believe it is only monetary policy driving markets now. Over the long-term, there have been many excuses for rising prices, which eventually gave way to “fundamental gravity.”
One of the most interesting emails I received in response to my monthly analysis above was from Jim Colquitt, President of Armor Index, Inc. To wit:
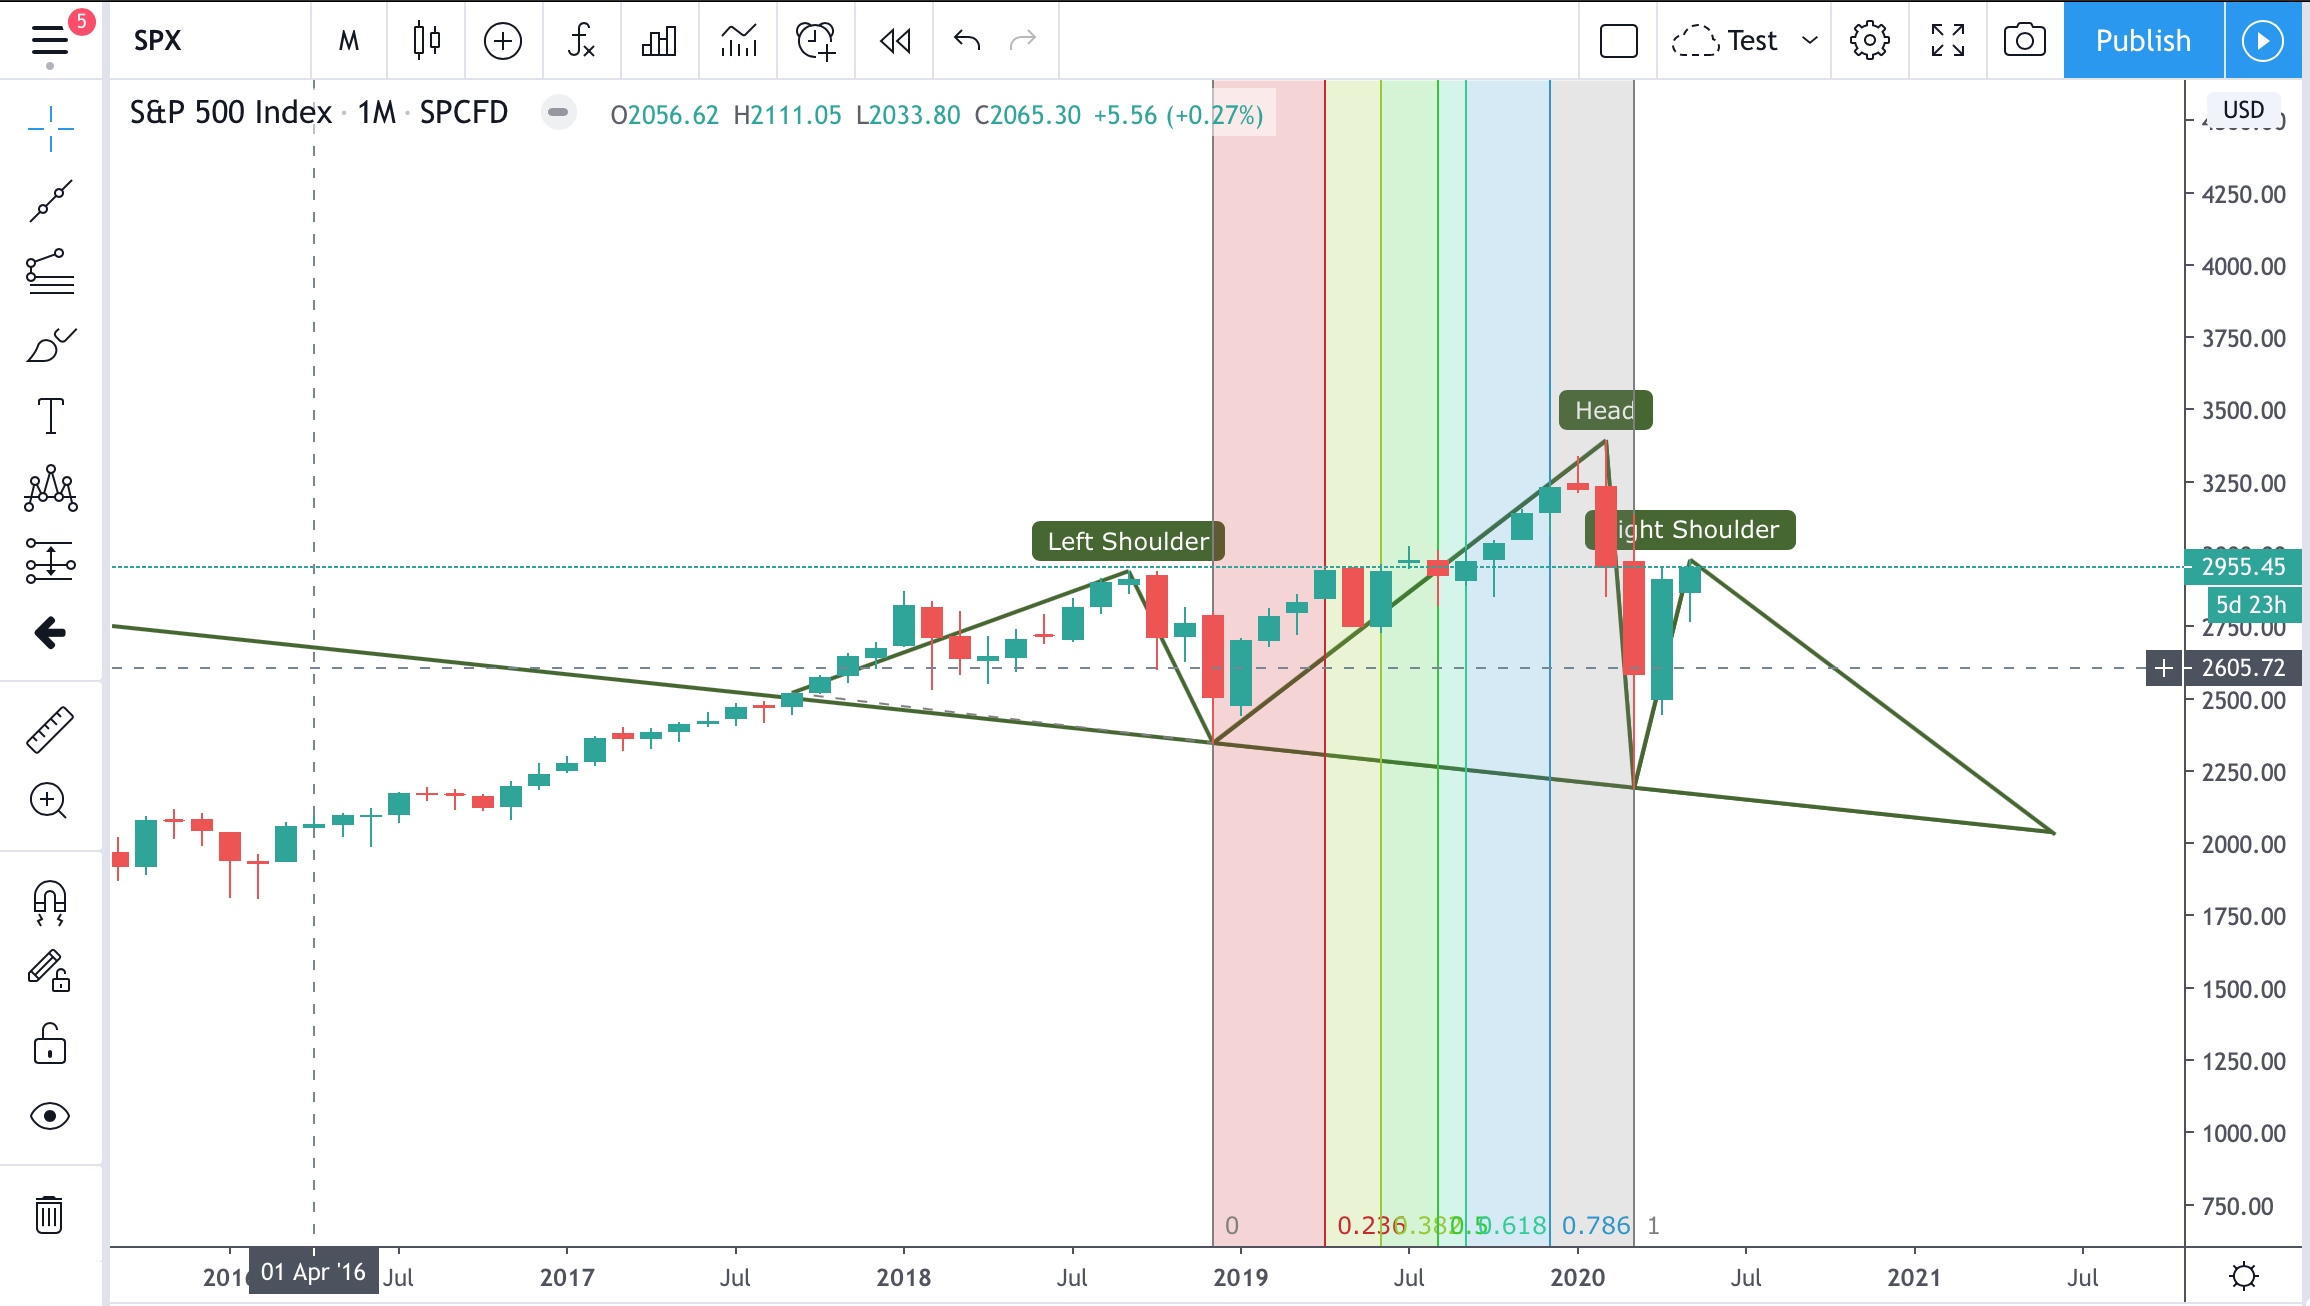
“If we draw the ‘Head & Shoulders’ pattern you described above, we find an interesting symmetry. The distance from the beginning of the left shoulder (September 2017) to the end of the left shoulder (December 2018), is the same distance (15 months) from the end of the left shoulder to the end of the head (March 2020).
If we assume this symmetry remains intact, it will allow us to complete the right shoulder of the head and shoulder pattern 15 months later in June 2021. Such would be somewhere in the price range of ~2,030 or roughly ~31% lower than current levels.”
Where Do We Go From Here
What does this analysis suggest if the market breaks below the neckline? Or, what if markets bounce off of the neckline as support?.
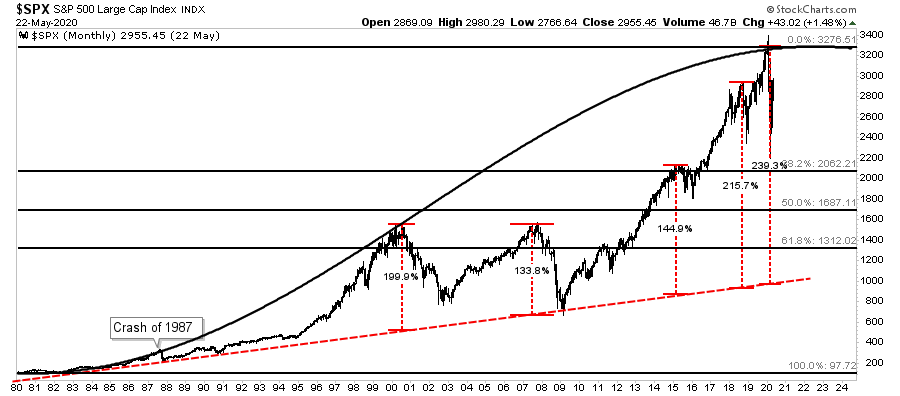
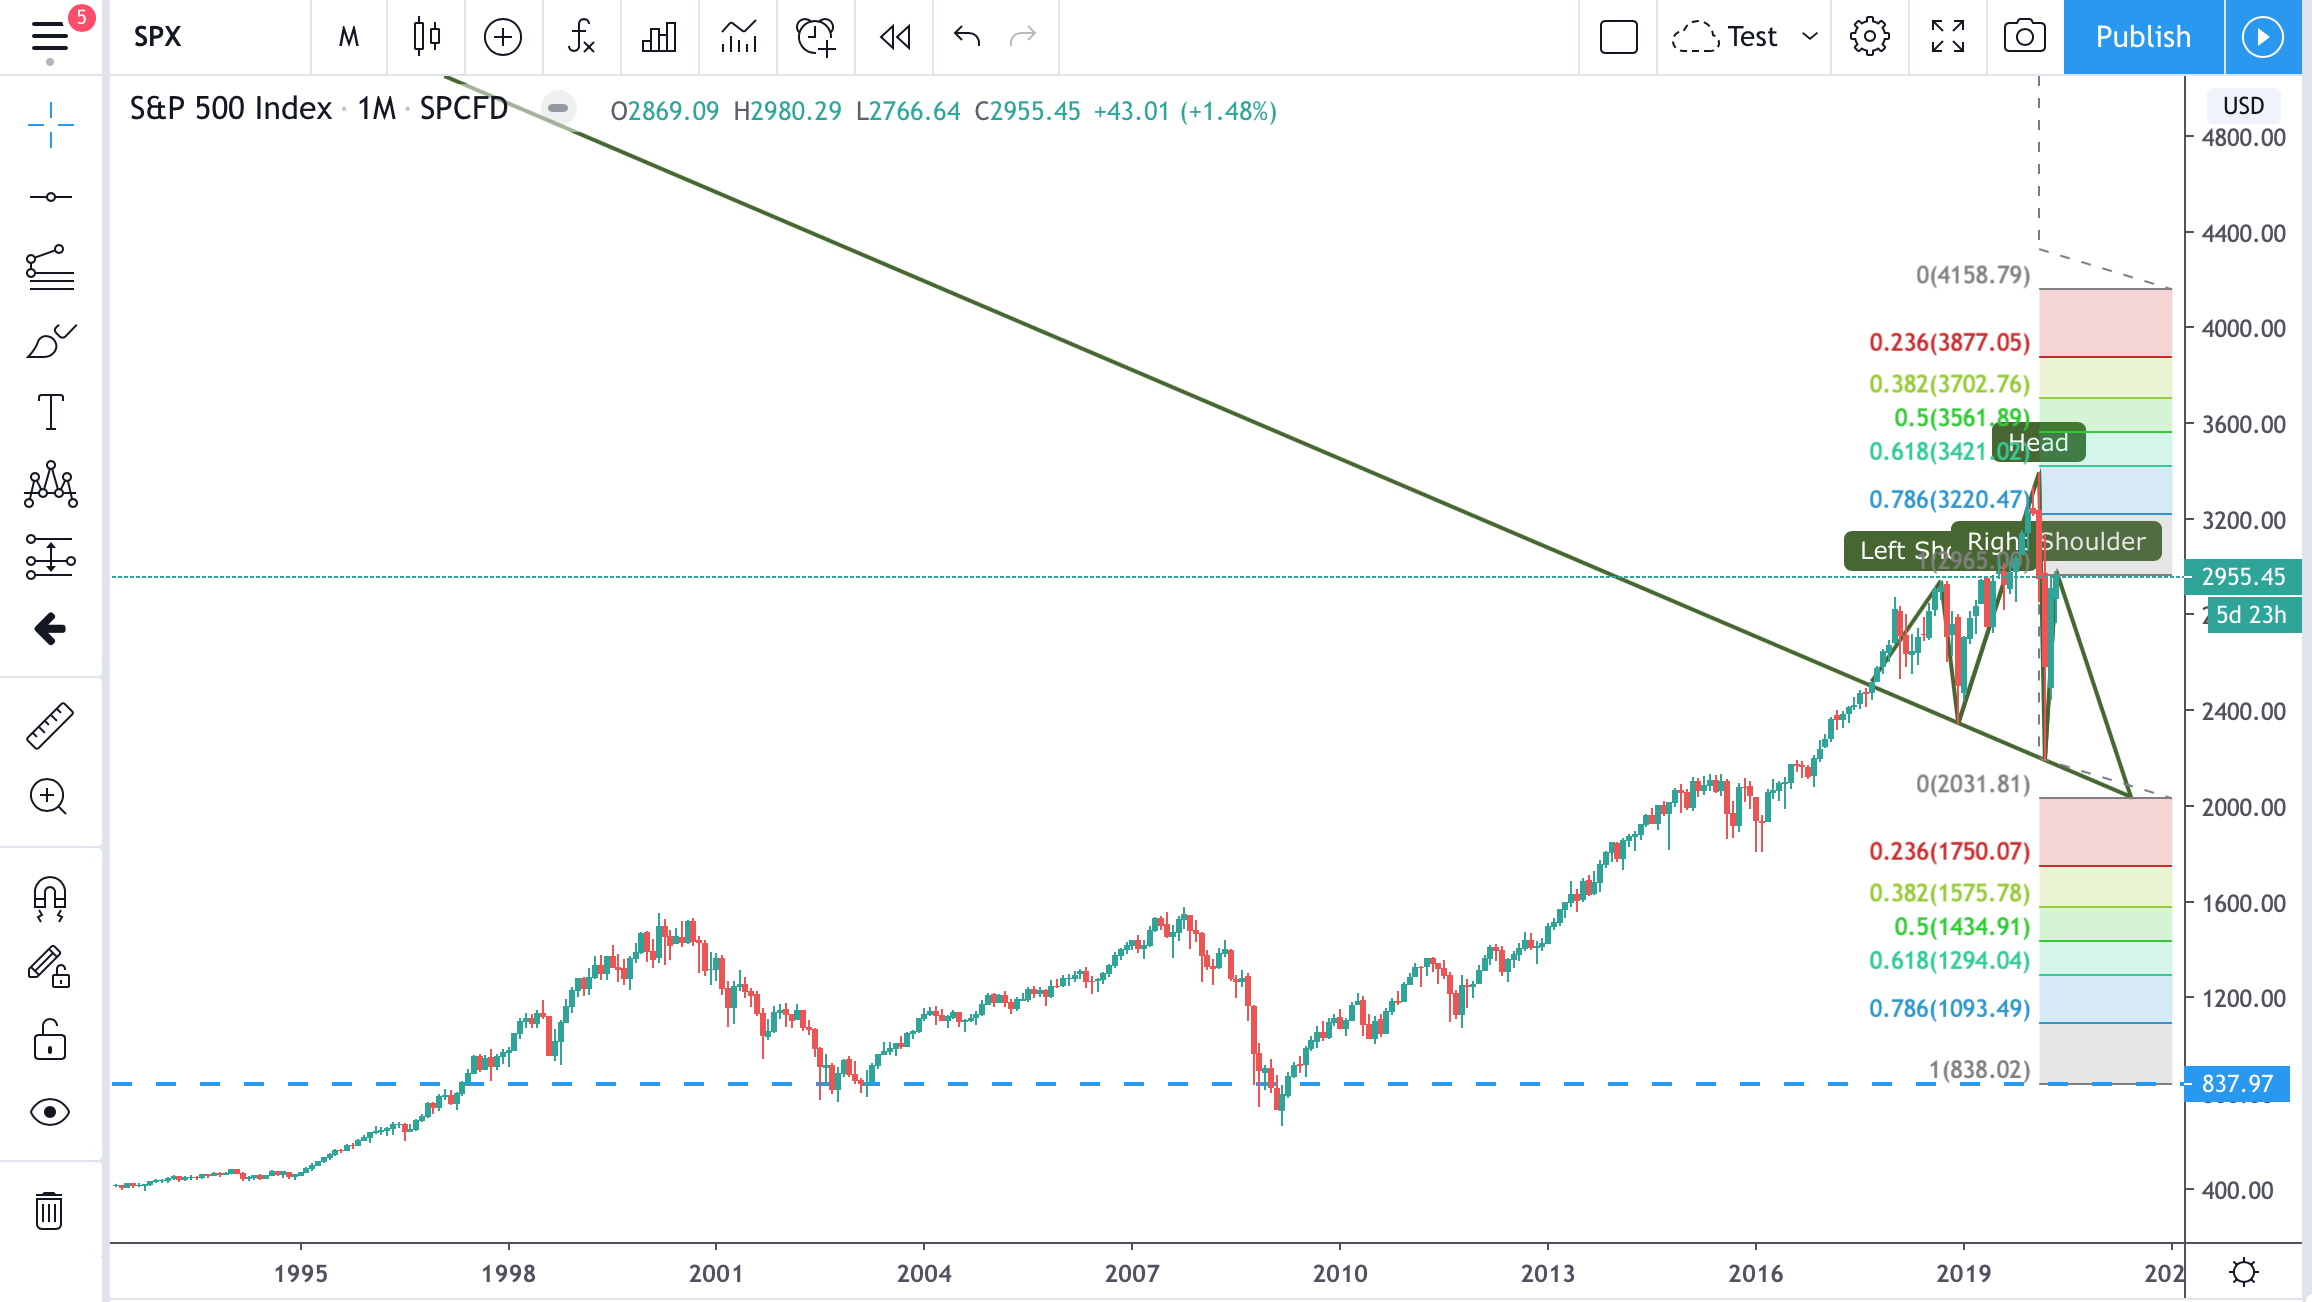
‘Head & Shoulder’ pattern theory suggests a move to the downside would put the target price at the equivalent of the distance from the head to the neckline as measured from the neckline. A break would equate to roughly ~840 on the index, or ~72% lower than current levels (see “Chart 2”).
Conversely, if the neckline is rejected, pattern theory suggests the distance above is used but is added to the top of the right shoulder. Such would equate to an index level of roughly ~4,160 or ~41% higher than current levels (see “Chart 2”). However, such a rise would likely come after testing the neckline (~2,030) and would equate to more than a 100% return from that point.
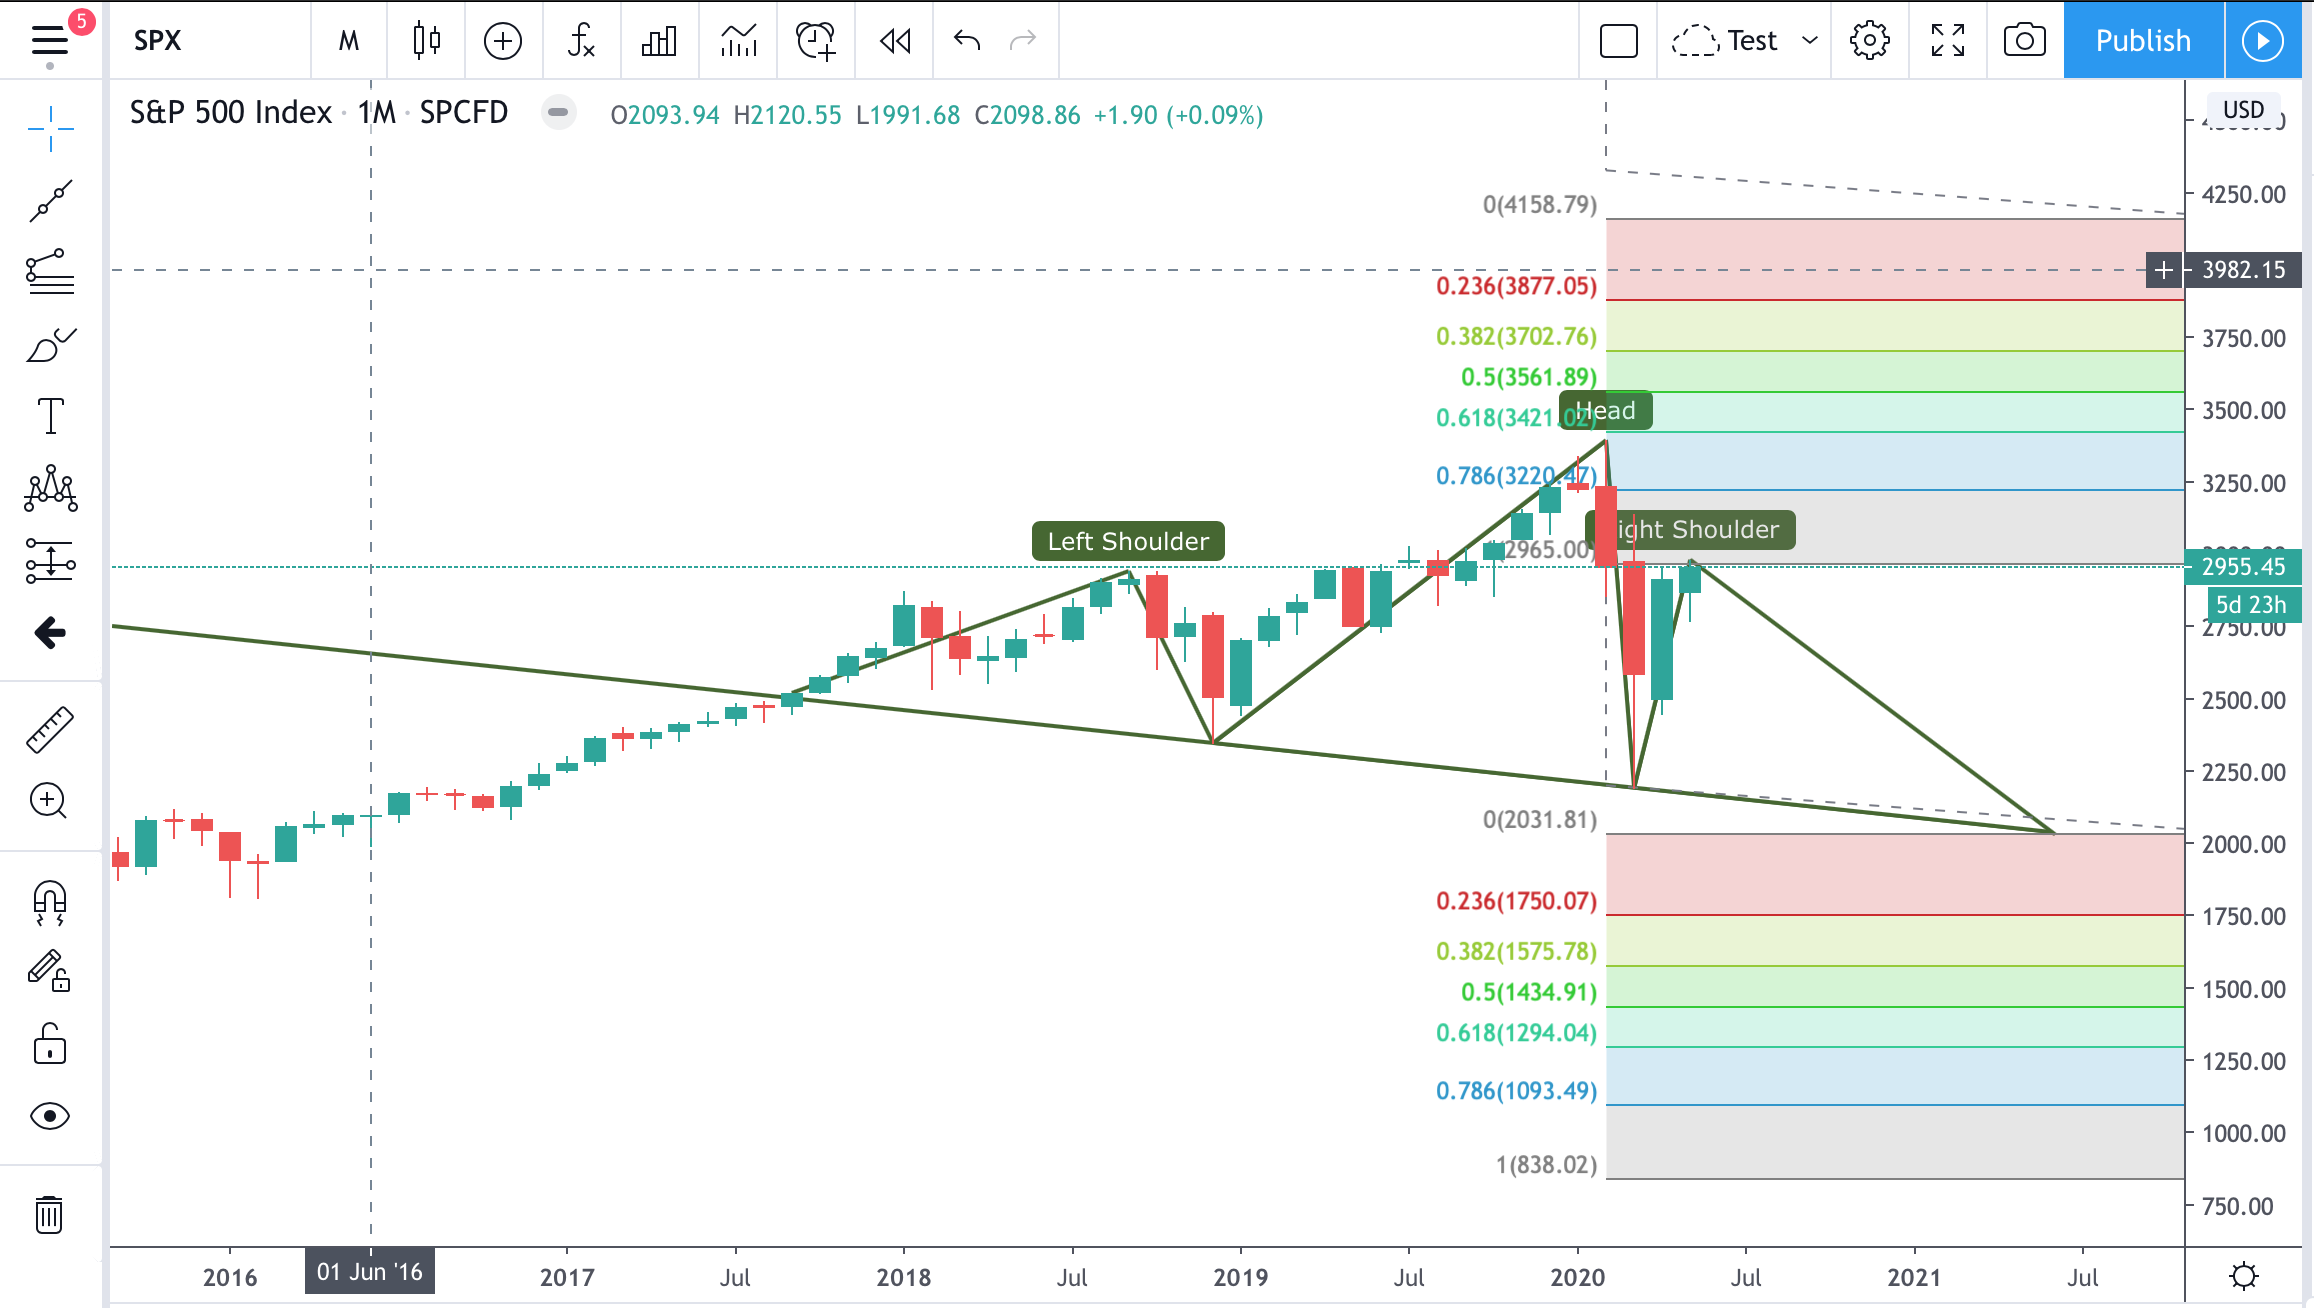
It is also interesting that current market levels are almost perfectly in line with the left shoulder peak in September 2018, the resistance/support levels from April through July 2019, and February through April 2020. Such could be the top for the right shoulder.
Should we test the lows of the worst case scenario, pattern theory puts the target range at levels, which are almost perfectly in line with the lows of the 2002 and 2008 recessions (see “Chart 3”).
Jim is correct in the analysis. We certainly hope markets don’t revisit the lows of the previous two bear-markets. For investors that is the worse possible outcome. However, such an outcome does have historical precedents within the context of completing a full-market cycle.
Conclusion
There is a sizable contingent of investors, and advisors, today who have never been through a real bear market. After a decade long bull-market cycle, fueled by Central Bank liquidity, it is understandable why mainstream analysis believe markets can only go higher.
Bear market cycles rarely end in a single month. There is much “hope” the Fed’s flood of liquidity can arrest the market decline. However, there is still a tremendous amount of economic damage to contend with over the months to come.
When analyzing the markets using monthly data, it certainly appears as if the long-term bull market that began in 1980 remains intact currently. However, we have roughly a decade of potentially hard times ahead of us if we are early in the process of completing the second half of the full-market cycle.
If you are a short-term market trader, this analysis likely has little importance to you. It also doesn’t mean market returns over the next decade are negative every single year. What it does suggest is that investors will face increased volatility and low average rates of return.
For most investors, a “buy and hold” investment strategy will likely leave you far short of your goals.
That is just what this particular set of analysis suggests. There is an unlimited number of potential outcomes that can occur over the next decade. Some of them good, some of them bad. Such is why it is important to measure the amount of risk being taken to achieve financial goals and manage that risk accordingly.
Or, you can disregard the analysis entirely and continue hoping for the best.
However, if investing worked as the media tells you, then why, after three major bull markets in the last 30-years, are 80% of Americans still broke?


Lance Roberts is a Chief Portfolio Strategist/Economist for RIA Advisors. He is also the host of “The Lance Roberts Podcast” and Chief Editor of the “Real Investment Advice” website and author of “Real Investment Daily” blog and “Real Investment Report“. Follow Lance on Facebook, Twitter, Linked-In and YouTube
Customer Relationship Summary (Form CRS)
Also Read


