This report will now be released on Mondays so we can capture the full trading week (Monday through Friday).
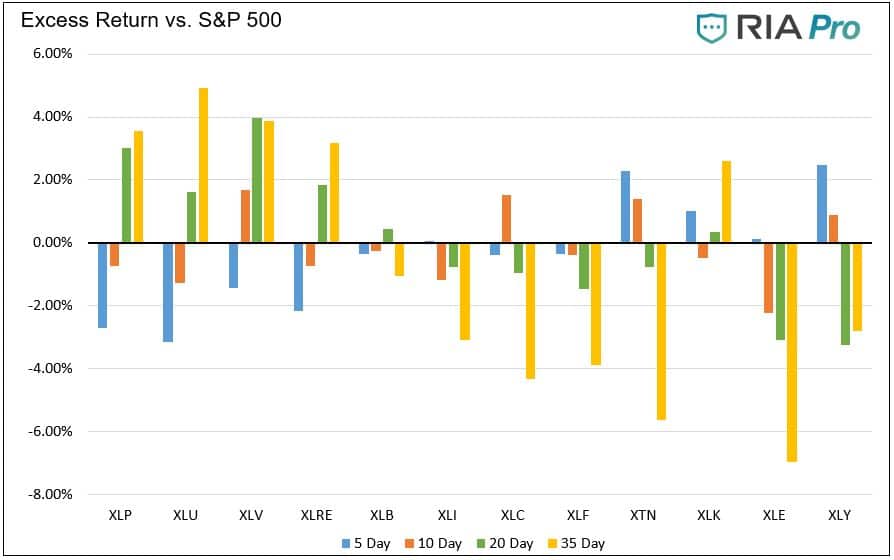
Relative Value Graphs
- The S&P 500 is 2.3% higher versus last Friday, as the index saw four days of buying following a gap down to begin the week. Relative performance was a mixed bag with technology, health care, and real estate remaining in overbought territory. Meanwhile, typical inflationary sectors fell further into oversold territory versus the index.
- Technology progressed further into overbought territory as it’s looking like a favorite pick for a potential Santa Claus rally through year-end. Large cap technology is the most overbought factor, while momentum gained relative to the index remains in oversold territory.
- Conversely, defensive sectors, including staples and utilities, slipped to neutral from well into overbought territory. The significant moves on a relative basis highlight the market’s volatility as year-end posturing occurs.
- In the upper right corner in the first graph, note the inflation vs. deflation index moved into neutral territory from being well oversold. Finally, TLT moved into neutral territory versus IEI after the yield curve steepened slightly last week.
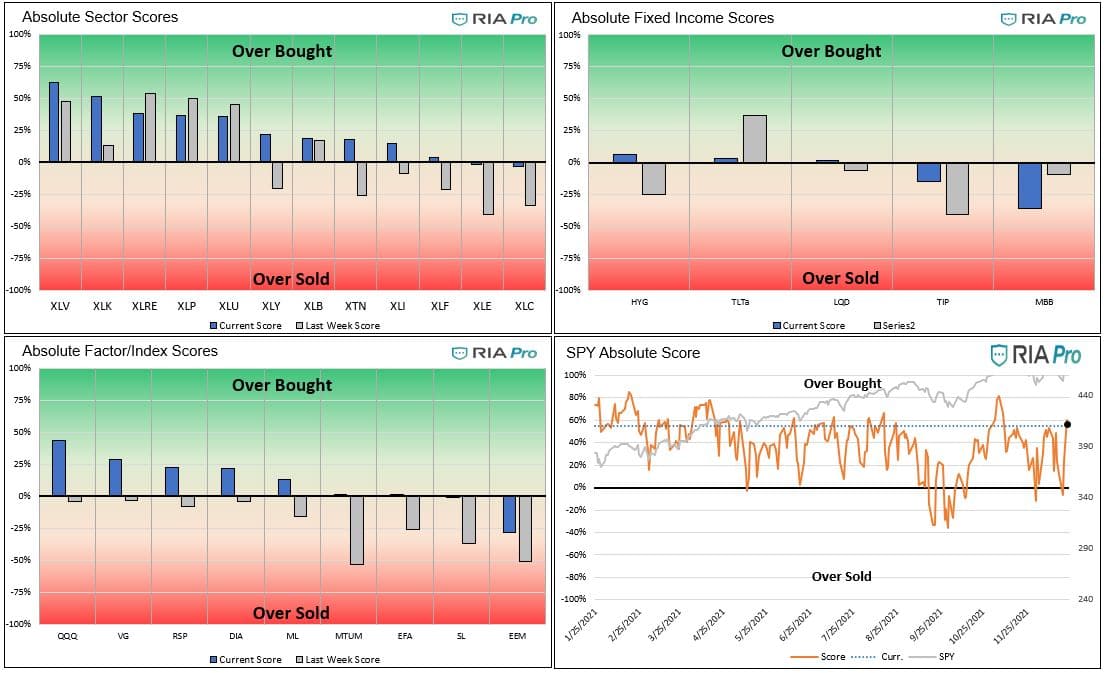
Absolute Value Graphs
- Contrary to the relative value graphs, most sectors are sitting in overbought territory on an absolute basis. The health care and technology sectors moved further into overbought territory on the back of strong buying activity. Although it’s sitting in neutral territory after a sharp improvement last week, XLC is the most oversold sector on an absolute basis.
- In addition, real estate, staples, and utilities saw relief from overbought conditions, while inflationary sectors were generally lifted out of oversold conditions.
- TIP saw some relief from oversold territory, while TLT moved to fair value from moderately overbought- reflecting a slight increase in the 10Y Treasury yield.
- Large cap technology and value vs. growth both pushed into overbought territory. Momentum, mid caps, and small caps saw sharp improvements to remain near neutral levels.
- The S&P 500 remains slightly overbought on an absolute basis after the recent bouts of volatility.
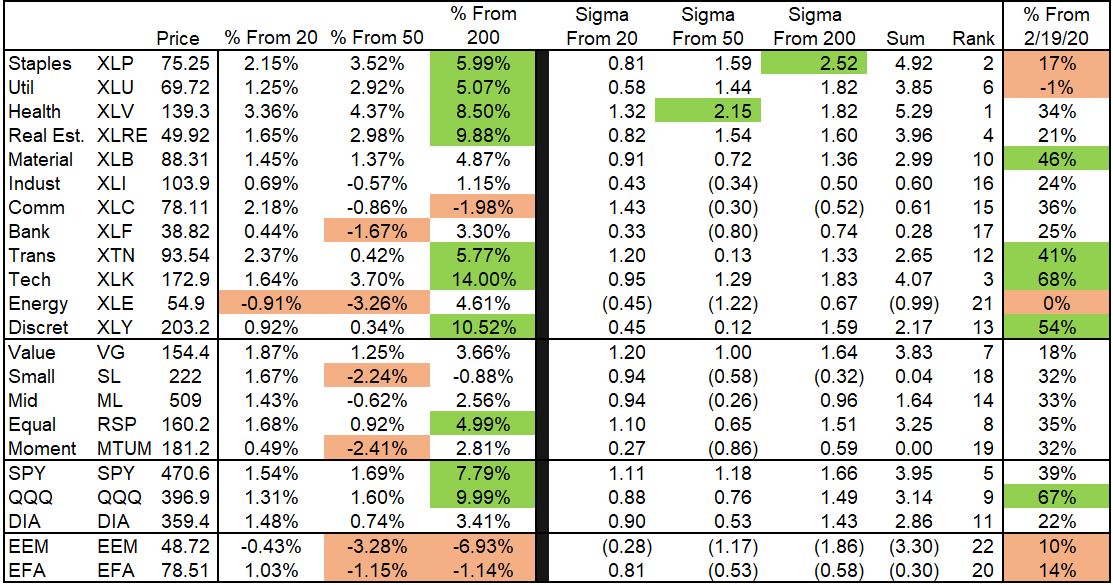
- As shown in the fourth graph, all sectors besides communications remain above their 200dma, with staples extended over two standard deviations above. Health care is over two standard deviations above its 50dma, while no sector is overly extended to the downside across any period.

Users Guide
The technical value scorecard report is one of many tools we use to manage our portfolios. This report may send a strong buy or sell signal, but we may not take action if other research and models do not affirm it.
The score is a percentage of the maximum score based on a series of weighted technical indicators for the last 200 trading days. Assets with scores over or under +/-70% are likely to either consolidate or change the trend. When the scatter plot in the sector graphs has an R-squared greater than .60, the signals are more reliable.
The first set of four graphs below are relative value-based, meaning the technical analysis is based on the ratio of the asset to its benchmark. The second set of graphs is computed solely on the price of the asset. At times we present “Sector spaghetti graphs,” which compare momentum and our score over time to provide further current and historical indications of strength or weakness. The square at the end of each squiggle is the current reading. The top right corner is the most bullish, while the bottom left corner is the most bearish.
The ETFs used in the model are as follows:
- Staples XLP
- Utilities XLU
- Health Care XLV
- Real Estate XLRE
- Materials XLB
- Industrials XLI
- Communications XLC
- Banking XLF
- Transportation XTN
- Energy XLE
- Discretionary XLY
- S&P 500 SPY
- Value IVE
- Growth IVW
- Small Cap SLY
- Mid Cap MDY
- Momentum MTUM
- Equal Weighted S&P 500 RSP
- NASDAQ QQQ
- Dow Jones DIA
- Emerg. Markets EEM
- Foreign Markets EFA
- IG Corp Bonds LQD
- High Yield Bonds HYG
- Long Tsy Bonds TLT
- Med Term Tsy IEI
- Mortgages MBB
- Inflation TIP
- Inflation Index- XLB, XLE, XLF, and Value (IVE)
- Deflation Index- XLP, XLU, XLK, and Growth (IWE)


Michael Lebowitz, CFA is an Investment Analyst and Portfolio Manager for RIA Advisors. specializing in macroeconomic research, valuations, asset allocation, and risk management. RIA Contributing Editor and Research Director. CFA is an Investment Analyst and Portfolio Manager; Co-founder of 720 Global Research.
Follow Michael on Twitter or go to 720global.com for more research and analysis.
Customer Relationship Summary (Form CRS)
Also Read