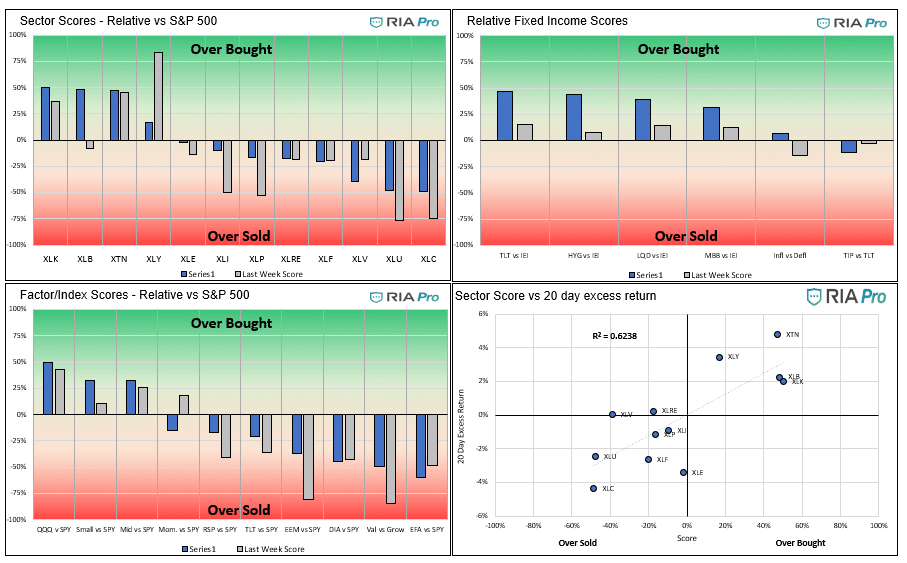
Relative Value Graphs
- The consumer discretionary sector lost 2.9% versus the S&P 500 after beating it by a similar amount in the prior week. As a result, its relative score fell quickly from grossly overbought to near fair value.
- Communications and utilities remain the most relatively oversold sectors, but their respective scores improved this week. After underperforming other inflationary stocks for a month or even longer, materials had a good week, beating the S&P 500 by nearly 3%.
- In a trend reversal from the prior few weeks, the S&P underperformed almost all sectors.
- Emerging markets and value (versus growth) had a good week, following very oversold readings. Interestingly emerging markets beat the S&P by 2.86%, yet developed foreign markets lost 0.07% to the S&P 500.
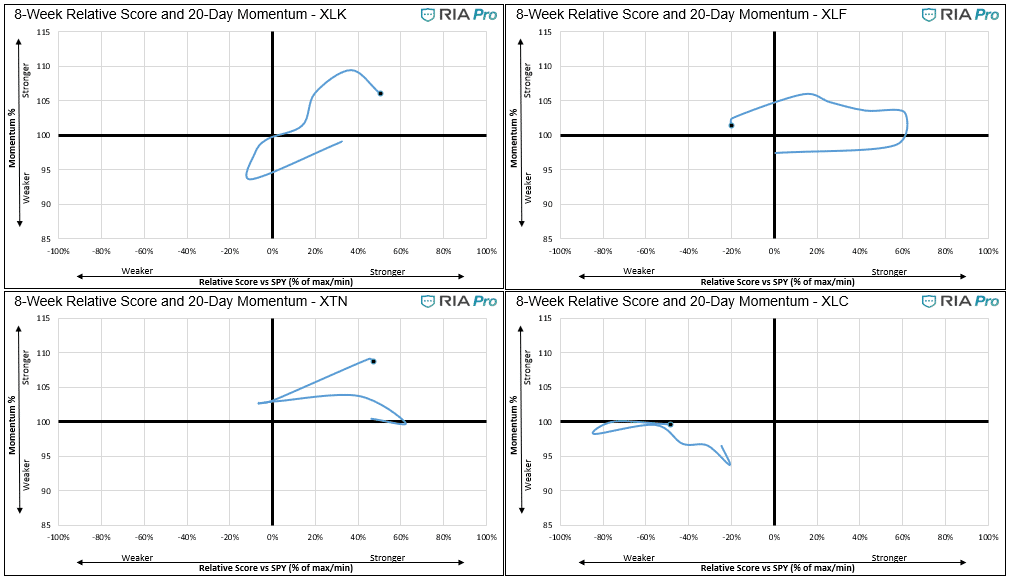
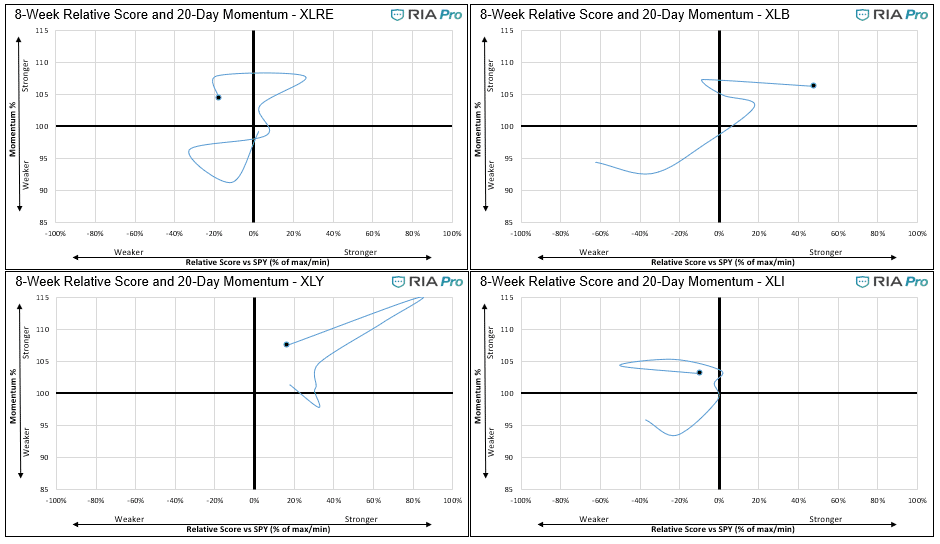
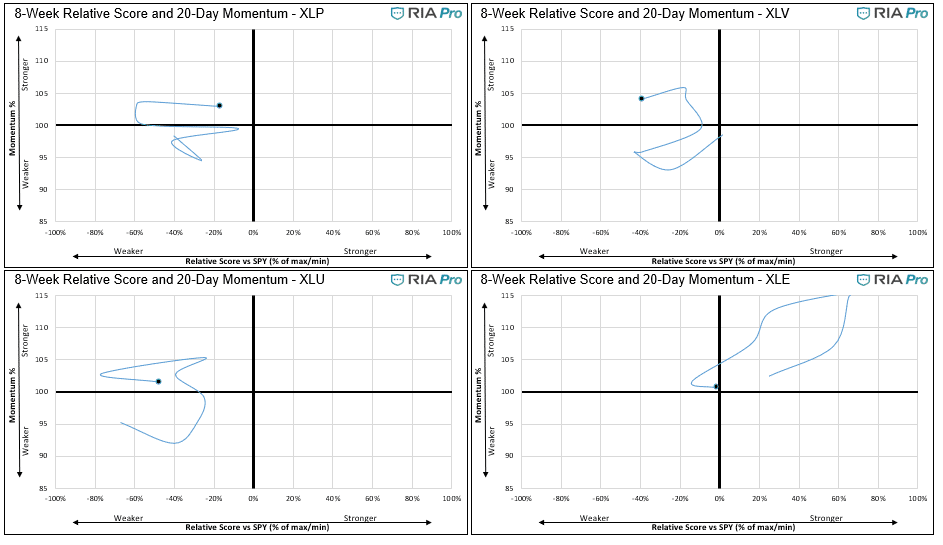
- The three sets of “spaghetti” graphs below show each sector’s path over the last eight weeks. The charts compare each sector’s absolute momentum to their relative score versus the S&P 500. We look for sectors moving into the top-right quadrant. Materials (XLB), for instance, just moved into the quadrant, potentially offering more upside. Discretionary (XLY) remains in the top-right quadrant but well off its extreme levels of last week.
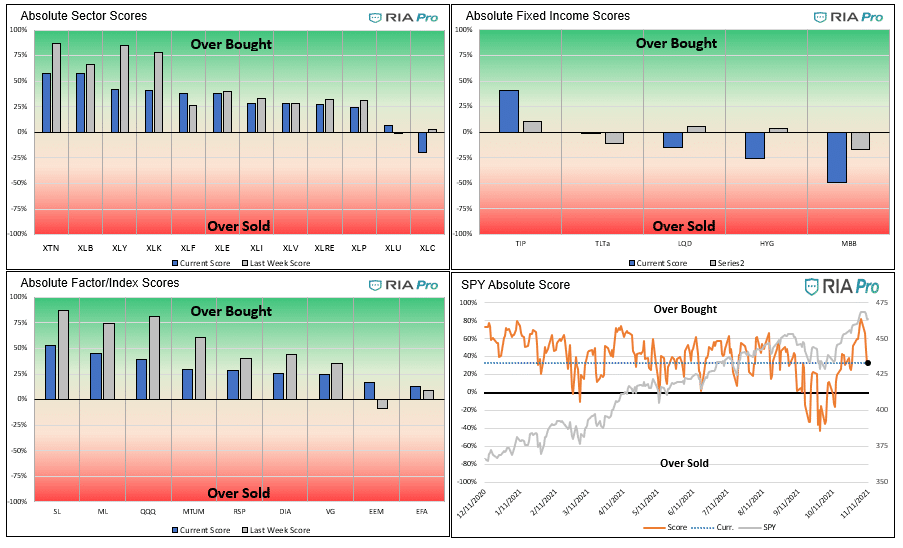
Absolute Value Graphs
- Technology is the most overbought factor/index, followed by small and mid-cap.
- As we thought might happen, the glaring overbought and oversold signals from last week moderated as the market corrected.
- Transports, Discretionary, and Technology, which were all considerably overbought, corrected this past week. They remain overbought but not to the same extreme. Communications is the only oversold sector. Discretionary and transports are 2.5 standard deviations above their 200dma.
- The factor/index graphs moderated strong overbought conditions as well. Small-cap, mid-cap, and the NASDAQ saw their respective scores fall to 50% or below. All factor/index scores are now above fair value.
- The S&P 500 corrected as well, bringing its absolute score to only moderately overbought from the highest we have seen this year. Our proprietary cash flow model and other technical indicators turned bearish early in the week, and the market followed. While the market is not as overbought as it was, our technical indicators warn the decline may not be over quite yet. Next week’s options expiration and coming mutual fund distributions may pressure stocks. That said, seasonality argues for a good end of the year.
Users Guide
The technical value scorecard report is one of many tools we use to manage our portfolios. This report may send a strong buy or sell signal, but we may not take action if other research and models do not affirm it.
The score is a percentage of the maximum score based on a series of weighted technical indicators for the last 200 trading days. Assets with scores over or under +/-70% are likely to either consolidate or change the trend. When the scatter plot in the sector graphs has an R-squared greater than .60, the signals are more reliable.
The first set of four graphs below are relative value-based, meaning the technical analysis is based on the ratio of the asset to its benchmark. The second set of graphs is computed solely on the price of the asset. At times we present “Sector spaghetti graphs,” which compare momentum and our score over time to provide further current and historical indications of strength or weakness. The square at the end of each squiggle is the current reading. The top right corner is the most bullish, while the bottom left corner is the most bearish.
The ETFs used in the model are as follows:
- Staples XLP
- Utilities XLU
- Health Care XLV
- Real Estate XLRE
- Materials XLB
- Industrials XLI
- Communications XLC
- Banking XLF
- Transportation XTN
- Energy XLE
- Discretionary XLY
- S&P 500 SPY
- Value IVE
- Growth IVW
- Small Cap SLY
- Mid Cap MDY
- Momentum MTUM
- Equal Weighted S&P 500 RSP
- NASDAQ QQQ
- Dow Jones DIA
- Emerg. Markets EEM
- Foreign Markets EFA
- IG Corp Bonds LQD
- High Yield Bonds HYG
- Long Tsy Bonds TLT
- Med Term Tsy IEI
- Mortgages MBB
- Inflation TIP
- Inflation Index- XLB, XLE, XLF, and Value (IVE)
- Deflation Index- XLP, XLU, XLK, and Growth (IWE)


Michael Lebowitz, CFA is an Investment Analyst and Portfolio Manager for RIA Advisors. specializing in macroeconomic research, valuations, asset allocation, and risk management. RIA Contributing Editor and Research Director. CFA is an Investment Analyst and Portfolio Manager; Co-founder of 720 Global Research.
Follow Michael on Twitter or go to 720global.com for more research and analysis.
Customer Relationship Summary (Form CRS)
Also Read