


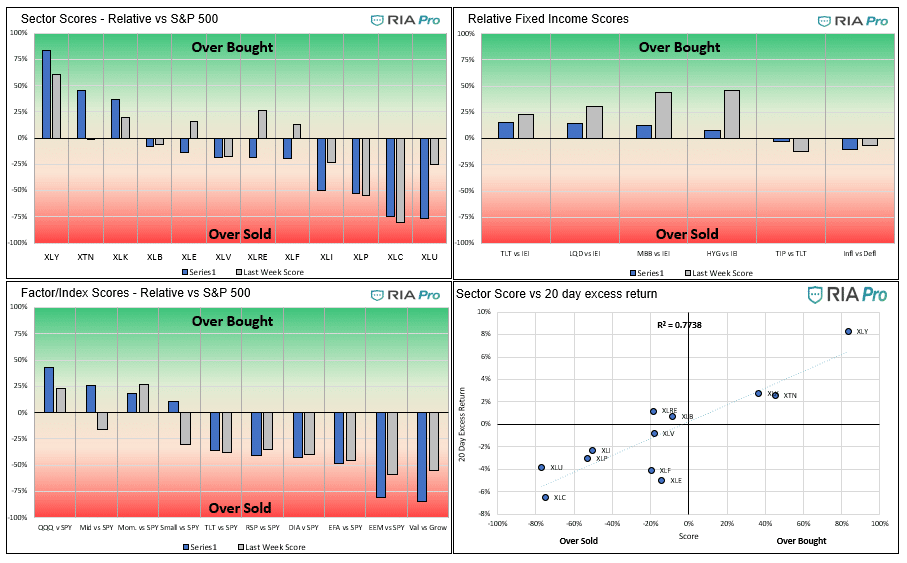
Relative Value Graphs
- The discretionary sector pushed into extreme overbought territory this past week, mainly on the back of Tesla’s gains. In both the relative and absolute models, the score on discretionary is over 80%. A pullback is likely imminent. The transportation sector (XTN) improved sharply on the week. A chunk of its gain is attributable to Avis (CAR), which is up 60% on the week. With its 3% contribution, CAR alone added 1.80% to the ETF’s return.
- Communications and utilities are grossly oversold versus the S&P 500, with scores less than minus 75%.
- The relative sector graph shows the gross divergence between winners and losers over the past month. This is another indicator of the bad breadth in the market. A similar setup is occurring in the factor/index graph. RSP, the equal-weighted S&P ETF, is decently oversold, signaling the largest market cap stocks are leading the way, and the remaining stocks are not keeping pace.
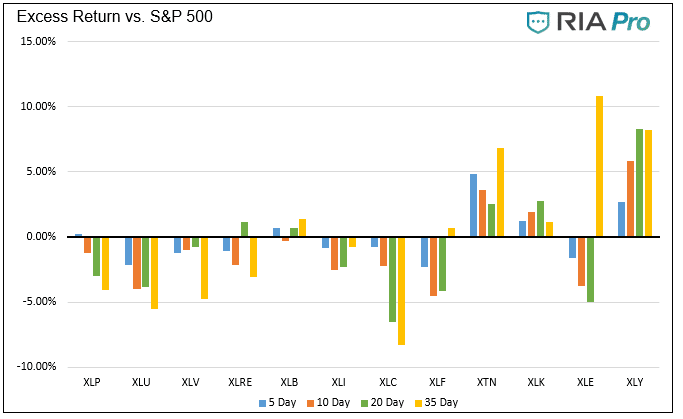
- The excess return graph at the bottom shows there are only a handful of sectors beating the market.
- Inflationary sectors have taken a back seat to the deflationary/growth sectors. Since mid-October, the inflationary sectors have outperformed the deflationary sectors by nearly 5%.
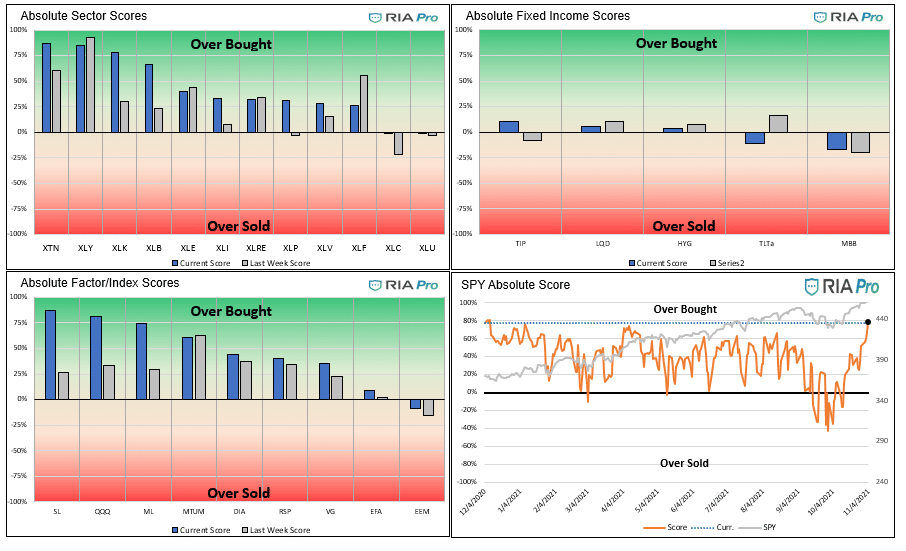
Absolute Value Graphs
- The graph on the bottom right shows the S&P 500 is now in deep overbought territory with its highest score in a year. Other models we follow confirm the market is profoundly extended and due for a pullback.
- Three sectors, transportation, discretionary, and technology, have absolute scores over 75%, warning of deeply overbought conditions. Small-caps, the NASDAQ, and mid-caps offer similar warnings.
- Utilities and communications are at fair value on an absolute basis, and as mentioned earlier, deeply oversold on a relative basis. If the market falls from here, these sectors will likely outperform.
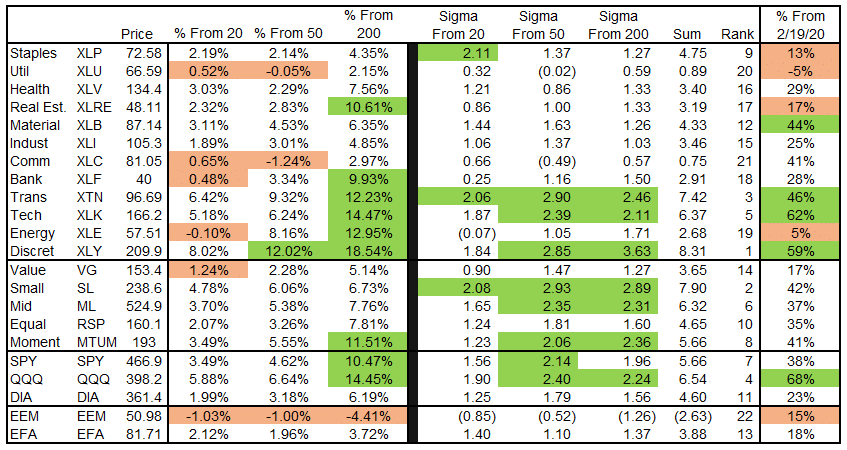
- The table at the bottom shows the discretionary sector is almost four standard deviations above its 200 dma and nearly three above its 50dma. Transportation and technology are also at deviations from their respective moving averages that offer caution.
Users Guide
The technical value scorecard report is one of many tools we use to manage our portfolios. This report may send a strong buy or sell signal, but we may not take any action if other research and models do not affirm it.
The score is a percentage of the maximum score based on a series of weighted technical indicators for the last 200 trading days. Assets with scores over or under +/-70% are likely to either consolidate or change the trend. When the scatter plot in the sector graphs has an R-squared greater than .60 the signals are more reliable.
The first set of four graphs below are relative value-based, meaning the technical analysis is based on the ratio of the asset to its benchmark. The second set of graphs is computed solely on the price of the asset. At times we present “Sector spaghetti graphs” which compare momentum and our score over time to provide further current and historical indications of strength or weakness. The square at the end of each squiggle is the current reading. The top right corner is the most bullish, while the bottom left corner is the most bearish.
The ETFs used in the model are as follows:
- Staples XLP
- Utilities XLU
- Health Care XLV
- Real Estate XLRE
- Materials XLB
- Industrials XLI
- Communications XLC
- Banking XLF
- Transportation XTN
- Energy XLE
- Discretionary XLY
- S&P 500 SPY
- Value IVE
- Growth IVW
- Small Cap SLY
- Mid Cap MDY
- Momentum MTUM
- Equal Weighted S&P 500 RSP
- NASDAQ QQQ
- Dow Jones DIA
- Emerg. Markets EEM
- Foreign Markets EFA
- IG Corp Bonds LQD
- High Yield Bonds HYG
- Long Tsy Bonds TLT
- Med Term Tsy IEI
- Mortgages MBB
- Inflation TIP
- Inflation Index- XLB, XLE, XLF, and Value (IVE)
- Deflation Index- XLP, XLU, XLK, and Growth (IWE)


Michael Lebowitz, CFA is an Investment Analyst and Portfolio Manager for RIA Advisors. specializing in macroeconomic research, valuations, asset allocation, and risk management. RIA Contributing Editor and Research Director. CFA is an Investment Analyst and Portfolio Manager; Co-founder of 720 Global Research.
Follow Michael on Twitter or go to 720global.com for more research and analysis.
Customer Relationship Summary (Form CRS)
Also Read


