


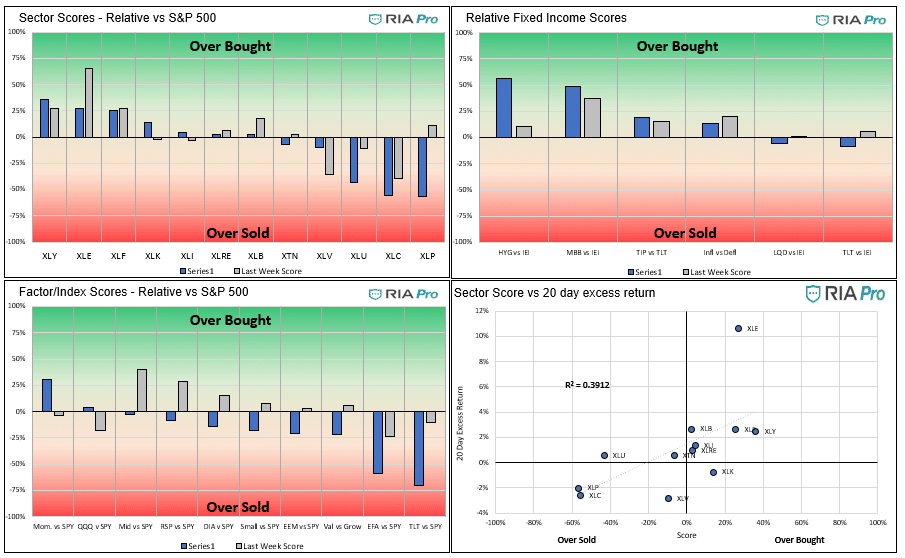
Relative Value Graphs
- The consumer discretionary sector has been trading well of late. Its performance can be misleading as Amazon (22%) and Tesla (13%) represent a third of the index. Amazon and Tesla shares are up 3.75% and 8.50%, respectively, over the last five days.
- The energy sector finally took a bit of a break, falling 1.6% versus the S&P 500. Staples continue to trade poor as many of these companies are struggling to pass higher costs onto consumers. The theme was evident in a slew of earnings reports this past week and will likely continue in the coming weeks.
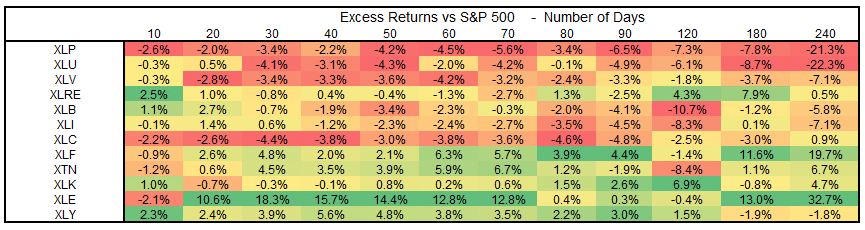
- Over the last month, our inflation index outperformed our deflation index by 10%. The outperformance is not surprising as TIPs implied inflation expectations have risen half a percent, from 2.42% to 2.94%. With the recent uptick, expectations are now at the highest levels in at least fifteen years. In the third table below, note the 30-day excess returns. In particular, staples, utilities, and healthcare, sectors that struggle with inflation, have greatly lagged. Conversely, financials, energy, and transports are leading the way over the period. Despite the sharply rising prices of many commodity prices, the materials sector is not keeping pace with the inflationary trade.
- Communications are decently oversold. Traditional communications companies like Comcast, AT&T, and Verizon are dragging on the sector. Adding to the pressure is Facebook, constituting nearly 25% of the sector. They are coming under increasing political pressure, and the stock will open nearly 4% weaker this morning on bad earning from SNAP.
- Developed markets (EFA) remain weak versus the S&P, as do longer-maturity Treasury bonds (TLT). Both are a function of rising inflation expectations.
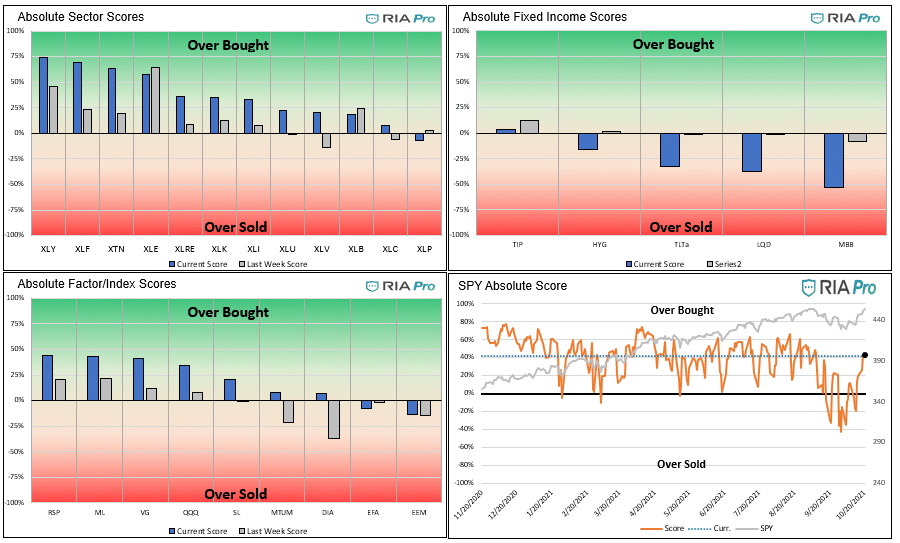
Absolute Value Graphs
- Discretionary, financials, transports, and energy are grossly overbought from an absolute perspective, potentially nearing a short-term top or consolidation. The factors/indexes also show strength in the inflation rotation, with the equal-weighted, mid-cap, and value sectors decently overbought. Unlike the stock sectors noted above, the indexes have more room on the upside before a more robust signal is triggered.
- The S&P is fairly oversold but still has more room to the upside, as shown on the chart in the lower right.
- Discretionary is over two standard deviations above its 20, 50, and 200 dma. This further confirms the sector is overbought and due for a pullback or consolidation. Other than that, there are no sectors or factors/indexes too far extended from the 200 dma.
Users Guide
The technical value scorecard report is one of many tools we use to manage our portfolios. This report may send a strong buy or sell signal, but we may not take any action if other research and models do not affirm it.
The score is a percentage of the maximum score based on a series of weighted technical indicators for the last 200 trading days. Assets with scores over or under +/-70% are likely to either consolidate or change the trend. When the scatter plot in the sector graphs has an R-squared greater than .60 the signals are more reliable.
The first set of four graphs below are relative value-based, meaning the technical analysis is based on the ratio of the asset to its benchmark. The second set of graphs is computed solely on the price of the asset. At times we present “Sector spaghetti graphs” which compare momentum and our score over time to provide further current and historical indications of strength or weakness. The square at the end of each squiggle is the current reading. The top right corner is the most bullish, while the bottom left corner is the most bearish.
The ETFs used in the model are as follows:
- Staples XLP
- Utilities XLU
- Health Care XLV
- Real Estate XLRE
- Materials XLB
- Industrials XLI
- Communications XLC
- Banking XLF
- Transportation XTN
- Energy XLE
- Discretionary XLY
- S&P 500 SPY
- Value IVE
- Growth IVW
- Small Cap SLY
- Mid Cap MDY
- Momentum MTUM
- Equal Weighted S&P 500 RSP
- NASDAQ QQQ
- Dow Jones DIA
- Emerg. Markets EEM
- Foreign Markets EFA
- IG Corp Bonds LQD
- High Yield Bonds HYG
- Long Tsy Bonds TLT
- Med Term Tsy IEI
- Mortgages MBB
- Inflation TIP
- Inflation Index- XLB, XLE, XLF, and Value (IVE)
- Deflation Index- XLP, XLU, XLK, and Growth (IWE)


Michael Lebowitz, CFA is an Investment Analyst and Portfolio Manager for RIA Advisors. specializing in macroeconomic research, valuations, asset allocation, and risk management. RIA Contributing Editor and Research Director. CFA is an Investment Analyst and Portfolio Manager; Co-founder of 720 Global Research.
Follow Michael on Twitter or go to 720global.com for more research and analysis.
Customer Relationship Summary (Form CRS)
Also Read


