


The Technical Value Scorecard Report uses 6-technical readings to score and gauge which sectors, factors, indexes, and bond classes are overbought or oversold. We present the data on a relative basis (versus the assets benchmark) and on an absolute stand-alone basis. You will find more detail on the model and the specific tickers below the charts.
Commentary 6-4-21
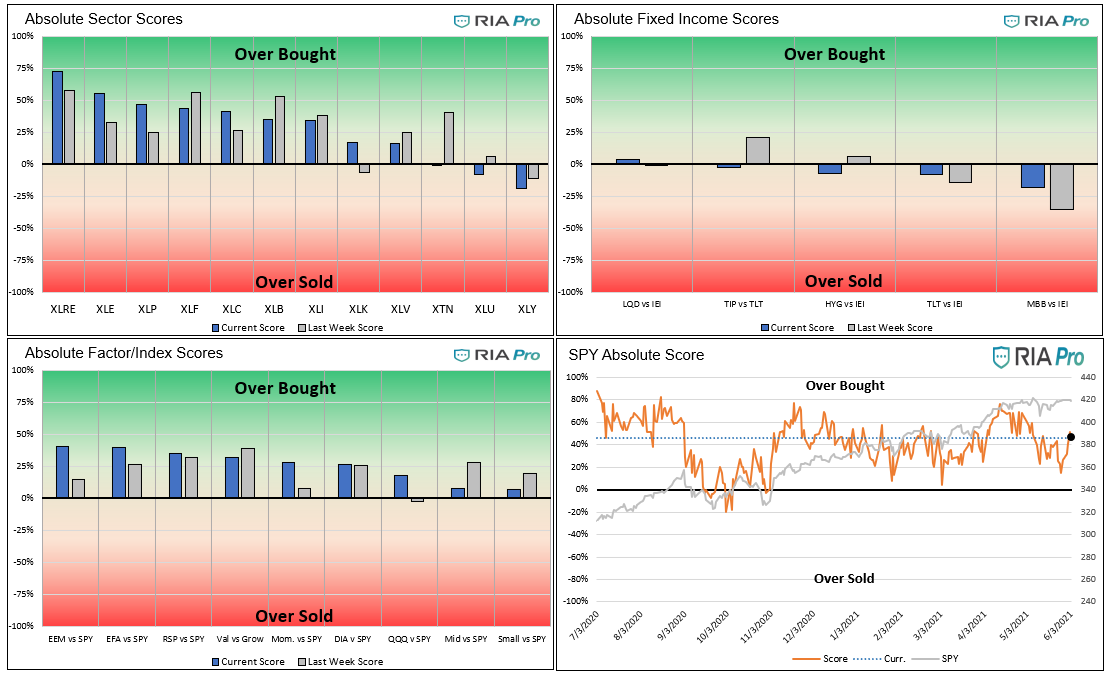
- As you will notice, we re-formatted the relative and absolute graphs to make them easier to read. First, the scores are now in a bar chart format and sorted from most overbought to most oversold. In general, a score above 80% warrants caution, as it usually leads to a relative or absolute consolidation or decline. Likewise, a score below -80% often signals a buying opportunity. Based on client feedback, we now provide last week’s score as well, to provide a gauge of the recent trend. The relative and absolute scores, taken in conjunction with other technical, fundamental, and economic assessments, provide a solid basis for investment decisions.
- The Relative-Sector graphs show the real estate sector is very overbought, after beating the S&P 500 by over 3% last week and nearly 6% over the last four weeks. Real estate is now 1.98, 2.24, and 2.60 standard deviations above its 20, 50, and 200 dmas. Readings at or above 2% are hard to maintain and often result in a pullback or consolidation. If you are over-allocated to the sector or want to reduce exposure in general, you should consider taking some profits. Longer-term XLRE tends to outperform the S&P 500 when the Fed is not buying assets. XLRE’s recent performance may be providing an early warning that the tapering of QE is coming.
- The next three most overbought sectors are those that benefit most from rising inflation expectations- energy, financials, and materials. Despite the inflationary push last week, staples went from slightly oversold to slightly overbought. This was likely a function of investors seeking safety in the down market. Utilities, another lower beta sector in which investors gravitate toward in down markets, also outperformed the market. However, its score remains somewhat deeply in oversold territory.
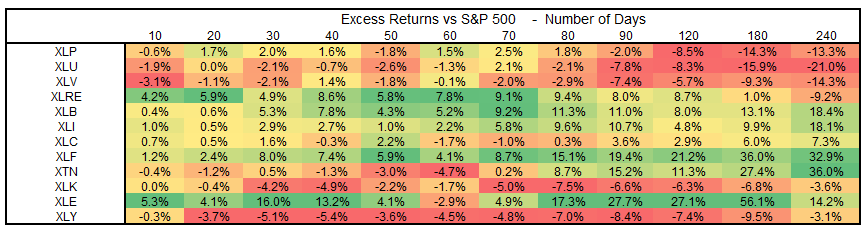
- The third table below shows the performance of each sector over multiple time frames. XLK and XLY are sectors that have performed poorly versus the S&P, but may be showing signs of improving. Conversely, XLB and XLF, while outperforming are now more in line with the S&P 500. Energy is not showing signs of slowing down as the price of crude oil approaches $70/barrel. It is too early to tell, but the changes in some of the aforementioned sector over/under performances may be an early indication the relation trade may be slowing.
- The scatter plot in the bottom right of the relative graphs shows a continued high statistical correlation between each sector’s scores and their excess returns versus the S&P 500. This provides confidence in the results.
- The relative factor/index graph paints a similar picture as the relative sector graphs. The inflationary biased sectors like the equal-weighted S&P (RSP), value, and small-cap are the most overbought, albeit not at cautionary levels. The score on the inflation/deflation gauge (top right relative graph) based on 8 sectors/factors inched upward but is far from overbought.
- On the absolute graphs, real estate is also the most overbought sector, followed by the inflationary sectors for the most part. The factor/index absolute graphs and the S&P (bottom right) show the market remains overbought but not to a concerning degree. Our proprietary daily and weekly money flow indicators are likely to trigger sell signals shortly so caution is warranted.
- Despite the inflationary push last week, TIPs lost ground to nominal bonds (TLT) as shown in the upper right in the second set of graphs.
Graphs (Click on the graphs to expand)

Users Guide
The score is a percentage of the maximum/minimum score, as well as on a normalized basis (sigma) for the last 200 trading days. Assets with scores over or under +/-60% and sigmas over or under +/-2 are likely to either consolidate or change trend. When both the score and sigma are above or below those key levels simultaneously, the signal is stronger.
The first set of four graphs below are relative value-based, meaning the technical analysis score and sigma represent a ratio of the asset to its benchmark. The second set of graphs is computed solely on the price of the asset. At times we present “Sector spaghetti graphs” which compare momentum and our score over time to provide further current and historical indications of strength or weakness. The square at the end of each squiggle is the current reading. The top right corner is the most bullish, while the bottom left corner the most bearish.
The technical value scorecard report is one of many tools we use to manage our portfolios. This report may send a strong buy or sell signal, but we may not take any action if other research and models do not affirm it.
The ETFs used in the model are as follows:
- Staples XLP
- Utilities XLU
- Health Care XLV
- Real Estate XLRE
- Materials XLB
- Industrials XLI
- Communications XLC
- Banking XLF
- Transportation XTN
- Energy XLE
- Discretionary XLY
- S&P 500 SPY
- Value IVE
- Growth IVW
- Small Cap SLY
- Mid Cap MDY
- Momentum MTUM
- Equal Weighted S&P 500 RSP
- NASDAQ QQQ
- Dow Jones DIA
- Emerg. Markets EEM
- Foreign Markets EFA
- IG Corp Bonds LQD
- High Yield Bonds HYG
- Long Tsy Bonds TLT
- Med Term Tsy IEI
- Mortgages MBB
- Inflation TIP
- Inflation Index- XLB, XLE, XLF, and Value (IVE)
- Deflation Index- XLP, XLU, XLK, and Growth (IWE)


Michael Lebowitz, CFA is an Investment Analyst and Portfolio Manager for RIA Advisors. specializing in macroeconomic research, valuations, asset allocation, and risk management. RIA Contributing Editor and Research Director. CFA is an Investment Analyst and Portfolio Manager; Co-founder of 720 Global Research.
Follow Michael on Twitter or go to 720global.com for more research and analysis.
Customer Relationship Summary (Form CRS)
Also Read


