


The Technical Value Scorecard Report uses 6-technical readings to score and gauge which sectors, factors, indexes, and bond classes are overbought or oversold. We present the data on a relative basis (versus the assets benchmark) and on an absolute stand-alone basis. You can find more detail on the model and the specific tickers below the charts.
Commentary 3-12-21
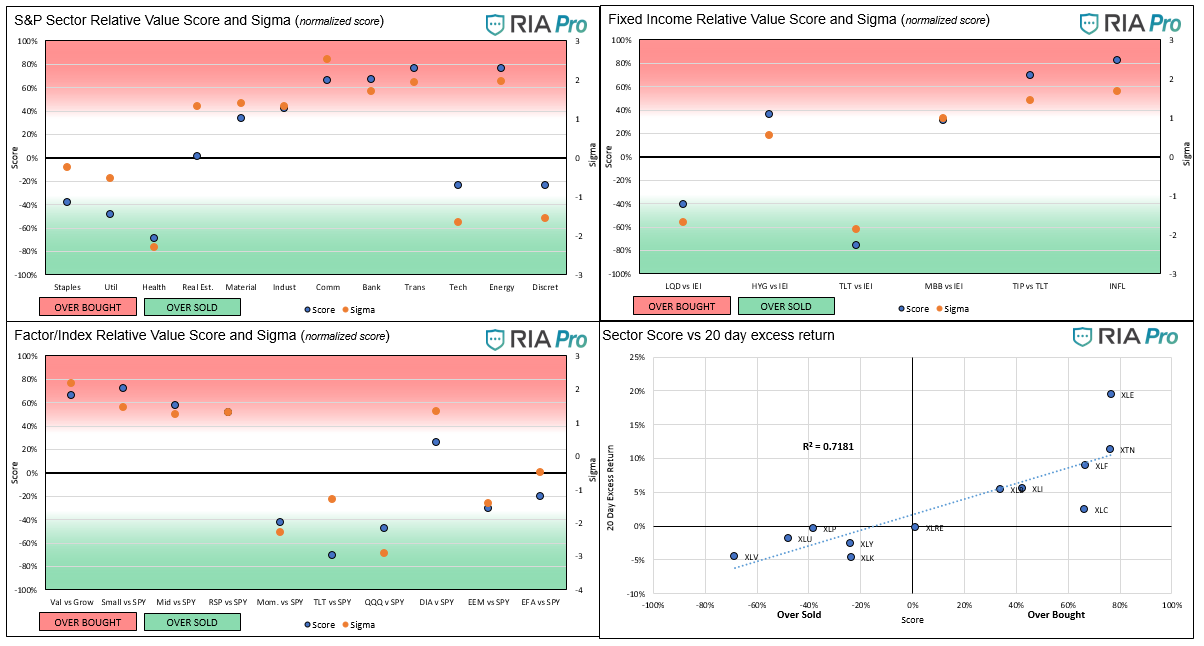
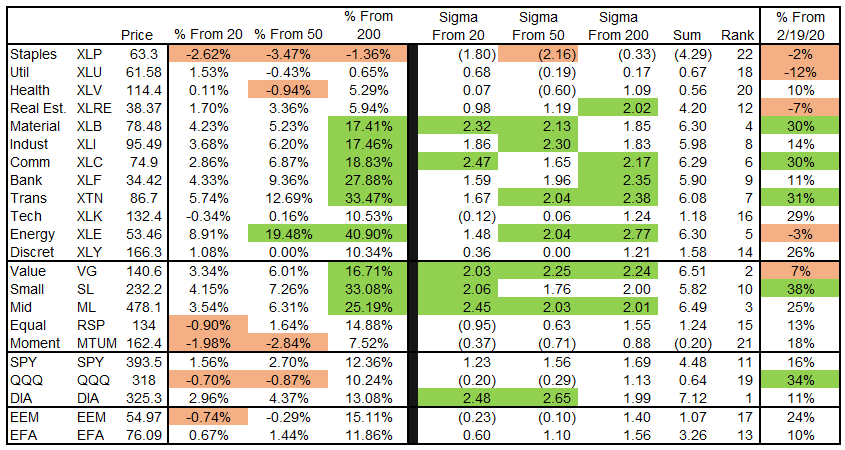
- The recent period of equity weakness/consolidation was relatively short-lived as markets quickly rallied this past week back to near or record highs. As shown in the third table below, many sectors and factor/indexes are trading above their 20, 50, and 200-day ma. Staples are the only sector trading below all three moving averages.
- The Relative graphs are largely unchanged over the past week. Some of the more oversold sectors like Discretionary and Healthcare improved. Real estate, one of the hotter sectors over the prior month, moved back closer to fair value. It appears interest rates are one of the key factors driving the sector rotations on a day-to-day basis.
- The scatter plot also looks similar to prior weeks, with a high correlation (R-squared) and Energy continuing to perform better than the model’s score would imply.
- The Dow Jones, small and mid-cap indexes continue to outperform the S&P and Nasdaq. We suspect this will continue to be the case if interest rates keep rising.
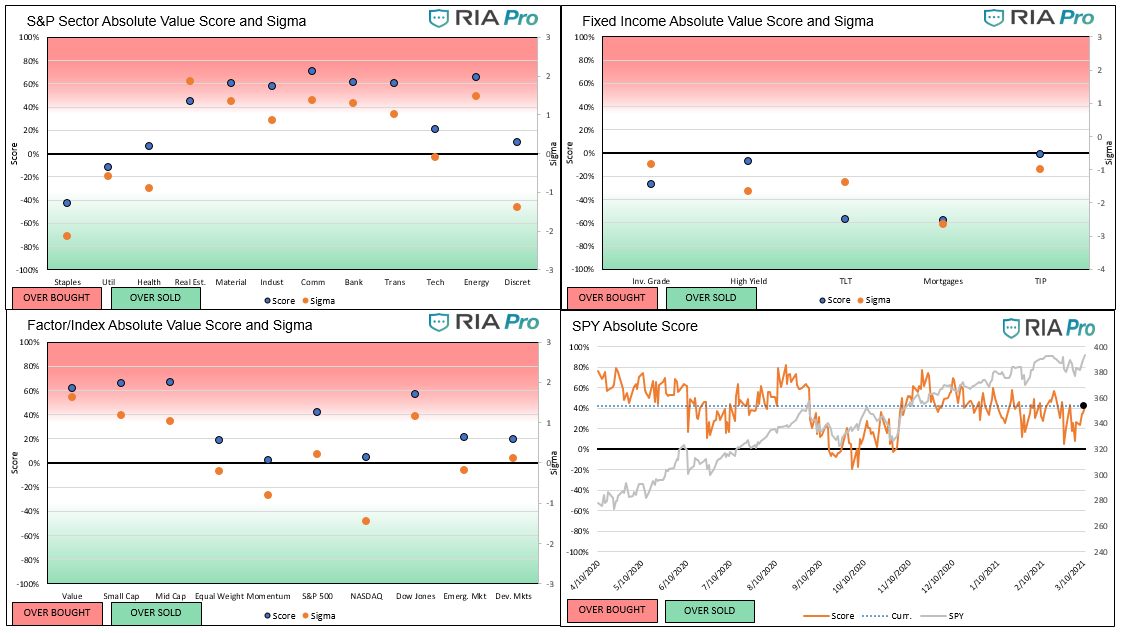
- The second set of graphs, Absolute analysis, saw most sectors and factors/indexes shift higher over the last week. Last week Value was the only factor/index with a score and sigma in overbought territory. This week there are 6 sectors meeting said criteria, as well as every sector/factor/index.
- After trading down to fair value last week, the S&P is now moderately overbought but still has room to reach prior model highs.
Graphs (Click on the graphs to expand)
Users Guide
The score is a percentage of the maximum/minimum score, as well as on a normalized basis (sigma) for the last 200 trading days. Assets with scores over or under +/-60% and sigmas over or under +/-2 are likely to either consolidate or change trend. When both the score and sigma are above or below those key levels simultaneously, the signal is stronger.
The first set of four graphs below are relative value-based, meaning the technical analysis score and sigma is based on the ratio of the asset to its benchmark. The second set of graphs is computed solely on the price of the asset. Lastly, we present “Sector spaghetti graphs” which compare momentum and our score over time to provide further current and historical indications of strength or weakness. The square at the end of each squiggle is the current reading. The top right corner is the most bullish, while the bottom left corner the most bearish.
The technical value scorecard report is just one of many tools that we use to assess our holdings and decide on potential trades. This report may send a strong buy or sell signal, but we may not take any action if other research and models do not affirm it.
The ETFs used in the model are as follows:
- Staples XLP
- Utilities XLU
- Health Care XLV
- Real Estate XLRE
- Materials XLB
- Industrials XLI
- Communications XLC
- Banking XLF
- Transportation XTN
- Energy XLE
- Discretionary XLY
- S&P 500 SPY
- Value IVE
- Growth IVW
- Small Cap SLY
- Mid Cap MDY
- Momentum MTUM
- Equal Weighted S&P 500 RSP
- NASDAQ QQQ
- Dow Jones DIA
- Emerg. Markets EEM
- Foreign Markets EFA
- IG Corp Bonds LQD
- High Yield Bonds HYG
- Long Tsy Bonds TLT
- Med Term Tsy IEI
- Mortgages MBB
- Inflation TIP
- Inflation Index- XLB, XLE, XLF, and Value (IVE)
- Deflation Index- XLP, XLU, XLK, and Growth (IWE)


Michael Lebowitz, CFA is an Investment Analyst and Portfolio Manager for RIA Advisors. specializing in macroeconomic research, valuations, asset allocation, and risk management. RIA Contributing Editor and Research Director. CFA is an Investment Analyst and Portfolio Manager; Co-founder of 720 Global Research.
Follow Michael on Twitter or go to 720global.com for more research and analysis.
Customer Relationship Summary (Form CRS)
Also Read


