


The Technical Value Scorecard Report uses 6-technical readings to score and gauge which sectors, factors, indexes, and bond classes are overbought or oversold. We present the data on a relative basis (versus the assets benchmark) and on an absolute stand-alone basis. You can find more detail on the model and the specific tickers below the charts.
Commentary 2-19-21
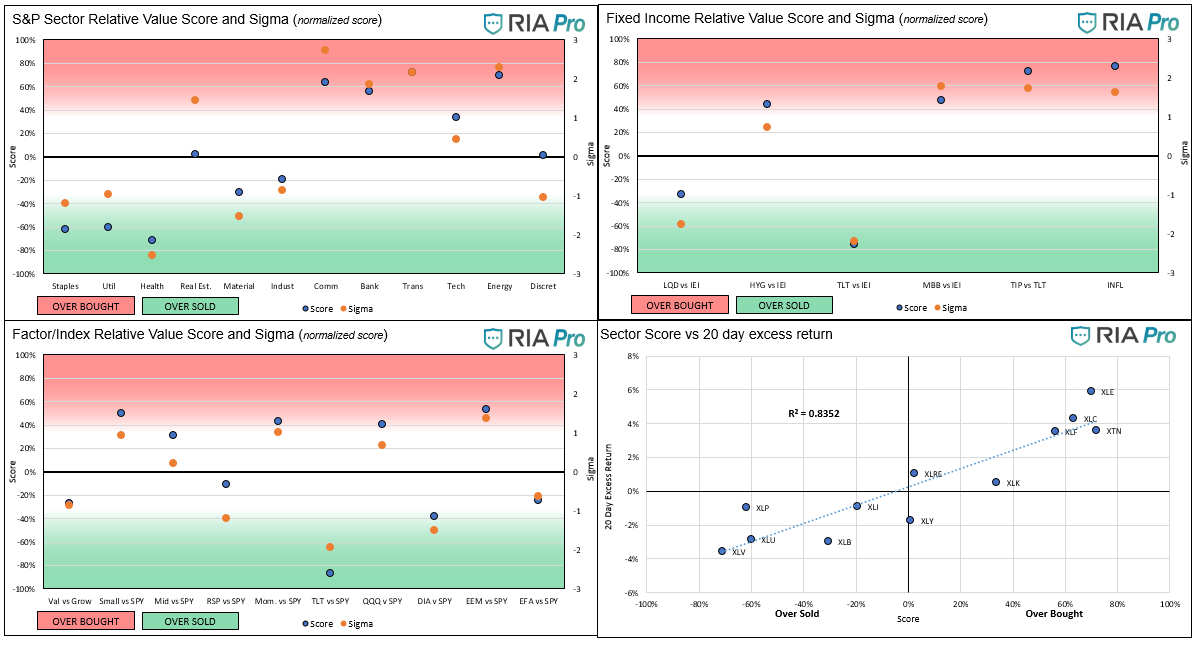
- Communications remain the most overbought sector this week, however, the banking, transportation, and energy sectors rose to nearly equally overbought levels versus the S&P 500. All four sectors are trading near or above their respective 200-day ma, so caution is advised.
- Materials remain relatively weak, having underperformed the S&P 500 over the last 5, 10, 20, and 35 day periods. This is a little surprising as inflationary sectors have outperformed, as we will discuss, and implied inflation rates rose through those periods.
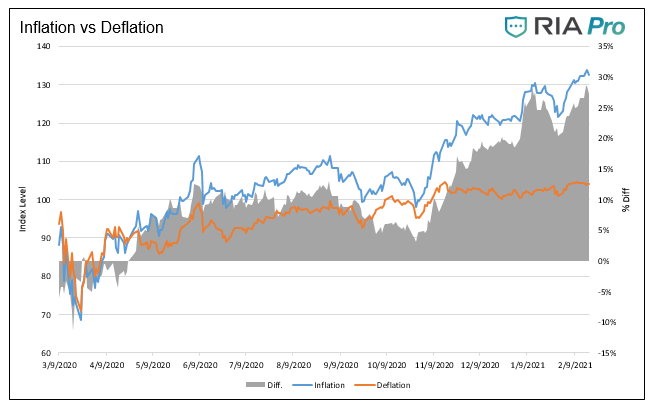
- We added a new Inflation indicator to the Sector analysis in the Fixed income section of the first set of graphs. The indicator is based on the ratio of our inflationary index to our deflationary index. The index sector constituents are listed in the Users Guide at the bottom of the article. The third graph below compares the two indexes over the past year as well as their differential. Since early November the inflation index has outperformed the deflation index by over 20%. Not surprisingly, the score and sigma for the index, (inflation index relative to deflation index) shown below point to relative overbought conditions in the inflationary indexes. As long as the Fed ignores higher yields and the government talks up massive amounts of stimulus, this condition may persist.
- Small caps, momentum, technology, and emerging markets remain the most overbought index/factors on a relative basis.
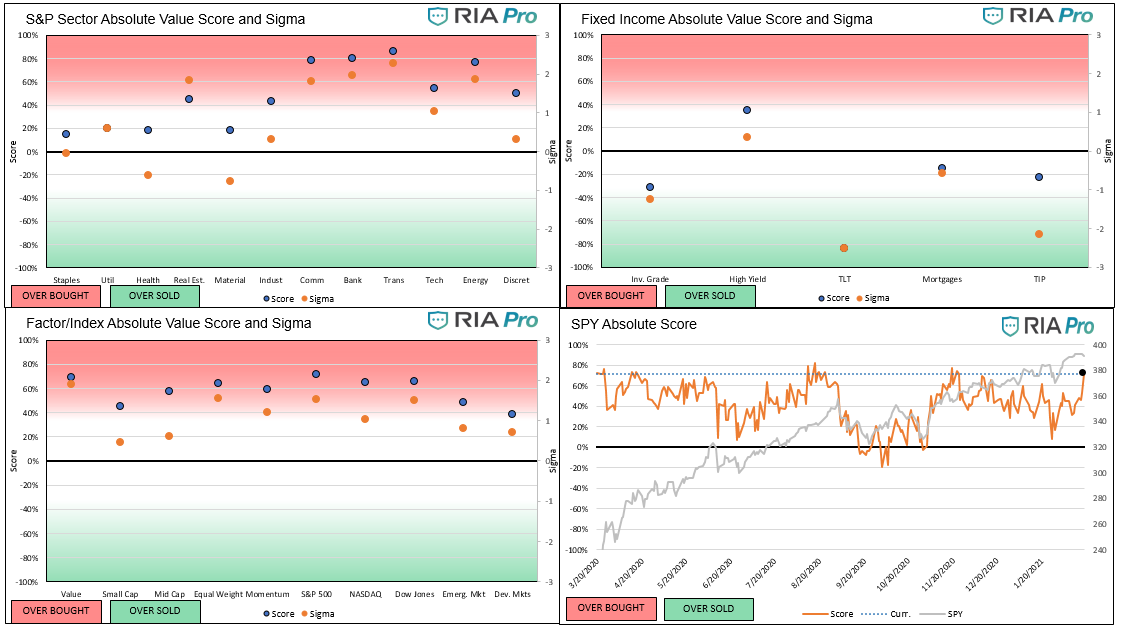
- On an absolute basis, the S&P 500 is back to strongly overbought levels. This indicator along with other technical signals and our proprietary models indicates some weakness or consolidation is near. Similarly, the hot sectors mentioned above are near extreme overbought levels on an absolute basis. The deflationary sectors, staples, utilities, and healthcare are fairly valued. Nothing is oversold on an absolute basis. This condition also applies to every factor/index.
Graphs (Click on the graphs to expand)
Users Guide
The score is a percentage of the maximum/minimum score, as well as on a normalized basis (sigma) for the last 200 trading days. Assets with scores over or under +/-60% and sigmas over or under +/-2 are likely to either consolidate or change trend. When both the score and sigma are above or below those key levels simultaneously, the signal is stronger.
The first set of four graphs below are relative value-based, meaning the technical analysis score and sigma is based on the ratio of the asset to its benchmark. The second set of graphs is computed solely on the price of the asset. Lastly, we present “Sector spaghetti graphs” which compare momentum and our score over time to provide further current and historical indications of strength or weakness. The square at the end of each squiggle is the current reading. The top right corner is the most bullish, while the bottom left corner the most bearish.
The technical value scorecard report is just one of many tools that we use to assess our holdings and decide on potential trades. This report may send a strong buy or sell signal, but we may not take any action if other research and models do not affirm it.
The ETFs used in the model are as follows:
- Staples XLP
- Utilities XLU
- Health Care XLV
- Real Estate XLRE
- Materials XLB
- Industrials XLI
- Communications XLC
- Banking XLF
- Transportation XTN
- Energy XLE
- Discretionary XLY
- S&P 500 SPY
- Value IVE
- Growth IVW
- Small Cap SLY
- Mid Cap MDY
- Momentum MTUM
- Equal Weighted S&P 500 RSP
- NASDAQ QQQ
- Dow Jones DIA
- Emerg. Markets EEM
- Foreign Markets EFA
- IG Corp Bonds LQD
- High Yield Bonds HYG
- Long Tsy Bonds TLT
- Med Term Tsy IEI
- Mortgages MBB
- Inflation TIP
- Inflation Index- XLB, XLE, XLF, and Value (IVE)
- Deflation Index- XLP, XLU, XLK, and Growth (IWE)


Michael Lebowitz, CFA is an Investment Analyst and Portfolio Manager for RIA Advisors. specializing in macroeconomic research, valuations, asset allocation, and risk management. RIA Contributing Editor and Research Director. CFA is an Investment Analyst and Portfolio Manager; Co-founder of 720 Global Research.
Follow Michael on Twitter or go to 720global.com for more research and analysis.
Customer Relationship Summary (Form CRS)
Also Read


