


The Technical Value Scorecard Report uses 6-technical readings to score and gauge which sectors, factors, indexes, and bond classes are overbought or oversold. We present the data on a relative basis (versus the assets benchmark) and on an absolute stand-alone basis. You can find more detail on the model and the specific tickers below the charts.
Commentary 12-11-20
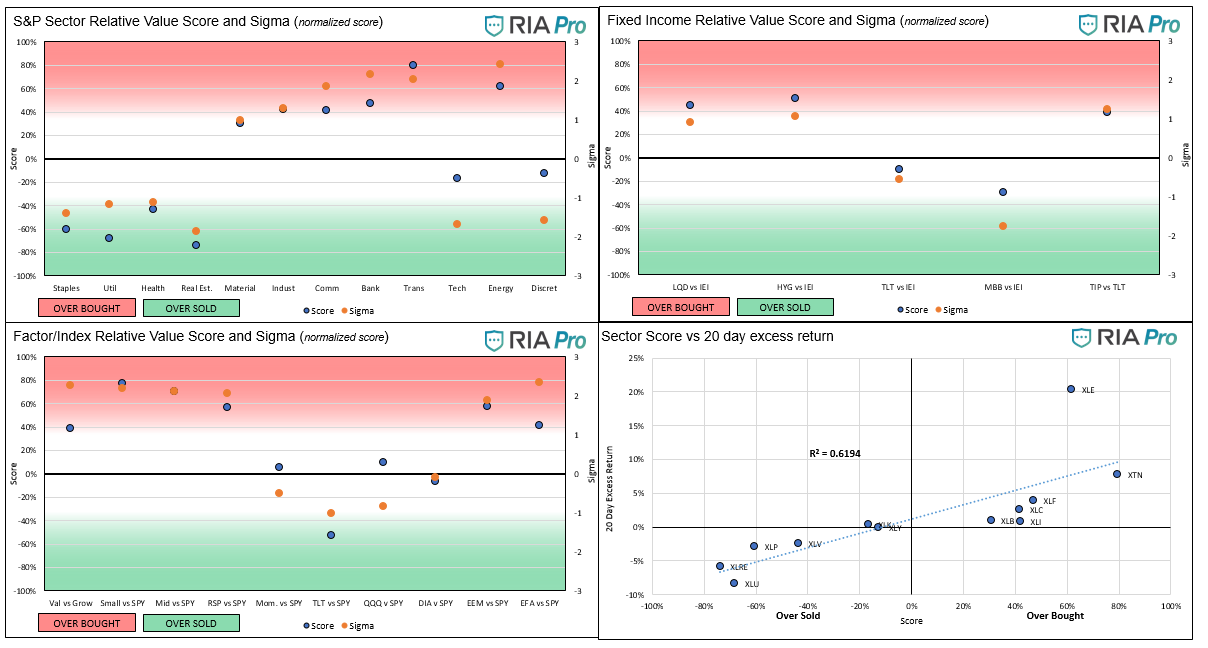
- The relative value sector scores and sigmas look similar to last week. Energy and Transportation remain the most overbought sectors on a relative basis, while Staples, Utilities, Healthcare, and Real estate remain the most oversold. Technology and Discretionary, the market leaders for much of the recovery, are also taking a back seat to the reflationary sectors.
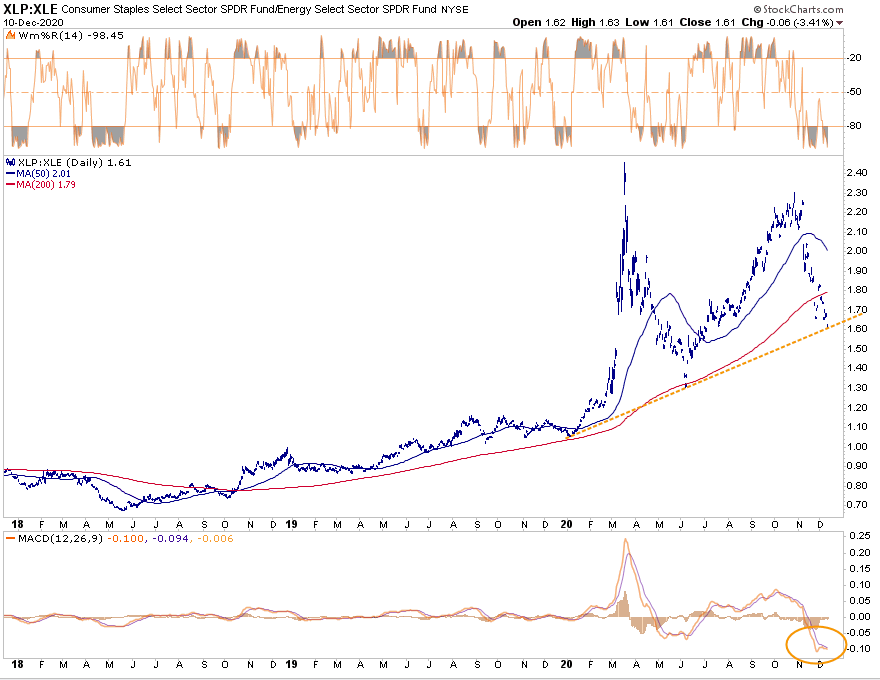
- Energy companies benefit from inflation to some degree as they can sell their products at higher prices. On the other hand many companies classified as Staples tend to see margins compress as their input costs rise and they are not always able to pass it on to consumers. The fourth graph below compares the ratio of XLP to XLE. Recently, the ratio has been in sharp decline as inflation expectations have risen. Currently the ratio is hitting support via the dotted orange line. Further the MACD, circled at the bottom, is not only showing the ratio is grossly oversold but crossing, potentially signalling an upturn in the ratio. The MACD did not get nearly as extreme during the April-June ratio decline.
- If we remove energy (XLE) from the scatter graph, comparing relative scores to excess performance (versus the S&P), our model’s statistical score rises from .62 to .89, a significant correlation. In other words, the model is working well, but we would expect much higher scores for XLE given the amazing recent performance.
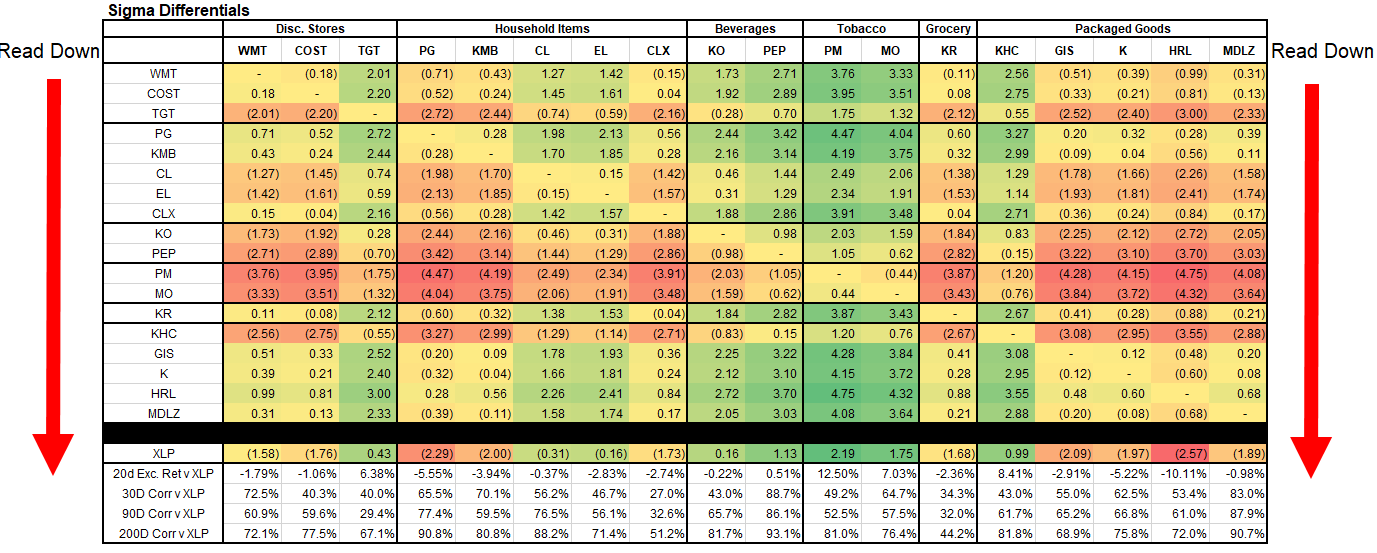
- Below the Relative and Absolute graphs you will find a breakdown of the Staples sector, similar to what we reviewed last week with Utilities. If you think the reflationary trend is nearing an end, selling inflationary beneficiaries such as Energy and buying Staples or Utilities makes sense. The table below shows which staple stocks are overbought or oversold versus the sector (XLP) and against each other. Of note, PG, KMB, HRL, and GIS are all 2 sigmas below XLP. Tobacco, Beverages and KHC are outperforming.
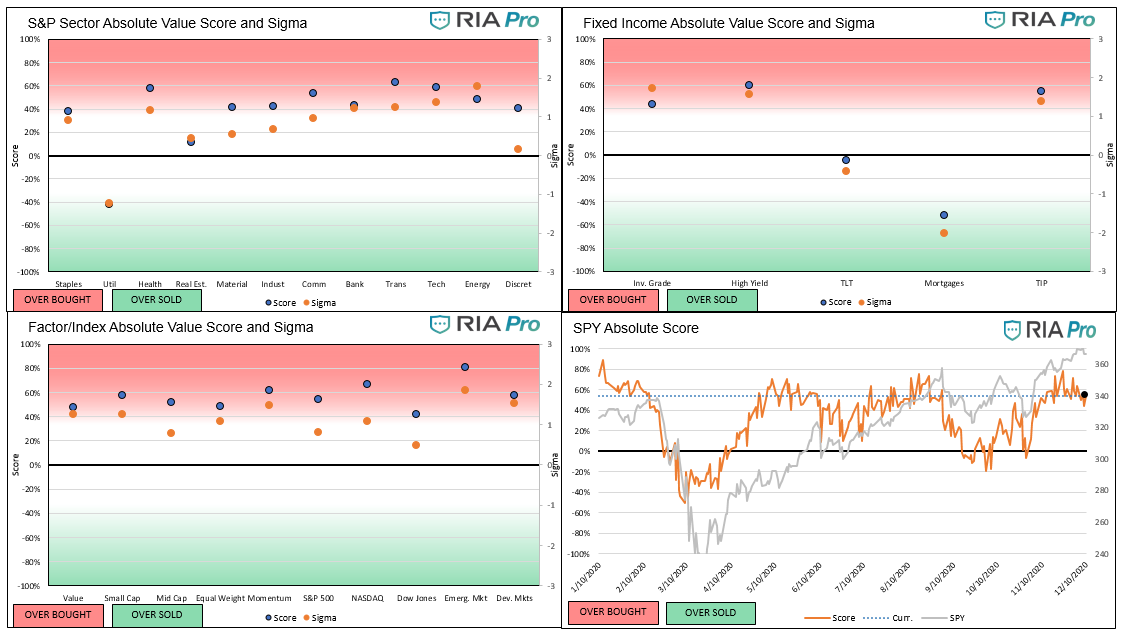
- Like the relative value graphs, the absolute graphs look similar to last week. Almost all sectors and factors/indexes have retreated slightly from grossly overbought territory. Utilities are the only oversold sector. The S&P is very overbought but off the more extreme levels of two weeks ago.
- Emerging markets, a beneficiary of inflation and a weaker dollar, is the most overbought index. As we discussed with energy, if you think the reflationary trend will continue, than emerging markets (EEM) may be rewarding.
Graphs (Click on the graphs to expand)
Users Guide
The score is a percentage of the maximum/minimum score, as well as on a normalized basis (sigma) for the last 200 trading days. Assets with scores over or under +/-60% and sigmas over or under +/-2 are likely to either consolidate or change trend. When both the score and sigma are above or below those key levels simultaneously, the signal is stronger.
The first set of four graphs below are relative value-based, meaning the technical analysis score and sigma is based on the ratio of the asset to its benchmark. The second set of graphs is computed solely on the price of the asset. Lastly, we present “Sector spaghetti graphs” which compare momentum and our score over time to provide further current and historical indications of strength or weakness. The square at the end of each squiggle is the current reading. The top right corner is the most bullish, while the bottom left corner the most bearish.
The technical value scorecard report is just one of many tools that we use to assess our holdings and decide on potential trades. This report may send a strong buy or sell signal, but we may not take any action if other research and models do not affirm it.
The ETFs used in the model are as follows:
- Staples XLP
- Utilities XLU
- Health Care XLV
- Real Estate XLRE
- Materials XLB
- Industrials XLI
- Communications XLC
- Banking XLF
- Transportation XTN
- Energy XLE
- Discretionary XLY
- S&P 500 SPY
- Value IVE
- Growth IVW
- Small Cap SLY
- Mid Cap MDY
- Momentum MTUM
- Equal Weighted S&P 500 RSP
- NASDAQ QQQ
- Dow Jones DIA
- Emerg. Markets EEM
- Foreign Markets EFA
- IG Corp Bonds LQD
- High Yield Bonds HYG
- Long Tsy Bonds TLT
- Med Term Tsy IEI
- Mortgages MBB
- Inflation TIP


Michael Lebowitz, CFA is an Investment Analyst and Portfolio Manager for RIA Advisors. specializing in macroeconomic research, valuations, asset allocation, and risk management. RIA Contributing Editor and Research Director. CFA is an Investment Analyst and Portfolio Manager; Co-founder of 720 Global Research.
Follow Michael on Twitter or go to 720global.com for more research and analysis.
Customer Relationship Summary (Form CRS)
Also Read


