The Technical Value Scorecard Report uses 6-technical readings to score and gauge which sectors, factors, indexes, and bond classes are overbought or oversold. We present the data on a relative basis (versus the assets benchmark) and on an absolute stand-alone basis. You can find more detail on the model and the specific tickers below the charts.
Commentary 11-20-20
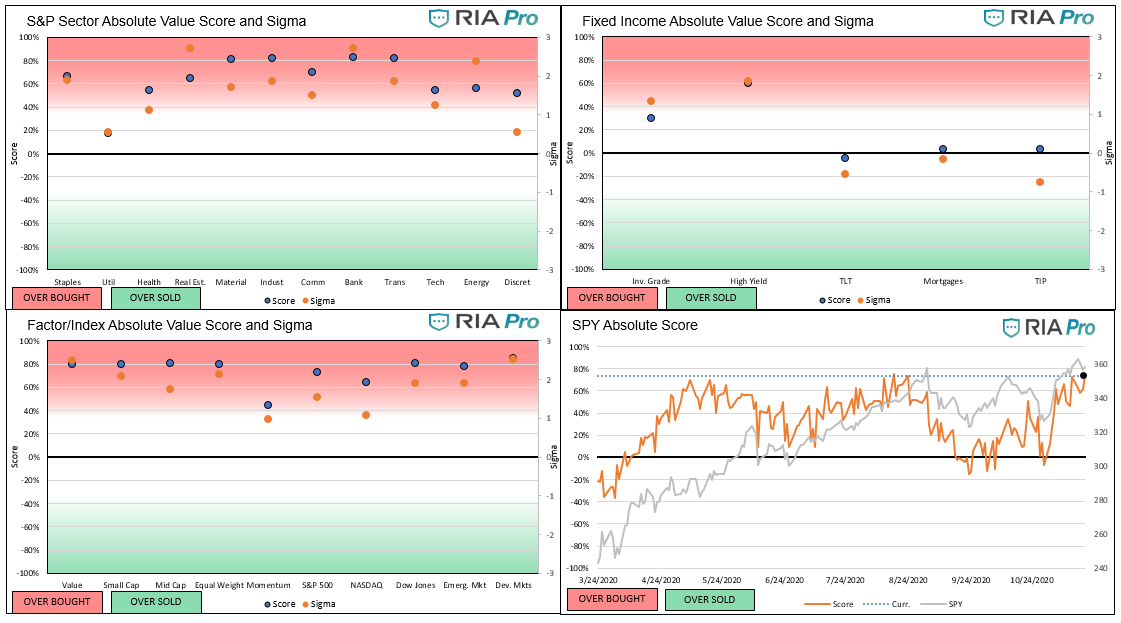
- We start with an analysis of the Absolute charts below. Despite most markets consolidating over the past week, most sectors and markets remain well overbought. The S&P 500, for instance in the lower right graph (absolute charts), is still at overbought levels last seen in late August before a nearly 10% decline.
- Foreign Developed Markets and Value are the most extreme overbought indexes with both their scores and normalized scores (sigma) at or above 80%. Technology and Momentum are overbought but to a lesser extreme than the rest of the major indexes.
- At a sector level, Utilities are the least overbought, while Banking is the most.
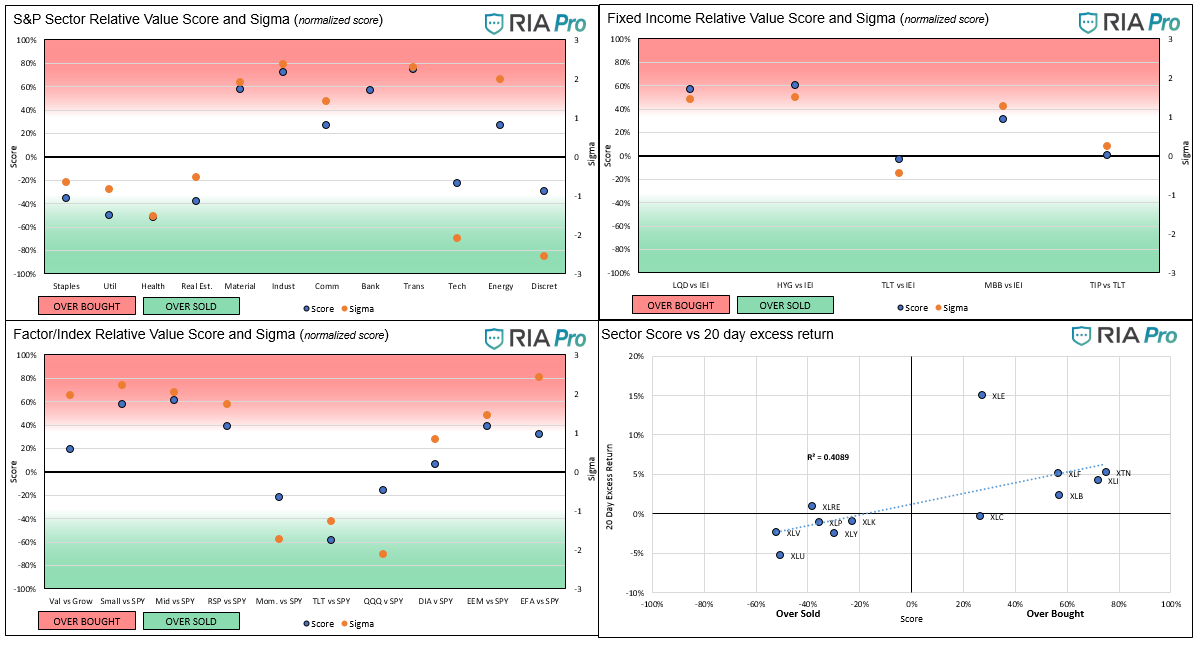
- On a relative basis versus the S&P 500, the reflation sectors (Materials, Industrials, Banks, Energy, and Transportation) remain the most overbought. Tech and traditional lower beta conservative sectors (Staples, Utilities, Healthcare, and Realestate) are slightly oversold versus the S&P. If you are looking to fade the reflation trade, Tech and Momentum are the most oversold indexes versus the S&P.
- Utilities were the most overbought sector a few weeks ago. At the time we reduced our exposure to the sector and recommended doing the same. It has underperformed the S&P 500 by 5.35% over the last 20 days. XLU is not grossly oversold but bears closely watching to potentially add back positions. It is the only sector or index below its 20 day moving average.
- The scatter plot in the relative set of charts has a poor correlation (R2) for the week meaning that returns and scores are not in line. This is largely due to the energy sector which handily outperformed (>10%) what one would expect given its scores.
Graphs (Click on the graphs to expand)

Users Guide
The score is a percentage of the maximum/minimum score, as well as on a normalized basis (sigma) for the last 200 trading days. Assets with scores over or under +/-60% and sigmas over or under +/-2 are likely to either consolidate or change trend. When both the score and sigma are above or below those key levels simultaneously, the signal is stronger.
The first set of four graphs below are relative value-based, meaning the technical analysis score and sigma is based on the ratio of the asset to its benchmark. The second set of graphs is computed solely on the price of the asset. Lastly, we present “Sector spaghetti graphs” which compare momentum and our score over time to provide further current and historical indications of strength or weakness. The square at the end of each squiggle is the current reading. The top right corner is the most bullish, while the bottom left corner the most bearish.
The technical value scorecard report is just one of many tools that we use to assess our holdings and decide on potential trades. This report may send a strong buy or sell signal, but we may not take any action if other research and models do not affirm it.
The ETFs used in the model are as follows:
- Staples XLP
- Utilities XLU
- Health Care XLV
- Real Estate XLRE
- Materials XLB
- Industrials XLI
- Communications XLC
- Banking XLF
- Transportation XTN
- Energy XLE
- Discretionary XLY
- S&P 500 SPY
- Value IVE
- Growth IVW
- Small Cap SLY
- Mid Cap MDY
- Momentum MTUM
- Equal Weighted S&P 500 RSP
- NASDAQ QQQ
- Dow Jones DIA
- Emerg. Markets EEM
- Foreign Markets EFA
- IG Corp Bonds LQD
- High Yield Bonds HYG
- Long Tsy Bonds TLT
- Med Term Tsy IEI
- Mortgages MBB
- Inflation TIP


Michael Lebowitz, CFA is an Investment Analyst and Portfolio Manager for RIA Advisors. specializing in macroeconomic research, valuations, asset allocation, and risk management. RIA Contributing Editor and Research Director. CFA is an Investment Analyst and Portfolio Manager; Co-founder of 720 Global Research.
Follow Michael on Twitter or go to 720global.com for more research and analysis.
Customer Relationship Summary (Form CRS)
Also Read