


The Technical Value Scorecard Report uses 6-technical readings to score and gauge which sectors, factors, indexes, and bond classes are overbought or oversold. We present the data on a relative basis (versus the assets benchmark) and on an absolute stand-alone basis. You can find more detail on the model and the specific tickers below the charts.
Commentary 10-23-20
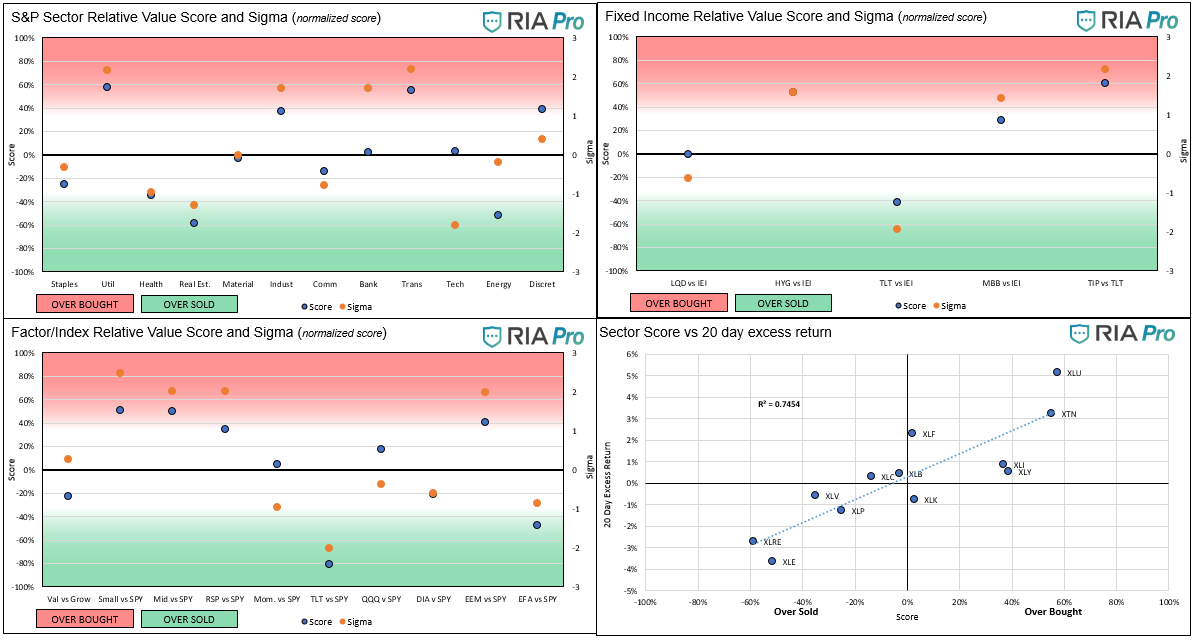
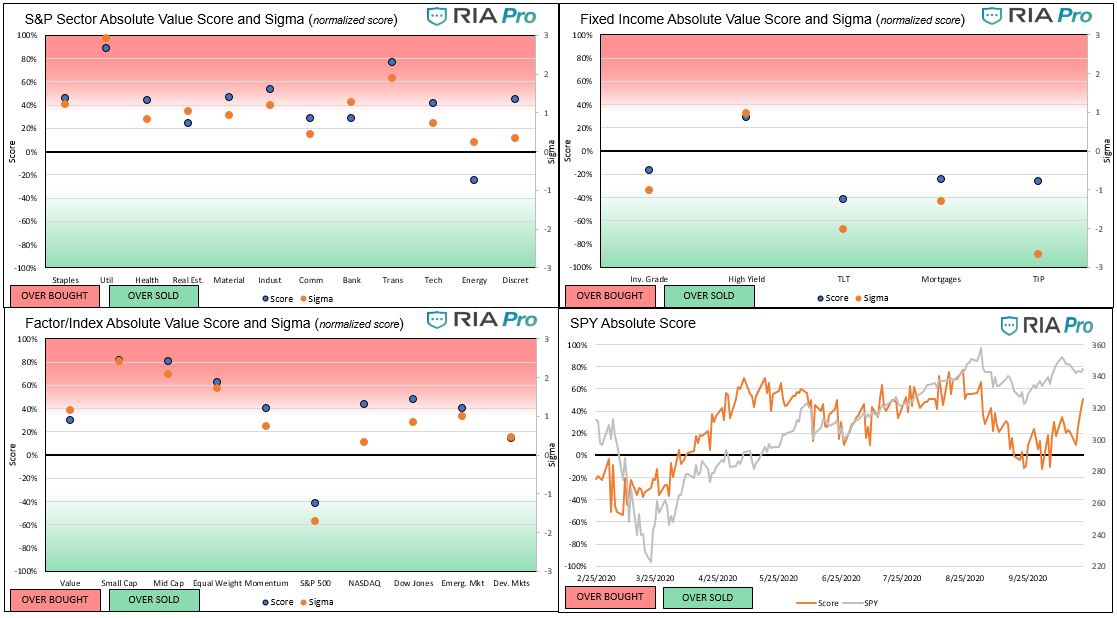
- On a relative value and absolute basis Utilities and Transports are grossly overbought. We reduced our exposure to utilities a week ago and will likely further reduce it shortly. On an absolute basis, Utilities are now registering the highest score (12.02 or 89% of the max) that we have seen over the last few months. Technology (XLK), the prior hot sector, maxed at 10.5 in mid-August. We already have minimal exposure to the transportation sector.
- Financials continue to show signs of life. Its normalized relative score is extended at two standard deviations, but its score is at fair value. The discrepancy is a function of how weak XLF has traded over the last few months. Energy is similar with a sigma at fair value yet a very weak score.
- Real Estate continues to look weak, and given potential credit issues that may come to the forefront in the coming months, we are not tempted to increase exposure. We are being careful in the equity model to avoid commercial real estate REITs.
- Small caps, Midcaps, and emerging markets are moving further into overbought territory as the reflation trade continues. Essentially they are playing catchup to the market.
- Other than the high yield sector, bond asset classes are trending weaker. Given the back up in interest rates, this is not surprising. We suspect rates may go higher but the ceiling is not far away as the economy is overly sensitive to interest rates. To wit, the housing market has been on fire in large part to record-low mortgage rates.
Graphs (Click on the graphs to expand)

Users Guide
The score is a percentage of the maximum/minimum score, as well as on a normalized basis (sigma) for the last 200 trading days. Assets with scores over or under +/-60% and sigmas over or under +/-2 are likely to either consolidate or change trend. When both the score and sigma are above or below those key levels simultaneously, the signal is stronger.
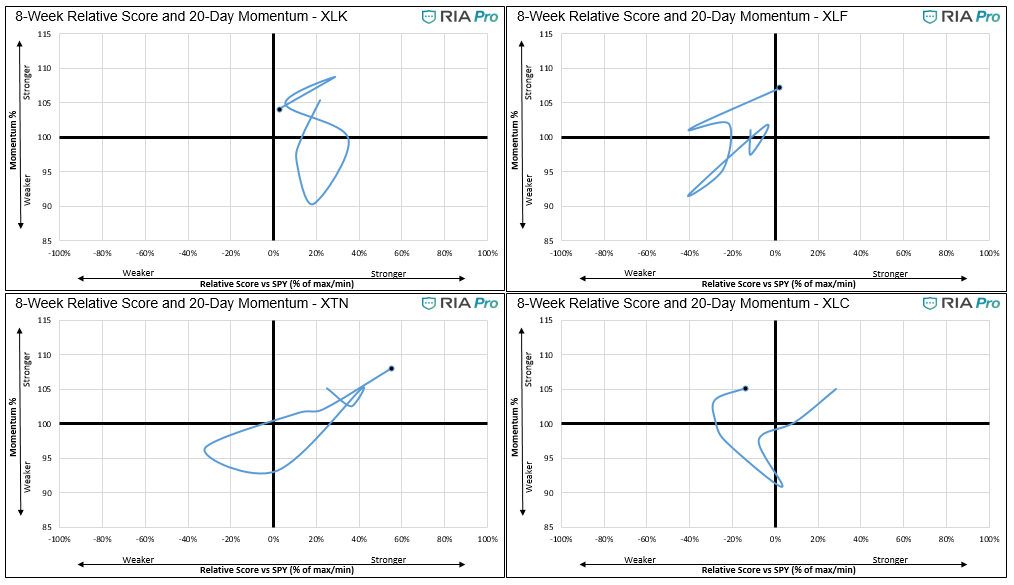
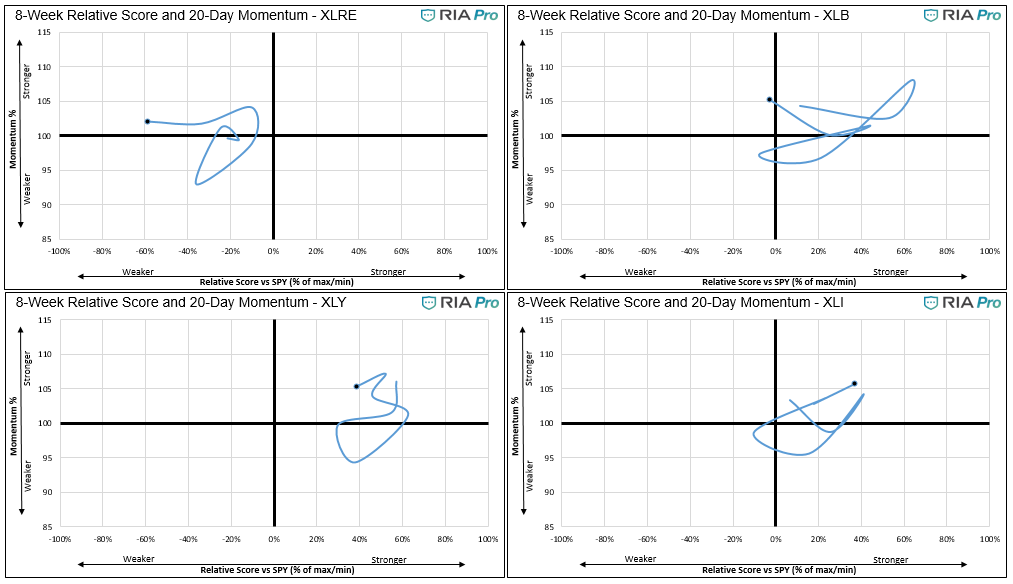
The first set of four graphs below are relative value-based, meaning the technical analysis score and sigma is based on the ratio of the asset to its benchmark. The second set of graphs is computed solely on the price of the asset. Lastly, we present “Sector spaghetti graphs” which compare momentum and our score over time to provide further current and historical indications of strength or weakness. The square at the end of each squiggle is the current reading. The top right corner is the most bullish, while the bottom left corner the most bearish.
The technical value scorecard report is just one of many tools that we use to assess our holdings and decide on potential trades. This report may send a strong buy or sell signal, but we may not take any action if other research and models do not affirm it.
The ETFs used in the model are as follows:
- Staples XLP
- Utilities XLU
- Health Care XLV
- Real Estate XLRE
- Materials XLB
- Industrials XLI
- Communications XLC
- Banking XLF
- Transportation XTN
- Energy XLE
- Discretionary XLY
- S&P 500 SPY
- Value IVE
- Growth IVW
- Small Cap SLY
- Mid Cap MDY
- Momentum MTUM
- Equal Weighted S&P 500 RSP
- NASDAQ QQQ
- Dow Jones DIA
- Emerg. Markets EEM
- Foreign Markets EFA
- IG Corp Bonds LQD
- High Yield Bonds HYG
- Long Tsy Bonds TLT
- Med Term Tsy IEI
- Mortgages MBB
- Inflation TIP


Michael Lebowitz, CFA is an Investment Analyst and Portfolio Manager for RIA Advisors. specializing in macroeconomic research, valuations, asset allocation, and risk management. RIA Contributing Editor and Research Director. CFA is an Investment Analyst and Portfolio Manager; Co-founder of 720 Global Research.
Follow Michael on Twitter or go to 720global.com for more research and analysis.
Customer Relationship Summary (Form CRS)
Also Read


