


The Technical Value Scorecard Report uses 6-technical readings to score and gauge which sectors, factors, indexes, and bond classes are overbought or oversold. We present the data on a relative basis (versus the assets benchmark) and on an absolute stand-alone basis. You can find more detail on the model and the specific tickers below the charts.
Commentary 1-29-21
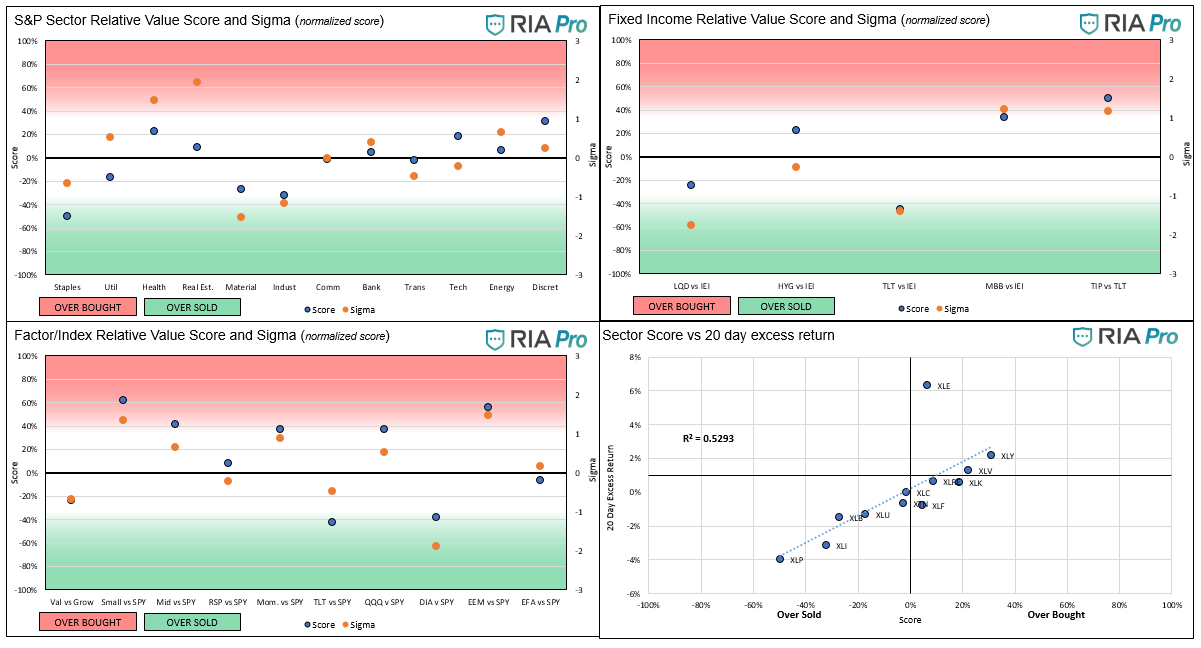
- Over the last two weeks, the well-to-do sectors, in large part, rotated from being overbought to fair value/oversold and vice versa for the once oversold sectors. To wit, Real Estate now has the highest sigma (normalized score), utilities are positive and staples improved markedly from the last few weeks. At the same time materials and industrials are the two weakest sectors. Energy, technology, discretionary, healthcare, and utilities are all perched close to fair value. The recent decline has reduced overbought conditions, but most sectors are still far from being oversold.
- Staples, utilities, and real estate, the most beaten-down sectors versus the S&P 500 in recent weeks, had the highest excess returns this week.
- Small and Mid-Caps, along with emerging markets remain decently overbought versus the S&P 500.
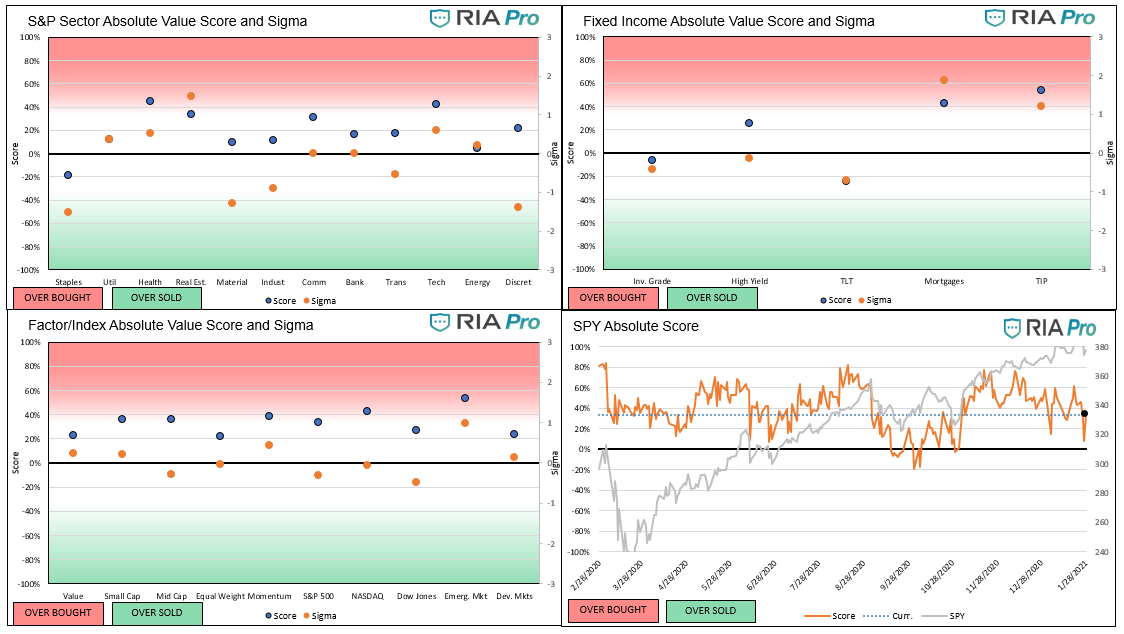
- The Absolute score/sigmas show that most sectors sit around fair value. While Staples are still the weakest sector, they have improved. Real Estate is now the strongest sector on an absolute basis. The factors and indexes are predominately hovering in slightly overbought territory.
- The S&P 500 graph in the lower right on the Absolute charts got close to fair value after Wednesday’s sell off, but it remains moderately over bought with the rebound on Thursday. As shown the S&P has been overvalued since late February except for a brief instance in late September/early October.
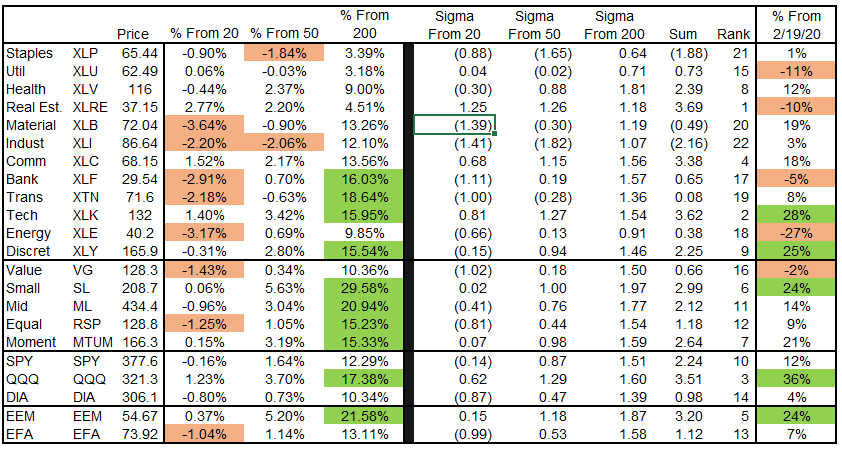
- Even with the sell-off, most sectors remain well above their 200 dma as shown in the third chart. That said, many sectors are below their 20 and 50 dmas. XLI for instance is closing in on 2 standard deviations below its 20 and 50 dmas.
- Its too early to claim the recent sell-off is over, but scores are normalizing. Over the coming week, we will pay close attention to see if these scores deteriorate further. Our other technical indicators point to a similar situation. Wait, watch, and react when appropriate will be our mantra.
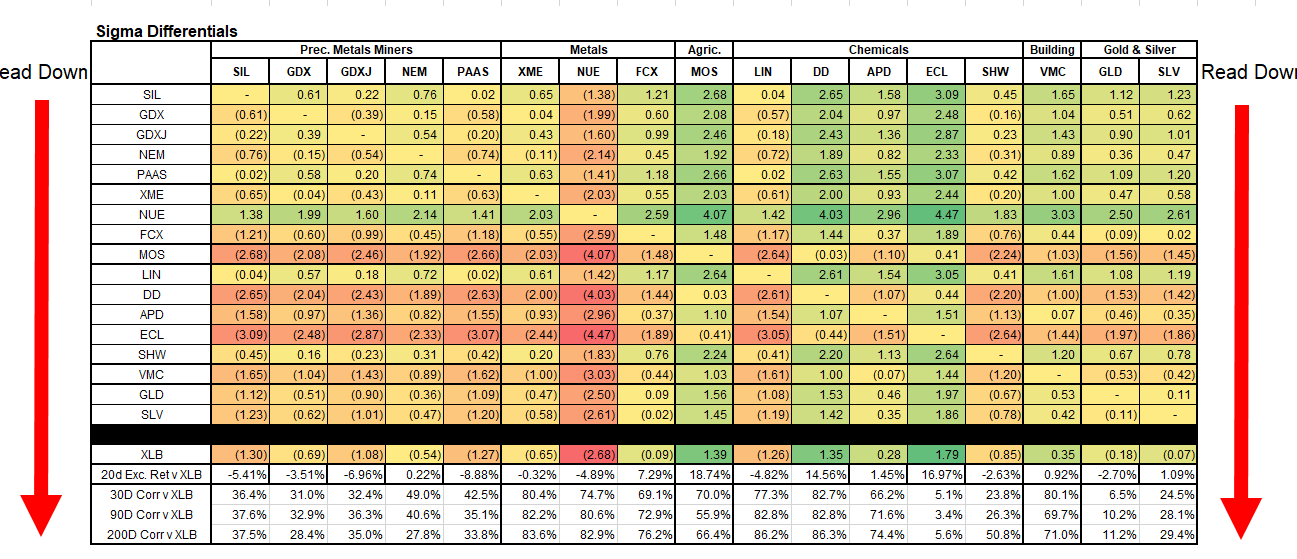
- If this market is to rally back in time and continue to set new highs, it will likely do so on the back of the reflation trade. We include a breakdown of the materials sector to show how various companies in the sector have performed versus XLB, the sector ETF.
Graphs (Click on the graphs to expand)
Users Guide
The score is a percentage of the maximum/minimum score, as well as on a normalized basis (sigma) for the last 200 trading days. Assets with scores over or under +/-60% and sigmas over or under +/-2 are likely to either consolidate or change trend. When both the score and sigma are above or below those key levels simultaneously, the signal is stronger.
The first set of four graphs below are relative value-based, meaning the technical analysis score and sigma is based on the ratio of the asset to its benchmark. The second set of graphs is computed solely on the price of the asset. Lastly, we present “Sector spaghetti graphs” which compare momentum and our score over time to provide further current and historical indications of strength or weakness. The square at the end of each squiggle is the current reading. The top right corner is the most bullish, while the bottom left corner the most bearish.
The technical value scorecard report is just one of many tools that we use to assess our holdings and decide on potential trades. This report may send a strong buy or sell signal, but we may not take any action if other research and models do not affirm it.
The ETFs used in the model are as follows:
- Staples XLP
- Utilities XLU
- Health Care XLV
- Real Estate XLRE
- Materials XLB
- Industrials XLI
- Communications XLC
- Banking XLF
- Transportation XTN
- Energy XLE
- Discretionary XLY
- S&P 500 SPY
- Value IVE
- Growth IVW
- Small Cap SLY
- Mid Cap MDY
- Momentum MTUM
- Equal Weighted S&P 500 RSP
- NASDAQ QQQ
- Dow Jones DIA
- Emerg. Markets EEM
- Foreign Markets EFA
- IG Corp Bonds LQD
- High Yield Bonds HYG
- Long Tsy Bonds TLT
- Med Term Tsy IEI
- Mortgages MBB
- Inflation TIP


Michael Lebowitz, CFA is an Investment Analyst and Portfolio Manager for RIA Advisors. specializing in macroeconomic research, valuations, asset allocation, and risk management. RIA Contributing Editor and Research Director. CFA is an Investment Analyst and Portfolio Manager; Co-founder of 720 Global Research.
Follow Michael on Twitter or go to 720global.com for more research and analysis.
Customer Relationship Summary (Form CRS)
Also Read


