


The Technical Value Scorecard Report uses 6-technical readings to score and gauge which sectors, factors, indexes, and bond classes are overbought or oversold. We present the data on a relative basis, versus the assets benchmark, and on an absolute stand-alone basis.
The score is a percentage of the maximum/minimum score, as well as on a normalized basis (sigma) for the last 200 trading days. Assets with scores over or under +/-60% and sigmas over or under +/-2 are likely to either consolidate or change trend. When both the score and sigma are above or below those key levels simultaneously, the signal is stronger.
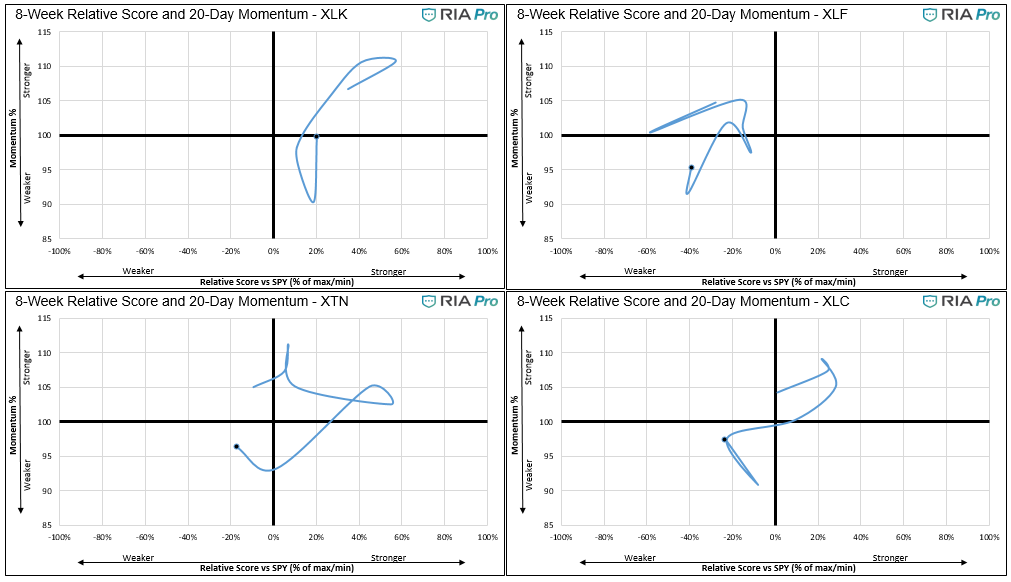
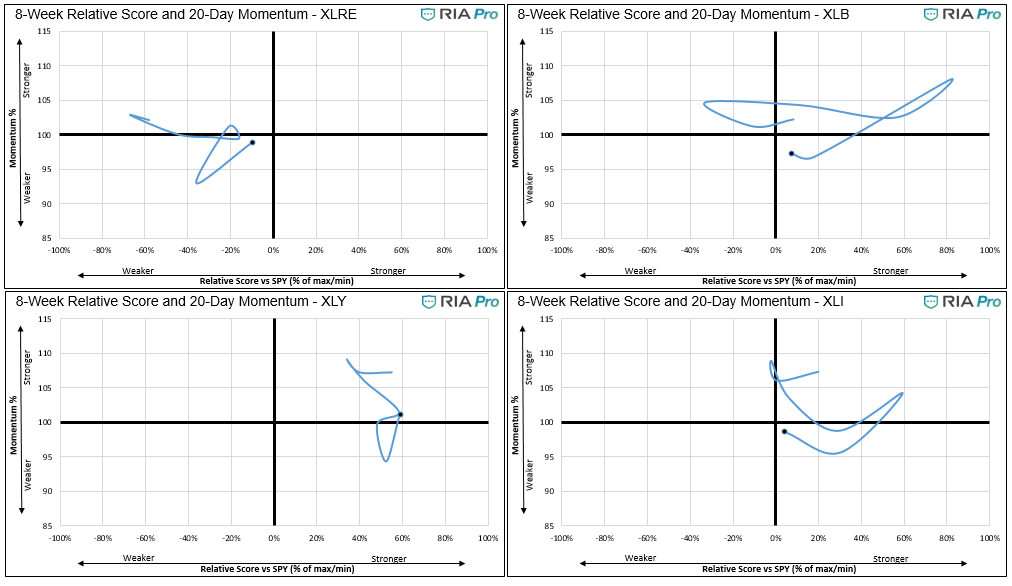
The first set of four graphs below are relative value-based, meaning the technical analysis score and sigma is based on the ratio of the asset to its benchmark. The second set of graphs is computed solely on the price of the asset. Lastly, we present “Sector spaghetti graphs” which compare momentum and our score over time to provide further current and historical indications of strength or weakness. The square at the end of each squiggle is the current reading. The top right corner is the most bullish, while the bottom left corner the most bearish.
This technical value scorecard report is just one of many tools that we use to assess our holdings and decide on potential trades. Just because this report may send a strong buy or sell signal, we may not take any action if it is not affirmed in the other research and models we use.
Commentary 10-02-20
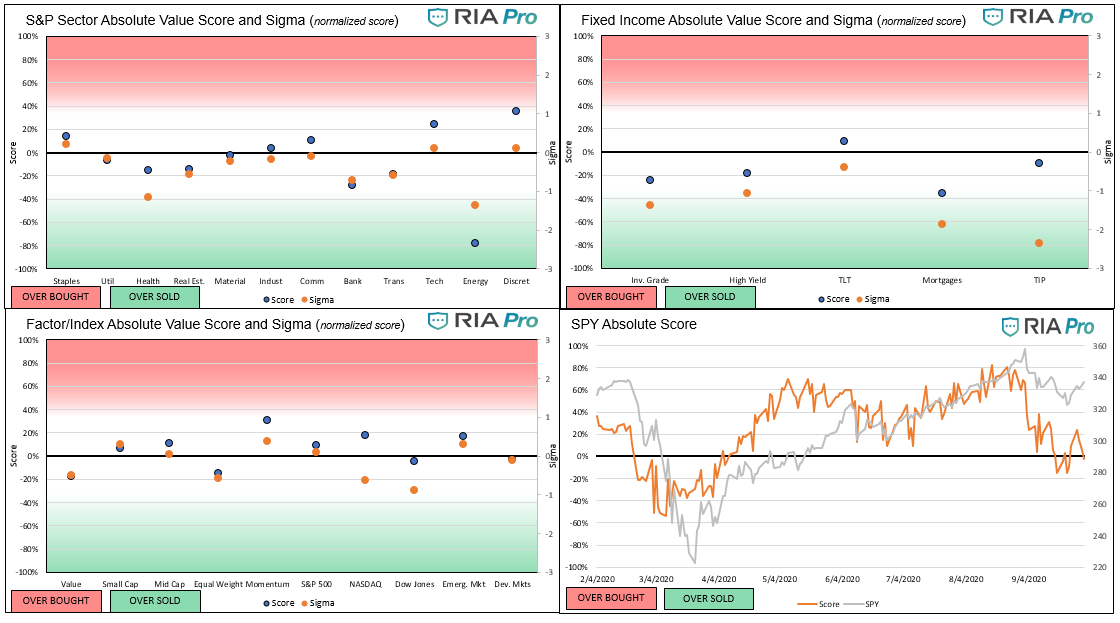
- Market sentiment improved this past week with half the sectors now trading back above their 50-day moving averages.
- The energy sector continues to grossly underperform in both the absolute and relative analysis as shown below. XLE now sits 17% below its 50-day moving average and 28% below the 200-day moving average. The sector and many underlying stocks are clearly cheap but not showing any signs of bottoming at this point.
- On the relative analysis front, Discretionary is the most overbought and energy most oversold. Every other sector is close to fair value on a normalized scoring and regular scoring basis.
- Momentum (MTUM) is the only overbought index and like the sectors, most indexes are hanging near fair value.
- Mortgages continue to trade cheap and corporate bonds have also shown relative weakness versus UST in the last week.
- On an absolute basis, the story is similar. Discretionary and Energy are the two extremes. Discretionary is not as overbought on an absolute basis as a relative, versus the S&P 500, basis.
- The S&P 500 continues to consolidate around fair value.
- The “spaghetti” charts paint a similar picture to the other two sets of charts. Most sectors have slightly weak momentum. XLY and XLU are the only two with positive momentum, albeit minimal.
- Comparing the dot, representing the last weekly data point, to the line allows you to see which sectors weakened and cheapened on a relative basis versus the market. A move to the right is strengthening versus the market and conversely, a shift to the left denotes weakening.
Graphs (Click on the graphs to expand)


The ETFs used in the model are as follows:
- Staples XLP
- Utilities XLU
- Health Care XLV
- Real Estate XLRE
- Materials XLB
- Industrials XLI
- Communications XLC
- Banking XLF
- Transportation XTN
- Energy XLE
- Discretionary XLY
- S&P 500 SPY
- Value IVE
- Growth IVW
- Small Cap SLY
- Mid Cap MDY
- Momentum MTUM
- Equal Weighted S&P 500 RSP
- NASDAQ QQQ
- Dow Jones DIA
- Emerg. Markets EEM
- Foreign Markets EFA
- IG Corp Bonds LQD
- High Yield Bonds HYG
- Long Tsy Bonds TLT
- Med Term Tsy IEI
- Mortgages MBB
- Inflation TIP


Michael Lebowitz, CFA is an Investment Analyst and Portfolio Manager for RIA Advisors. specializing in macroeconomic research, valuations, asset allocation, and risk management. RIA Contributing Editor and Research Director. CFA is an Investment Analyst and Portfolio Manager; Co-founder of 720 Global Research.
Follow Michael on Twitter or go to 720global.com for more research and analysis.
Customer Relationship Summary (Form CRS)
Also Read


