


The Technical Value Scorecard Report uses 6-technical readings to score and gauge which sectors, factors, indexes, and bond classes are overbought or oversold. We present the data on a relative basis, versus the assets benchmark, and on an absolute stand-alone basis.
The score is a percentage of the maximum/minimum score, as well as on a normalized basis (sigma) for the last 200 trading days. Assets with scores over or under +/-60% and sigmas over or under +/-2 are likely to either consolidate or change trend. When both the score and sigma are above or below those key levels simultaneously, the signal is stronger.
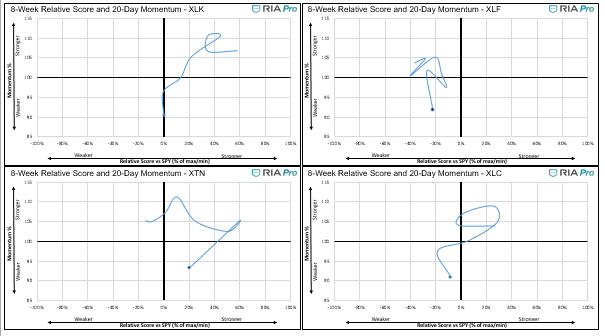
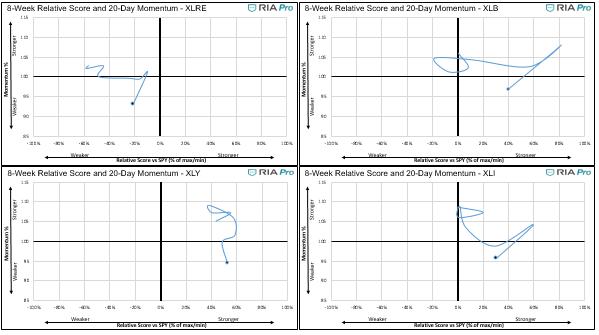
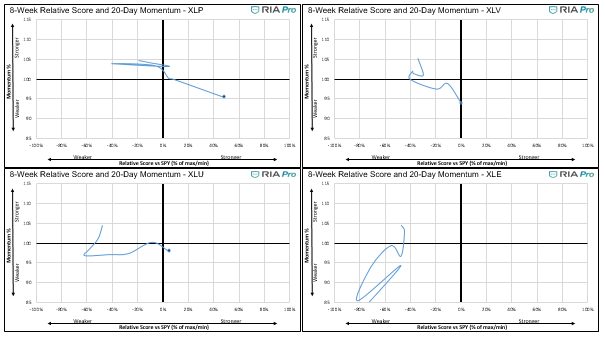
The first set of four graphs below are relative value-based, meaning the technical analysis score and sigma is based on the ratio of the asset to its benchmark. The second set of graphs is computed solely on the price of the asset. Lastly, we present “Sector spaghetti graphs” which compare momentum and our score over time to provide further current and historical indications of strength or weakness. The square at the end of each squiggle is the current reading. The top right corner is the most bullish, while the bottom left corner the most bearish.
This technical value scorecard report is just one of many tools that we use to assess our holdings and decide on potential trades. Just because this report may send a strong buy or sell signal, we may not take any action if it is not affirmed in the other research and models we use.
Commentary 09-25-20
- We are going to work backward through the analysis this week to show the changes that occurred over the last week.
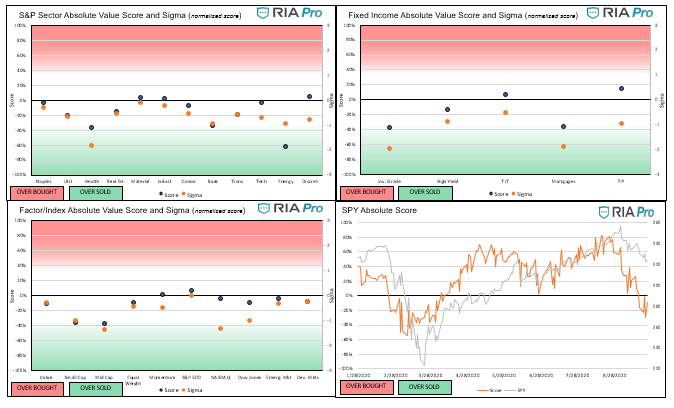
- As shown in the “spaghetti” charts below, all S&P sectors are now in one of the two bottom quadrants. None of them appear to be stabilizing or trying to turn higher. We will keep an eye out for sectors moving toward the bottom right quadrant in an upward fashion.
- Staples, discretionary, materials, and industrials remain the most overbought sectors despite reducing some frothiness last week. The reflationary recovery is being called into doubt, which if it continues, could spell trouble for the recently high flying materials and industrials sectors.
- On a relative basis, energy and possibly the technology sectors are the only overbought industries.
- All 12 sectors are below their respective 50 day moving averages and 4 have now fallen below their 200-day averages.
- Mid-cap and small-caps appear to be the most overbought factors, while the more “value” oriented sectors continue to outperform.
- On an absolute basis, every sector is now fairly valued or slightly oversold. The only exception is energy which remains grossly oversold. Energy is certainly due for a bounce, but we offer caution as it has remained overbought and technically very weak for a long time.
- The S&P 500 is sitting just below fair value. It has reduced some of its overbought condition but appears to have more downside before we would be comfortable buying it. This should not be surprising as it is still over 4% above its 200-day moving average.
Graphs (Click on the graphs to expand)

The ETFs used in the model are as follows:
- Staples XLP
- Utilities XLU
- Health Care XLV
- Real Estate XLRE
- Materials XLB
- Industrials XLI
- Communications XLC
- Banking XLF
- Transportation XTN
- Energy XLE
- Discretionary XLY
- S&P 500 SPY
- Value IVE
- Growth IVW
- Small Cap SLY
- Mid Cap MDY
- Momentum MTUM
- Equal Weighted S&P 500 RSP
- NASDAQ QQQ
- Dow Jones DIA
- Emerg. Markets EEM
- Foreign Markets EFA
- IG Corp Bonds LQD
- High Yield Bonds HYG
- Long Tsy Bonds TLT
- Med Term Tsy IEI
- Mortgages MBB
- Inflation TIP


Michael Lebowitz, CFA is an Investment Analyst and Portfolio Manager for RIA Advisors. specializing in macroeconomic research, valuations, asset allocation, and risk management. RIA Contributing Editor and Research Director. CFA is an Investment Analyst and Portfolio Manager; Co-founder of 720 Global Research.
Follow Michael on Twitter or go to 720global.com for more research and analysis.
Customer Relationship Summary (Form CRS)
Also Read


