


“How do you trade this off-the-charts bull market?”
That was an email question I got last week that deserves a deeper explanation.
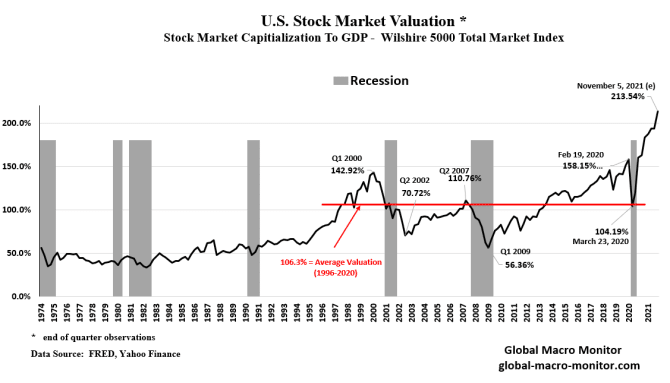
However, let me start with an excellent note from Global Macro Monitor, ironically entitled “The Off-The-Charts Bull Market.”
“Bezos, Musk, and Branson (BMB) are not the only ones recently touching the earth’s thermosphere for a brief and shining moment. Take a look at today’s stock market valuation. Note the structural shift, which took place around 1995. Before the mid-1990s, valuations traded in a nonvolatile range of around 50 percent of GDP.
Lots happened in the 1990s, the internet, the return of the emerging markets post debt crisis, the rise of China (probably the most important factor), the end of the Cold War, and some massive sovereign bailouts.
We get the trade, as we do in Crypto, but we do dare ask if valuations can continue to defy gravity. Or, will they get forced back to earth?”
The belief, currently, is that the massive reservoir of liquidity from both Governments and Central Banks can keep valuations inflated.
The unknown question, of course, is for “how long.”
So, back to our email question, how do we trade this “off-the-charts” bull market?
The Problem With Valuations
In the short term, all that matters is price. As we have discussed in “Pet Rocks & Other Signs:”
Valuations are a terrible market timing indicator. However, in the short term valuations tell you everything about market psychology. In the long term, they tell you everything about expected returns.
Currently, every measure of valuation suggests investors have thrown all “caution to the wind.”
As noted, valuations are a reflection of investor psychology. Currently, at 40x earnings (Shiller’s CAPE ratio), there is little argument that investors are just about as bullish as they can get.
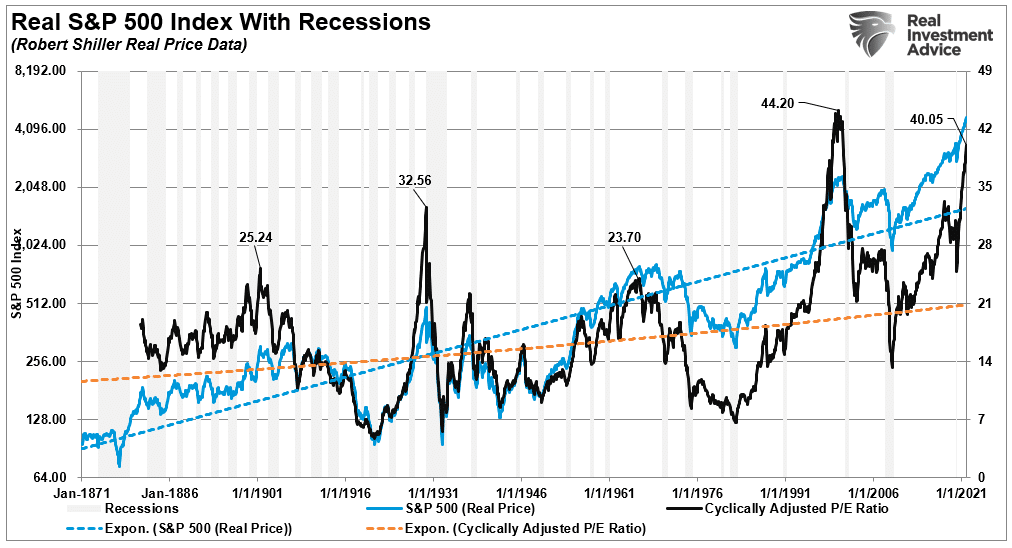
Looking at the chart, it indeed suggests that investors should be selling everything immediately. However, given this is monthly data, these turns can take much longer than expected.
It is this “lag” that leads investors in the short-term to believe that “valuations” no longer matter. Such is a dangerous assumption and one that investors paid dearly for in the past. Valuations do matter, and they matter a lot.

Navigating WIth Technical Analysis
When it comes to technical analysis, there are millions of different ways to approach it. In addition, there are millions of combinations of technical indicators that investors use to try and decipher market movements.
I am only going to discuss with you how we do it.
Notably, technical analysis does NOT predict the future. It is the study of historical price action, which is the purest representation of the psychology of market participants. From that study, we can make statistical observations about the behavior of market participants in the past. Those assumptions can help form a “guess,” assuming similar variables, about how they may act in the near term.
We keep our analysis very simplistic for our portfolio management needs. We use one indicator to signify if prices are overbought or sold, two moving averages to determine the trend of prices, and Bollinger bands to warn of significant deviations from those moving averages. I show the technical setup in the sample chart below from RIAPRO.NET.

We are looking for either “warning signs” that stocks could be due for a short to intermediate-term corrective period. Or, indications they are oversold and ready to advance. Currently, we are dealing with the former.
Historically, when prices move into the “red zone,” or 3-standard deviations above the 50-day moving average (dma), the Williams %R is overbought, and the MACD is crossing lower from a high level, stock prices usually correct to some degree.
Such is the environment we are dealing with currently. It is also why we suggested raising cash and reducing risk over the last couple of weeks.

Let The Market Tell You
Commandment #1: “Thou Shall Not Trade Against the Trend.” – James P. Arthur Huprich
Let me be very clear, we are discussing risk management. It is vitally important you understand the overall trend of the market, and when it is changing.
Currently, we are in a “bull market” advance. As such, we want to maintain our exposure to equity risk. However, such does not mean we should simply ignore what the market is telling us and let the ebbs and flows wash over us. Eventually, an “ebb” will become a flood of selling when the levy breaks.
When that trend changes from positive to negative, we will need to be solely defensive.
“In a bull market, you can be either long or neutral. In a bear market, you can only be neutral or short.” – Dennis Gartman
While the market could certainly pull back to the lower of those “bands,” so far, corrections remain confined to the 50-dma. As such the bullish trend remains constant.
Therefore, with the overbought condition and sell signals in place, we are holding a bit more cash. However, when the current correction process ends, and those signals reverse, we will increase our exposure accordingly. Such is when the odds of investment success significantly improve.
“Willingness and ability to hold funds uninvested while awaiting real opportunities is a key to success in the battle for investment survival.” – Gerald Loeb
This “Off-The-Charts” Bull Market Is Not New
The following chart, like valuations, is monthly data, so it is very slow to move. Such makes it less valuable for short-term risk management but tells you much about the long-term. The upper band is the Relative Strength Index (RSI). Whenever the monthly RSI was above 70, such was near more critical peaks of the market.
However, it was a substantially more critical signal when that extreme overbought gets combined with a market significantly deviated from its long-term moving average (arrows). The MACD in the lower panel also tells us the same.
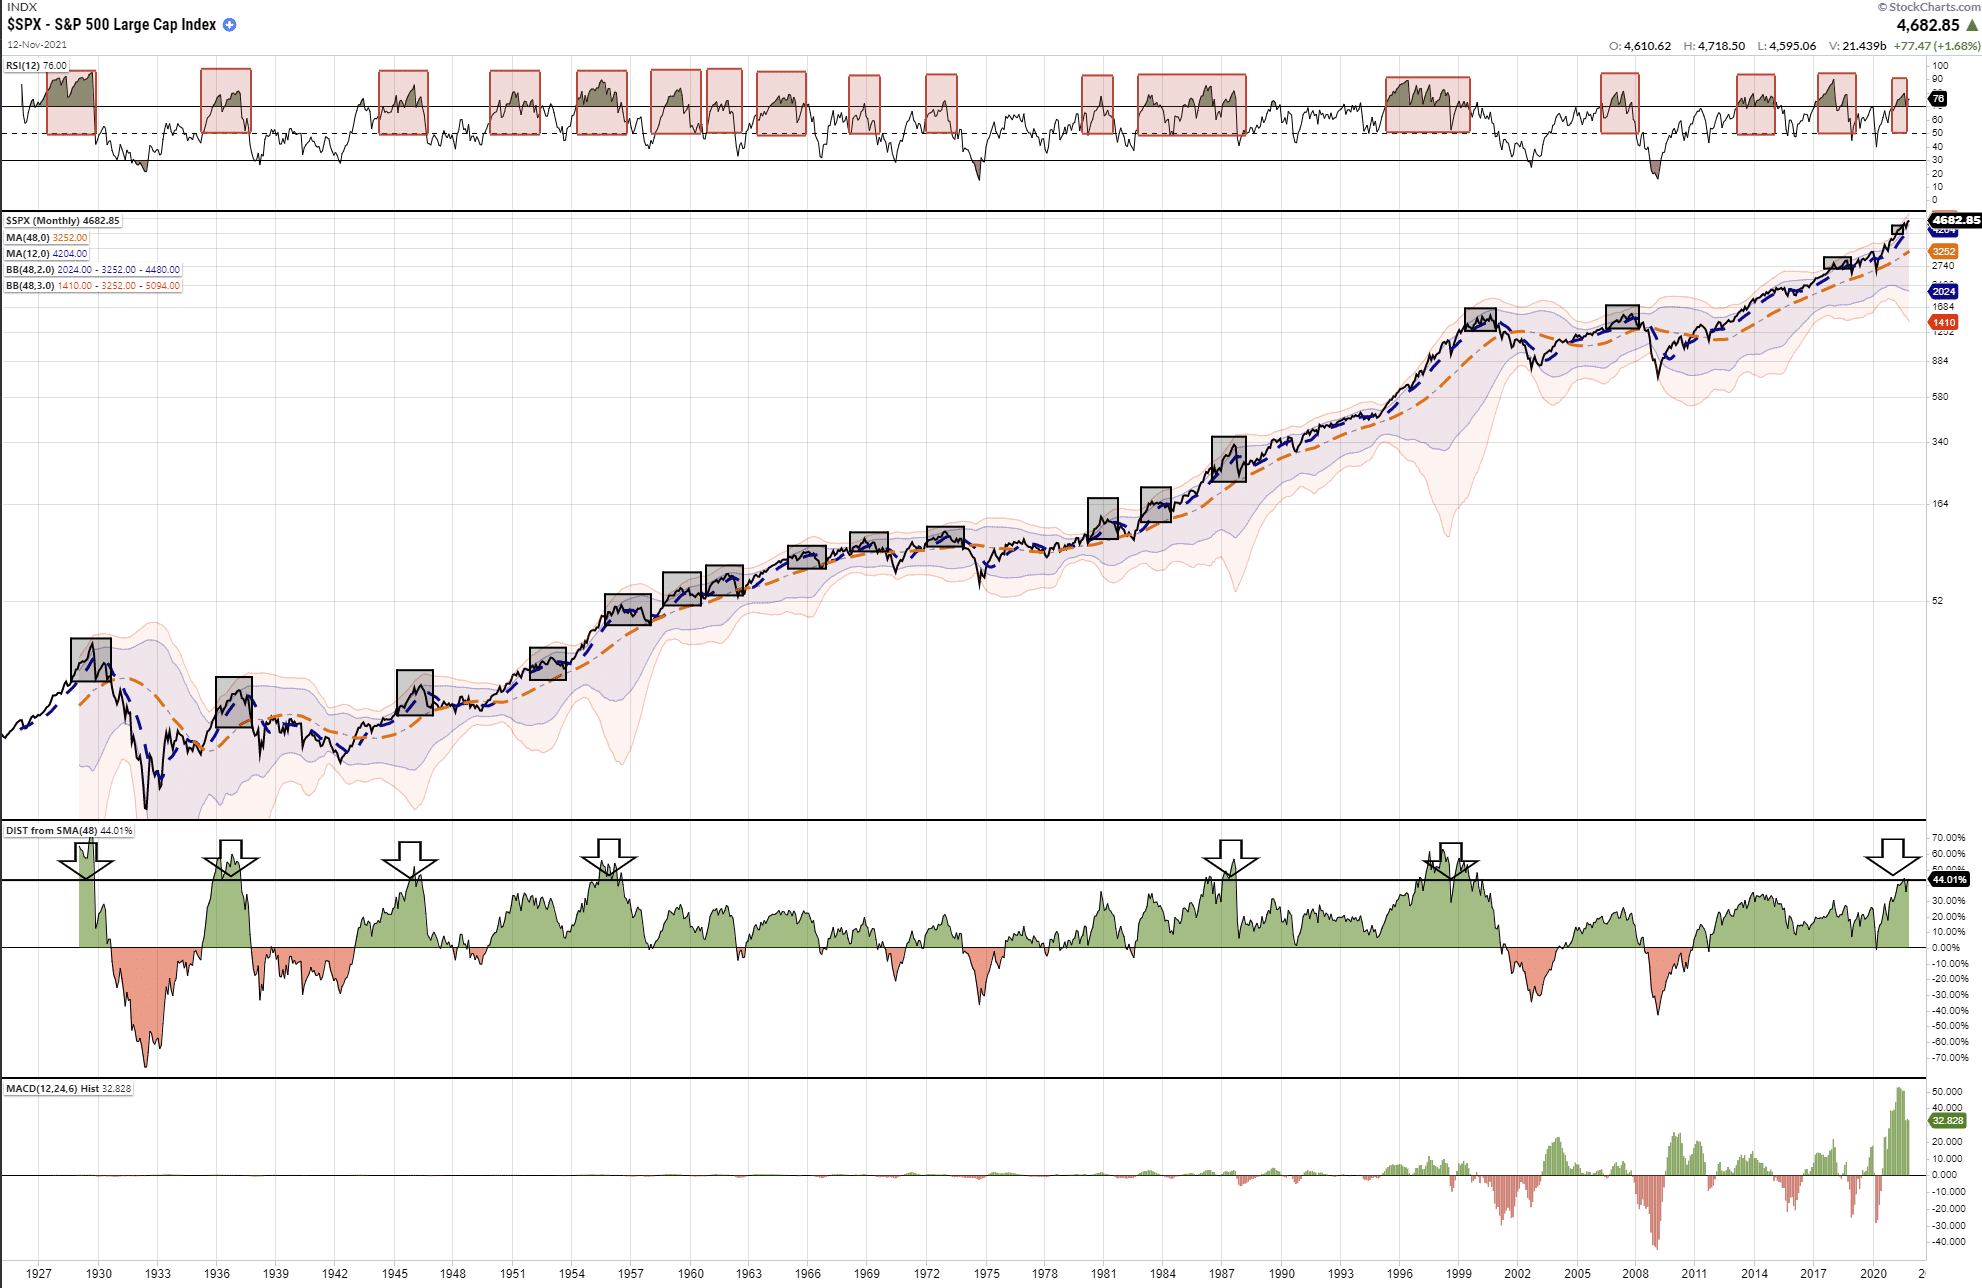
Does this mean this “off-the-charts” bull market is about to crash? Maybe. But markets can remain irrational much longer than you think. Such is why were are trading this “bull market” carefully and applying our risk-management rules regularly.
While many believe “this time is different,” there is a lot of history from a “technical perspective” that suggests it is not.
As a portfolio manager, I don’t have the luxury to “guess” at an outcome. Instead, I must navigate the waters in which we currently sail and avoid the rocks ahead.

Surviving The “Off-The Charts” Bull Market
Regardless of whether you believe fundamentals will ever matter again is irrelevant. What is essential is that periods of excess speculation always end the same way.
If you are one of our younger readers, who have never lived through a “bear market,” I wouldn’t believe what I am telling you either.
However, after watching the Crash of ’87, managing money through 2000 and 2008, and navigating the “Great Crash of 2020,” I can tell you the signs are all there.
A real bear market will happen. When? I don’t have a clue.
But it will be an unexpected, exogenous event that triggers the selling.
It always appears easiest at the top. But, at the bottom, retail investors want to “get out” at any price.
Historically, the environment we are living in currently has not worked out well for investors. However, in the short term, the “irrationality” will last long enough to convince you “this time is different.” As Warren Buffett once quipped:
“The market is a lot like sex, it feels best at the end.”
We continue to trade the “off-the-charts” bull market much the same way you pick up a porcupine; very carefully.
For us, that means putting a spin on Warren’s quote:
“If you engage in the market in an unprotected fashion, you may not want the unexpected surprise.”


Lance Roberts is a Chief Portfolio Strategist/Economist for RIA Advisors. He is also the host of “The Lance Roberts Podcast” and Chief Editor of the “Real Investment Advice” website and author of “Real Investment Daily” blog and “Real Investment Report“. Follow Lance on Facebook, Twitter, Linked-In and YouTube
Customer Relationship Summary (Form CRS)
Also Read


