


The economy has marched forward, ignoring higher interest rates and consistent calls for a recession. Credit goes to “We The People,” the citizens of the U.S. A shout-out also goes to Uncle Sam for showering us with trillions of dollars of stimulus during the pandemic to fuel consumption.
Understanding why the economy has done so well is easy. Simply massive stimulus drove consumption. The difficult task ahead is forecasting how much the remnants of stimulus, and other forms of financial relief, will continue to fortify personal consumption and boost economic activity.
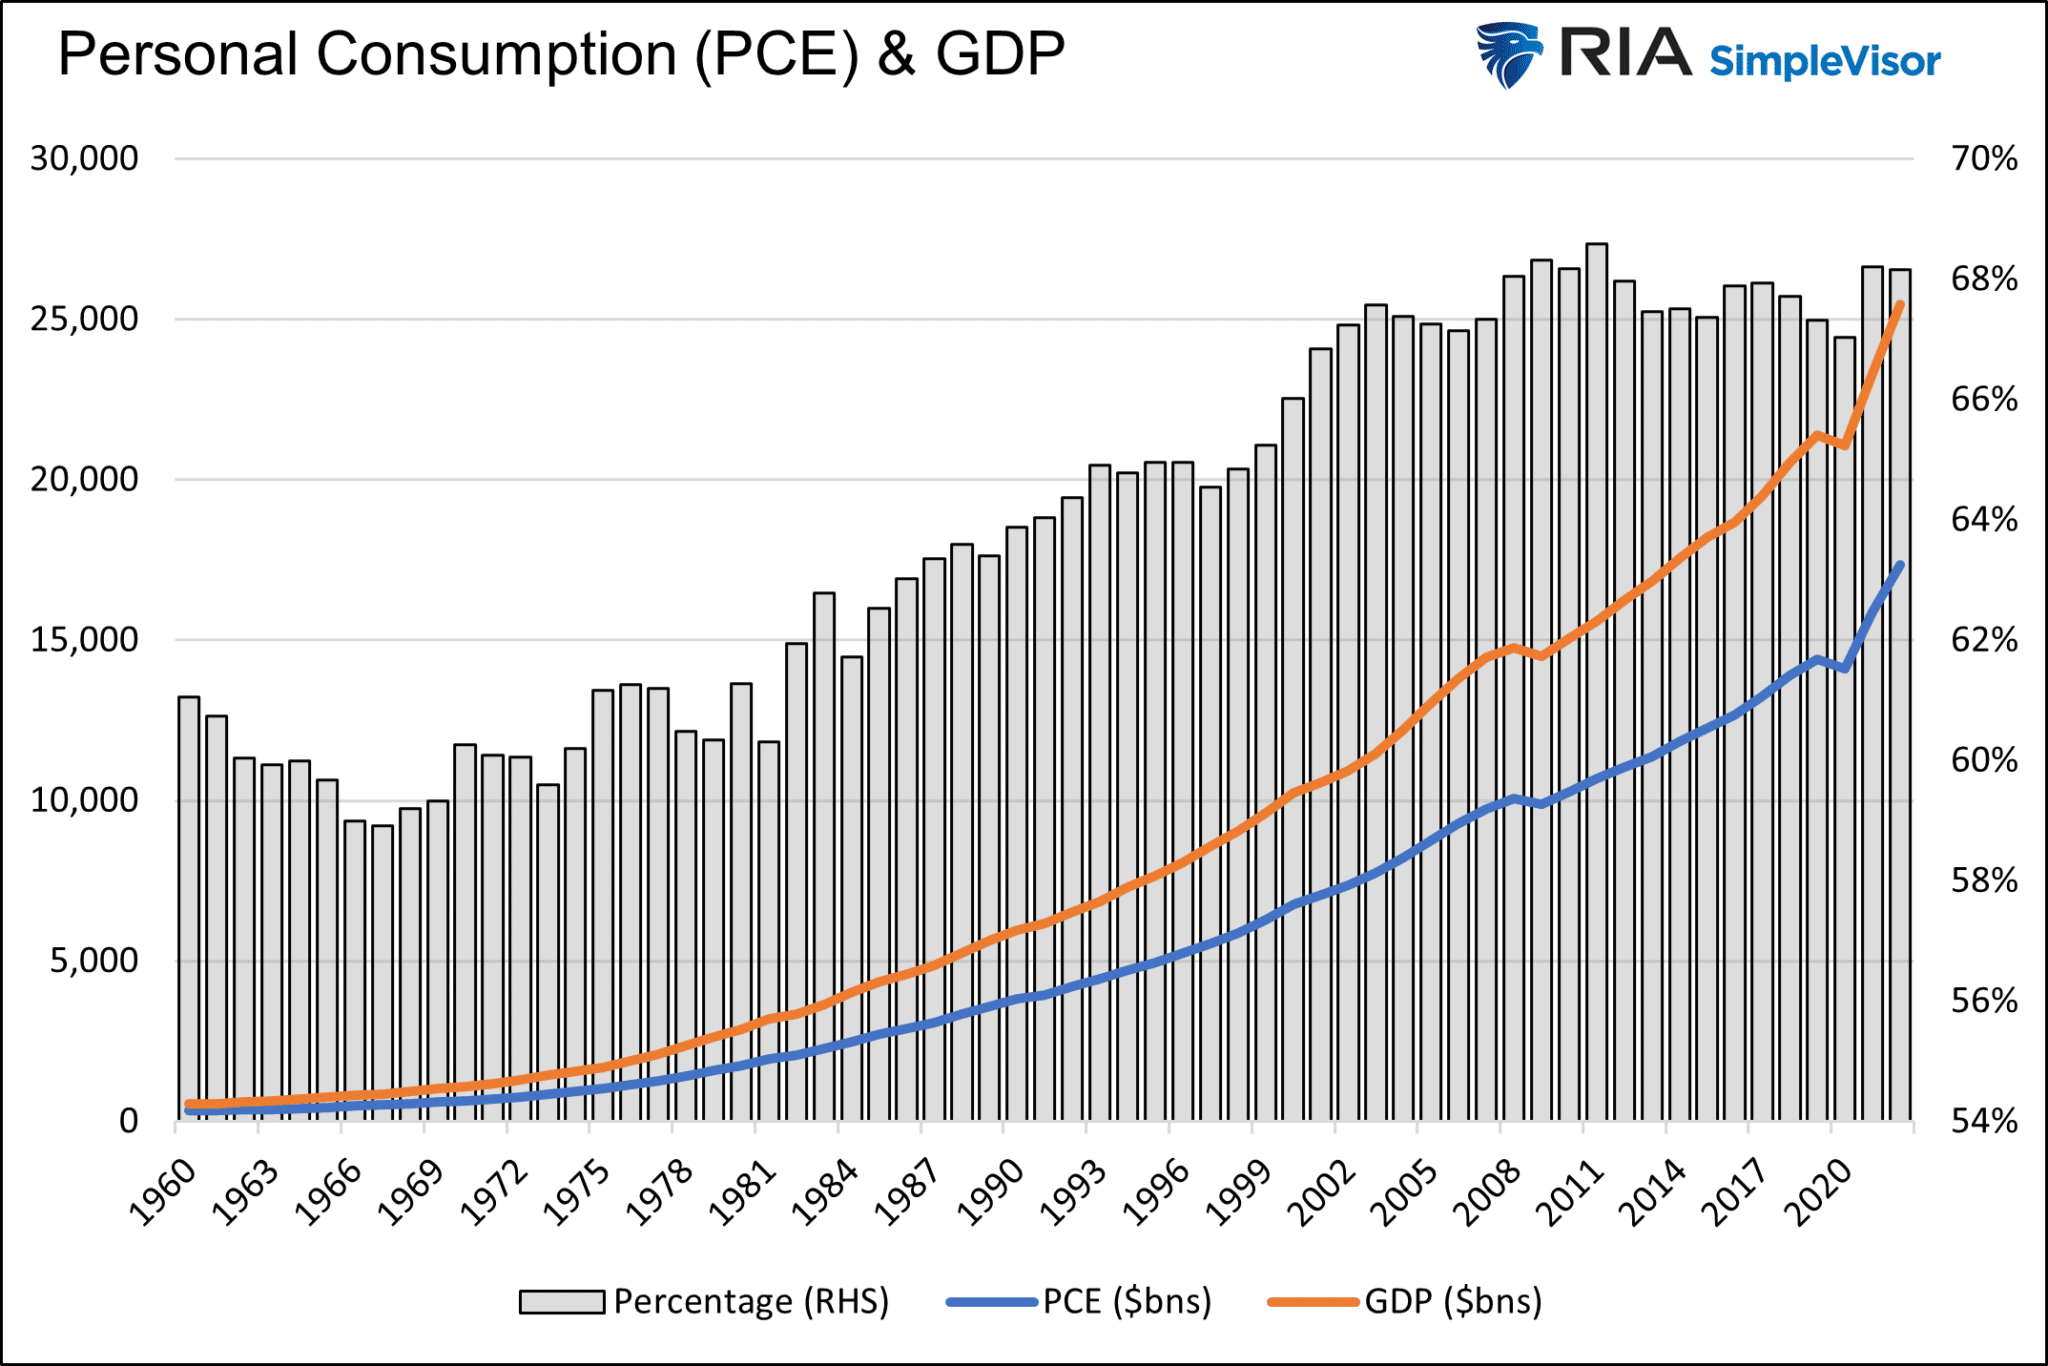
Personal consumption growth rates are showing signs of fatigue. Given personal consumption consistently accounts for over two-thirds of economic activity, it’s worth exploring that state of the consumer to appreciate better what the economy may have in store.

Consumption
Before exploring the means by which consumers can spend, let’s review some of the more popular economic statistics that focus on personal consumption. Such allows us to put recent trends in a historical perspective.
Retail Sales is one of the most widely followed reports tracking consumer spending. As shown below, retail sales are tracking well above the pre-pandemic trend (red dotted line). The green bars show excess sales, or the amount above the trend.
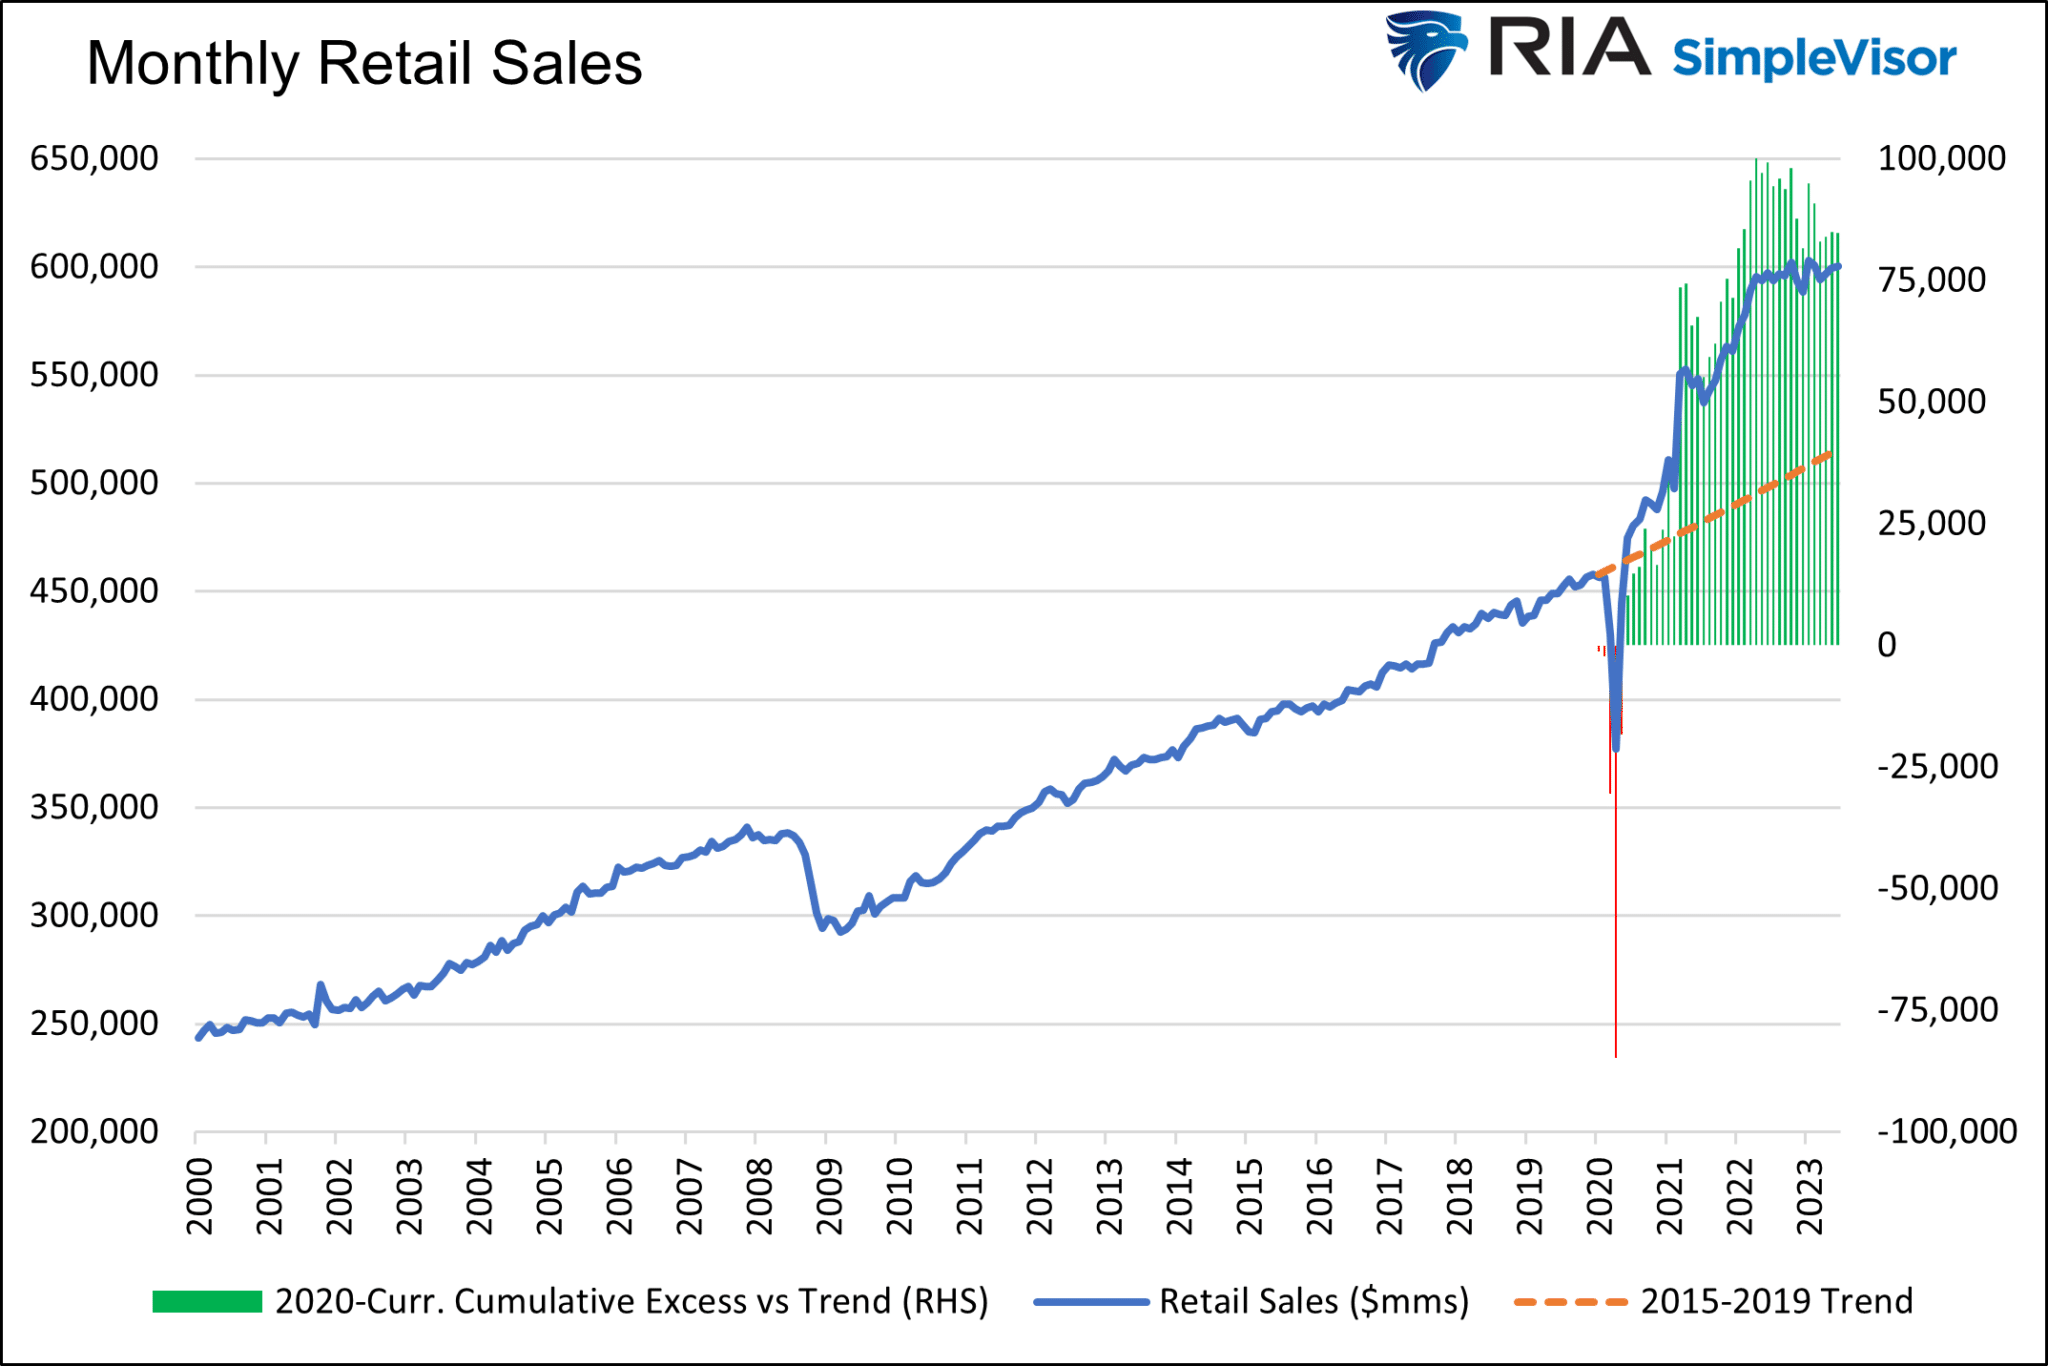
As we project economic growth, we must concern ourselves with growth rates and not absolute levels of economic activity. Therefore, the growth rate of retail sales matters much more than the total sales shown above.
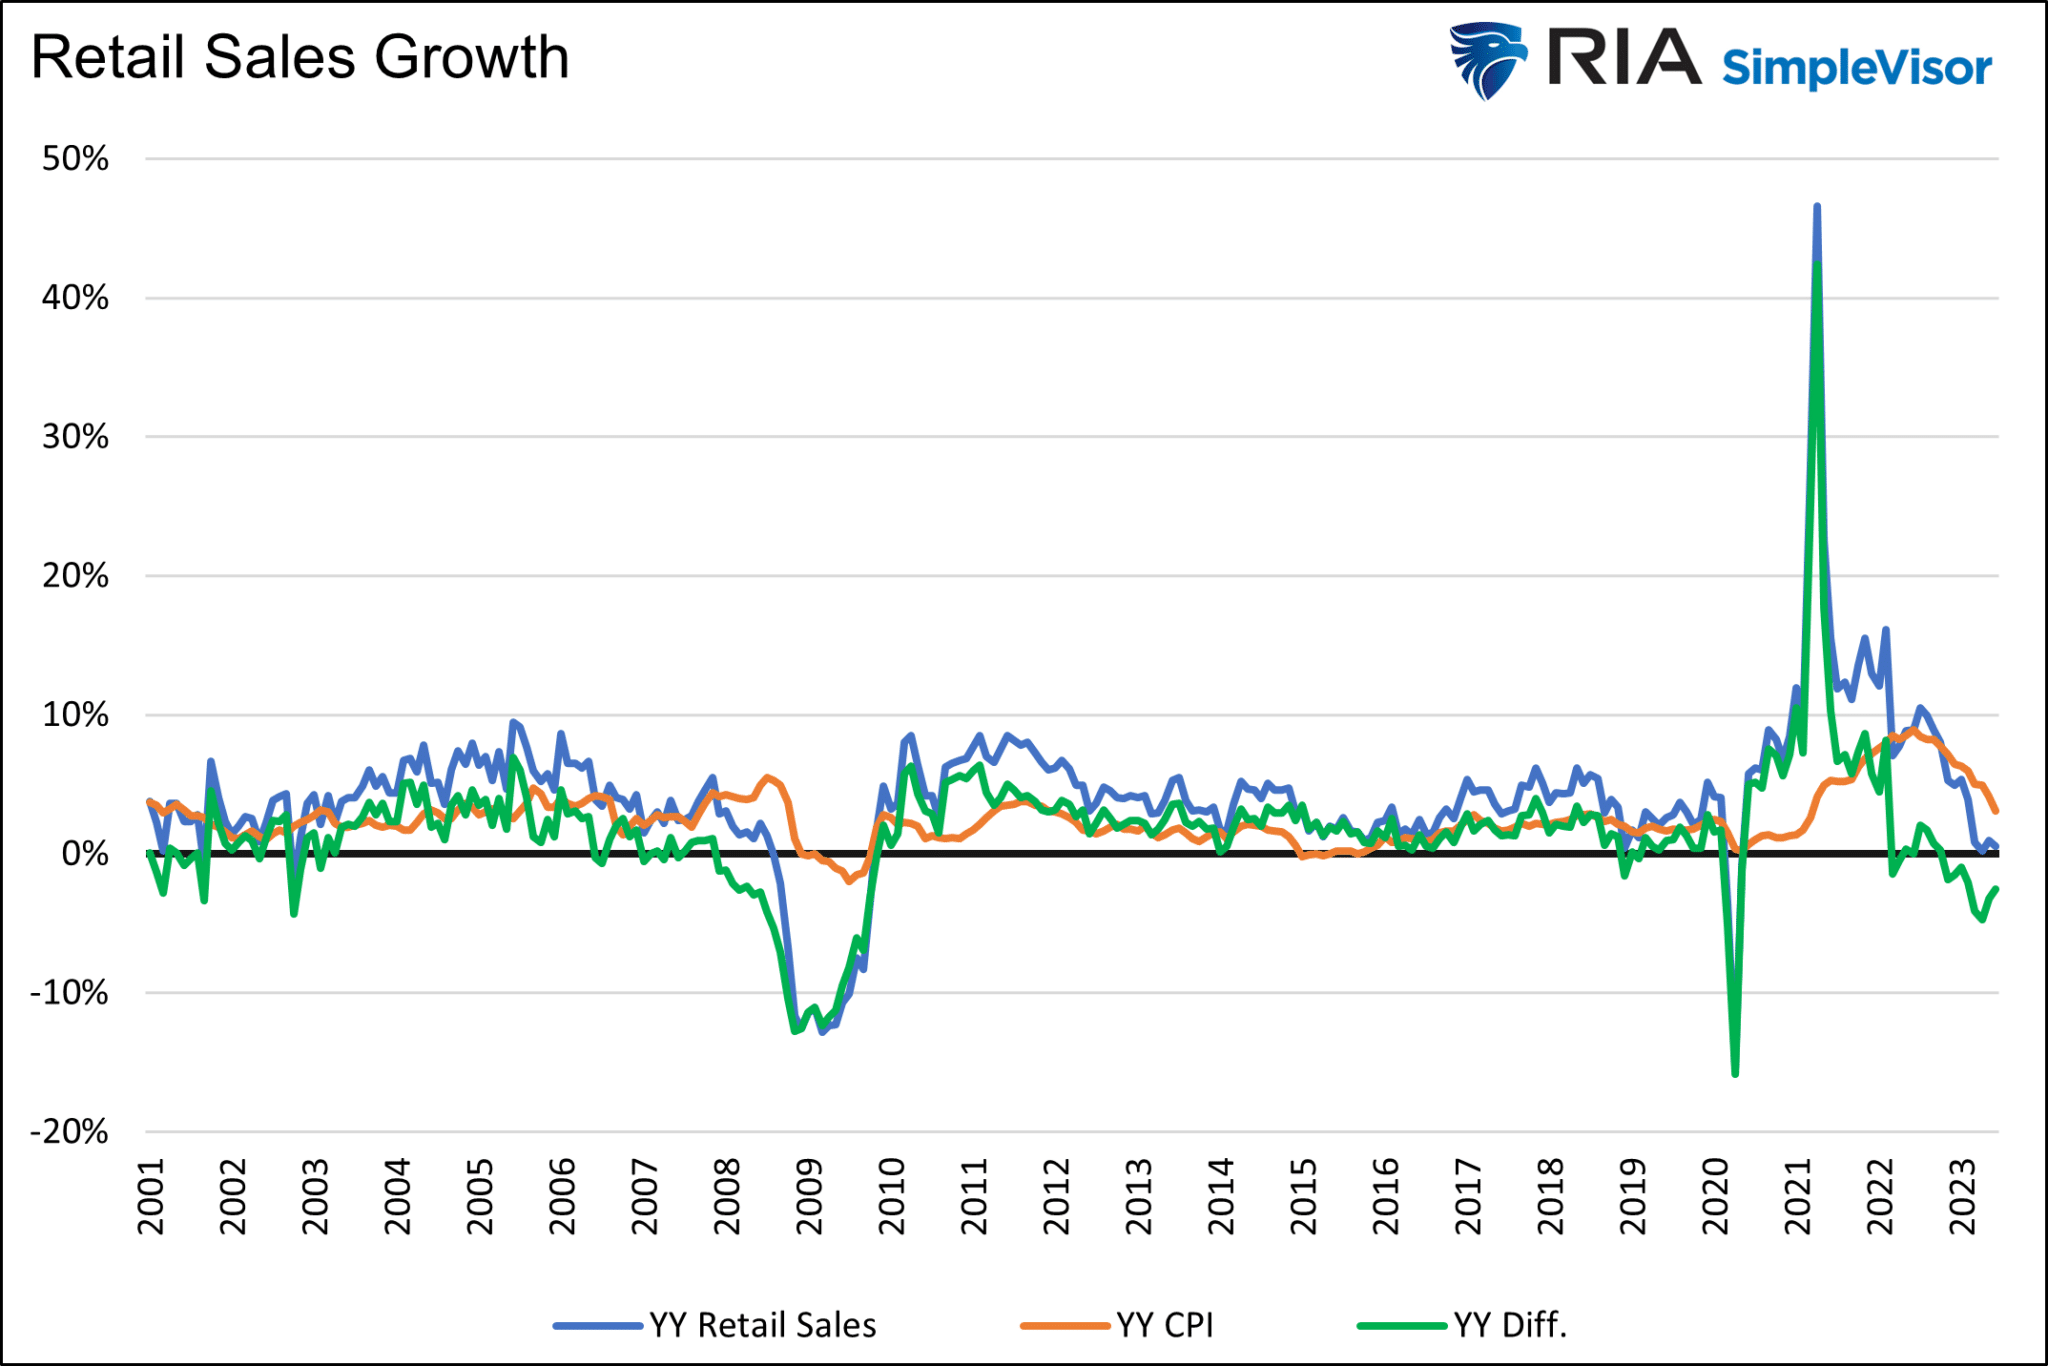
The graph below sheds a less rosy light on retail sales than the one above. The year-over-year growth rate in retail sales is near zero percent. Accounting for inflation, retail sales are falling 2-4% annually. Since the start of the year, retail sales have fallen by half a percent and two percent below where they would be based on the pre-pandemic trend growth.
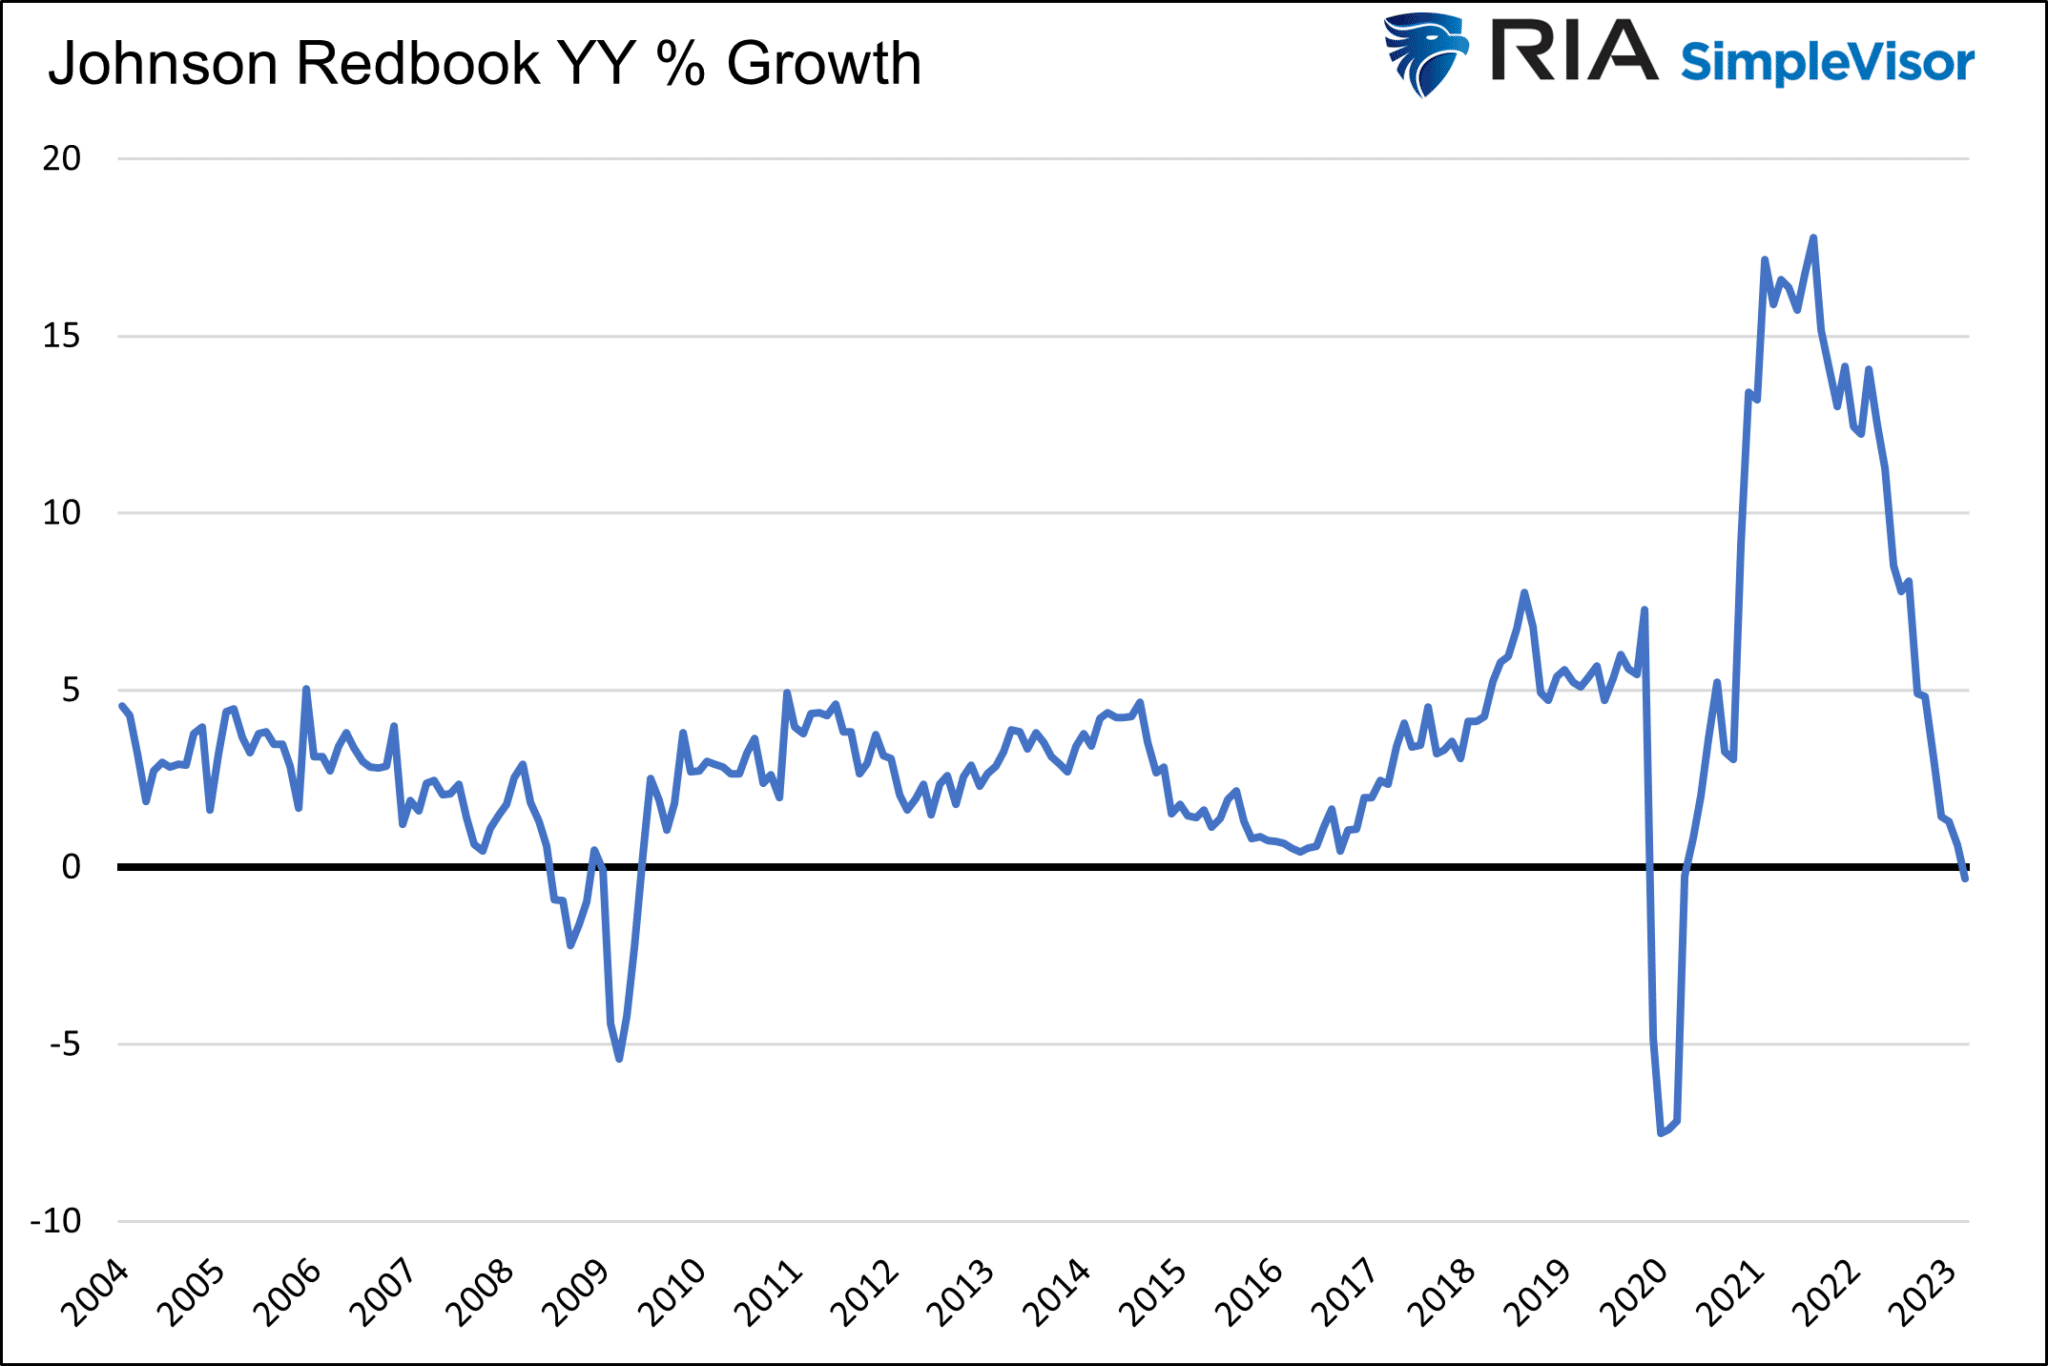
Johnson Redbook, a weekly private measure of retail sales, confirms the recent weakness in retail sales growth.
Consumption (PCE)
While the graphs above show stagnant to negative retail sales growth, personal consumption expenditure (PCE), the measure used to compute GDP, is still above trend.
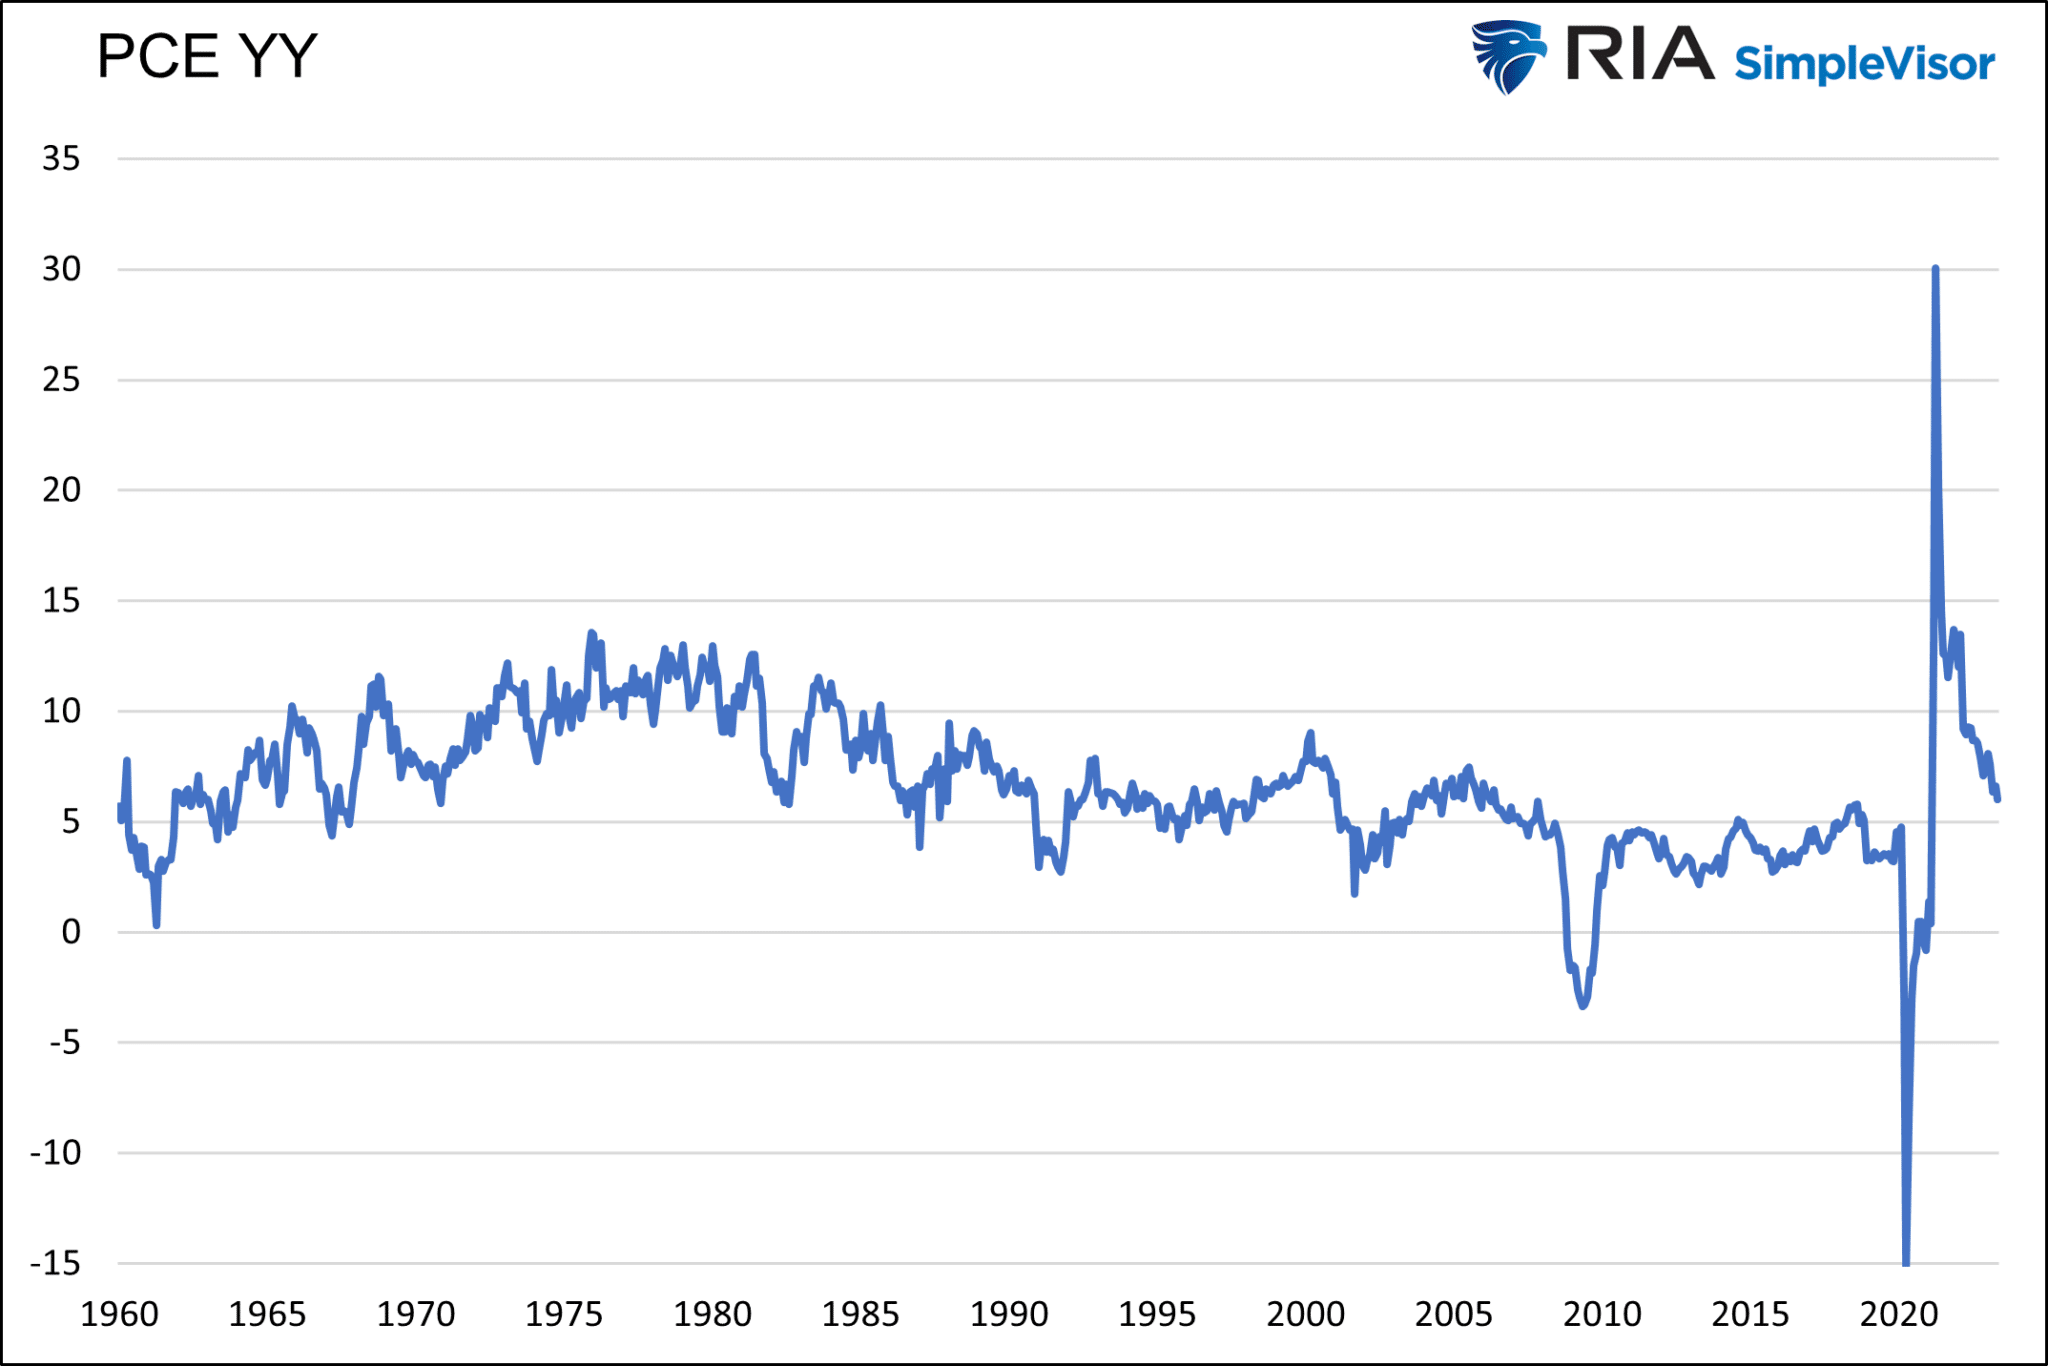
Unlike Retail Sales and Johnson Redbook, PCE includes the sales of services.
Spending in the service sectors, such as travel, leisure, and restaurants, has recently grown disproportionately faster than most other goods and services. Some claim that post-pandemic “revenge” spending is still in play!
In the first year of the pandemic, goods sales increased by 21% while services fell by 2%. Since then, the performance has been almost the exact opposite, with goods consumption falling by 2.75% and services rising by 22%.
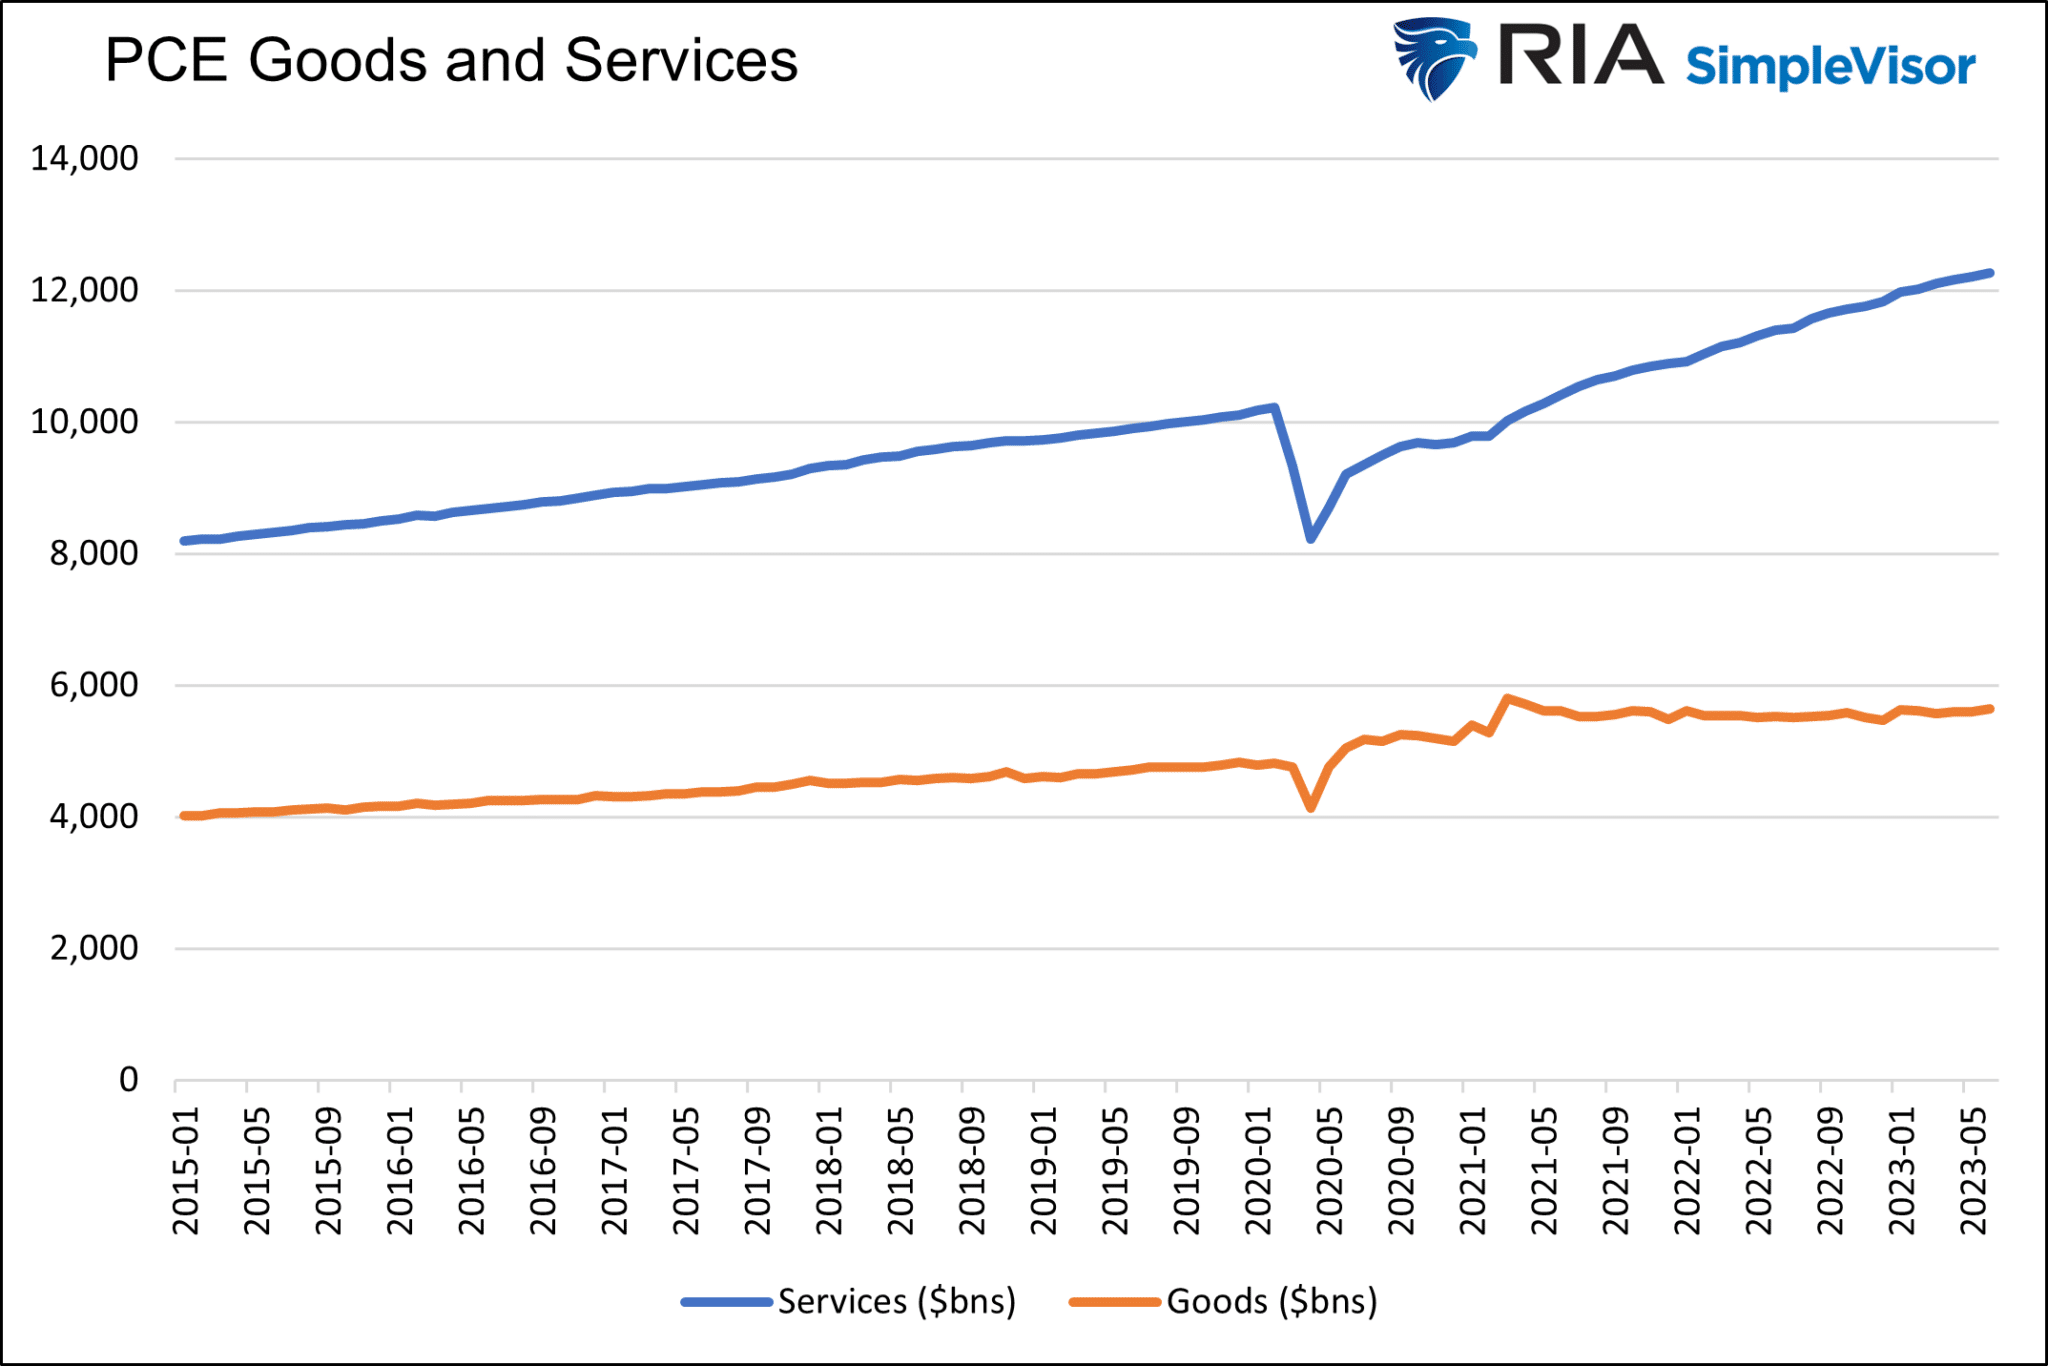
With spending on goods flat-lining, the services sectors will be a crucial gauge to estimate the health of consumer spending.

Means to Consume
With an appreciation for the post-pandemic spending trends, it’s worth appreciating the means of allowing consumers to spend.
During the pandemic, the federal government rained money on the public and provided various other forms of financial benefits and relief.
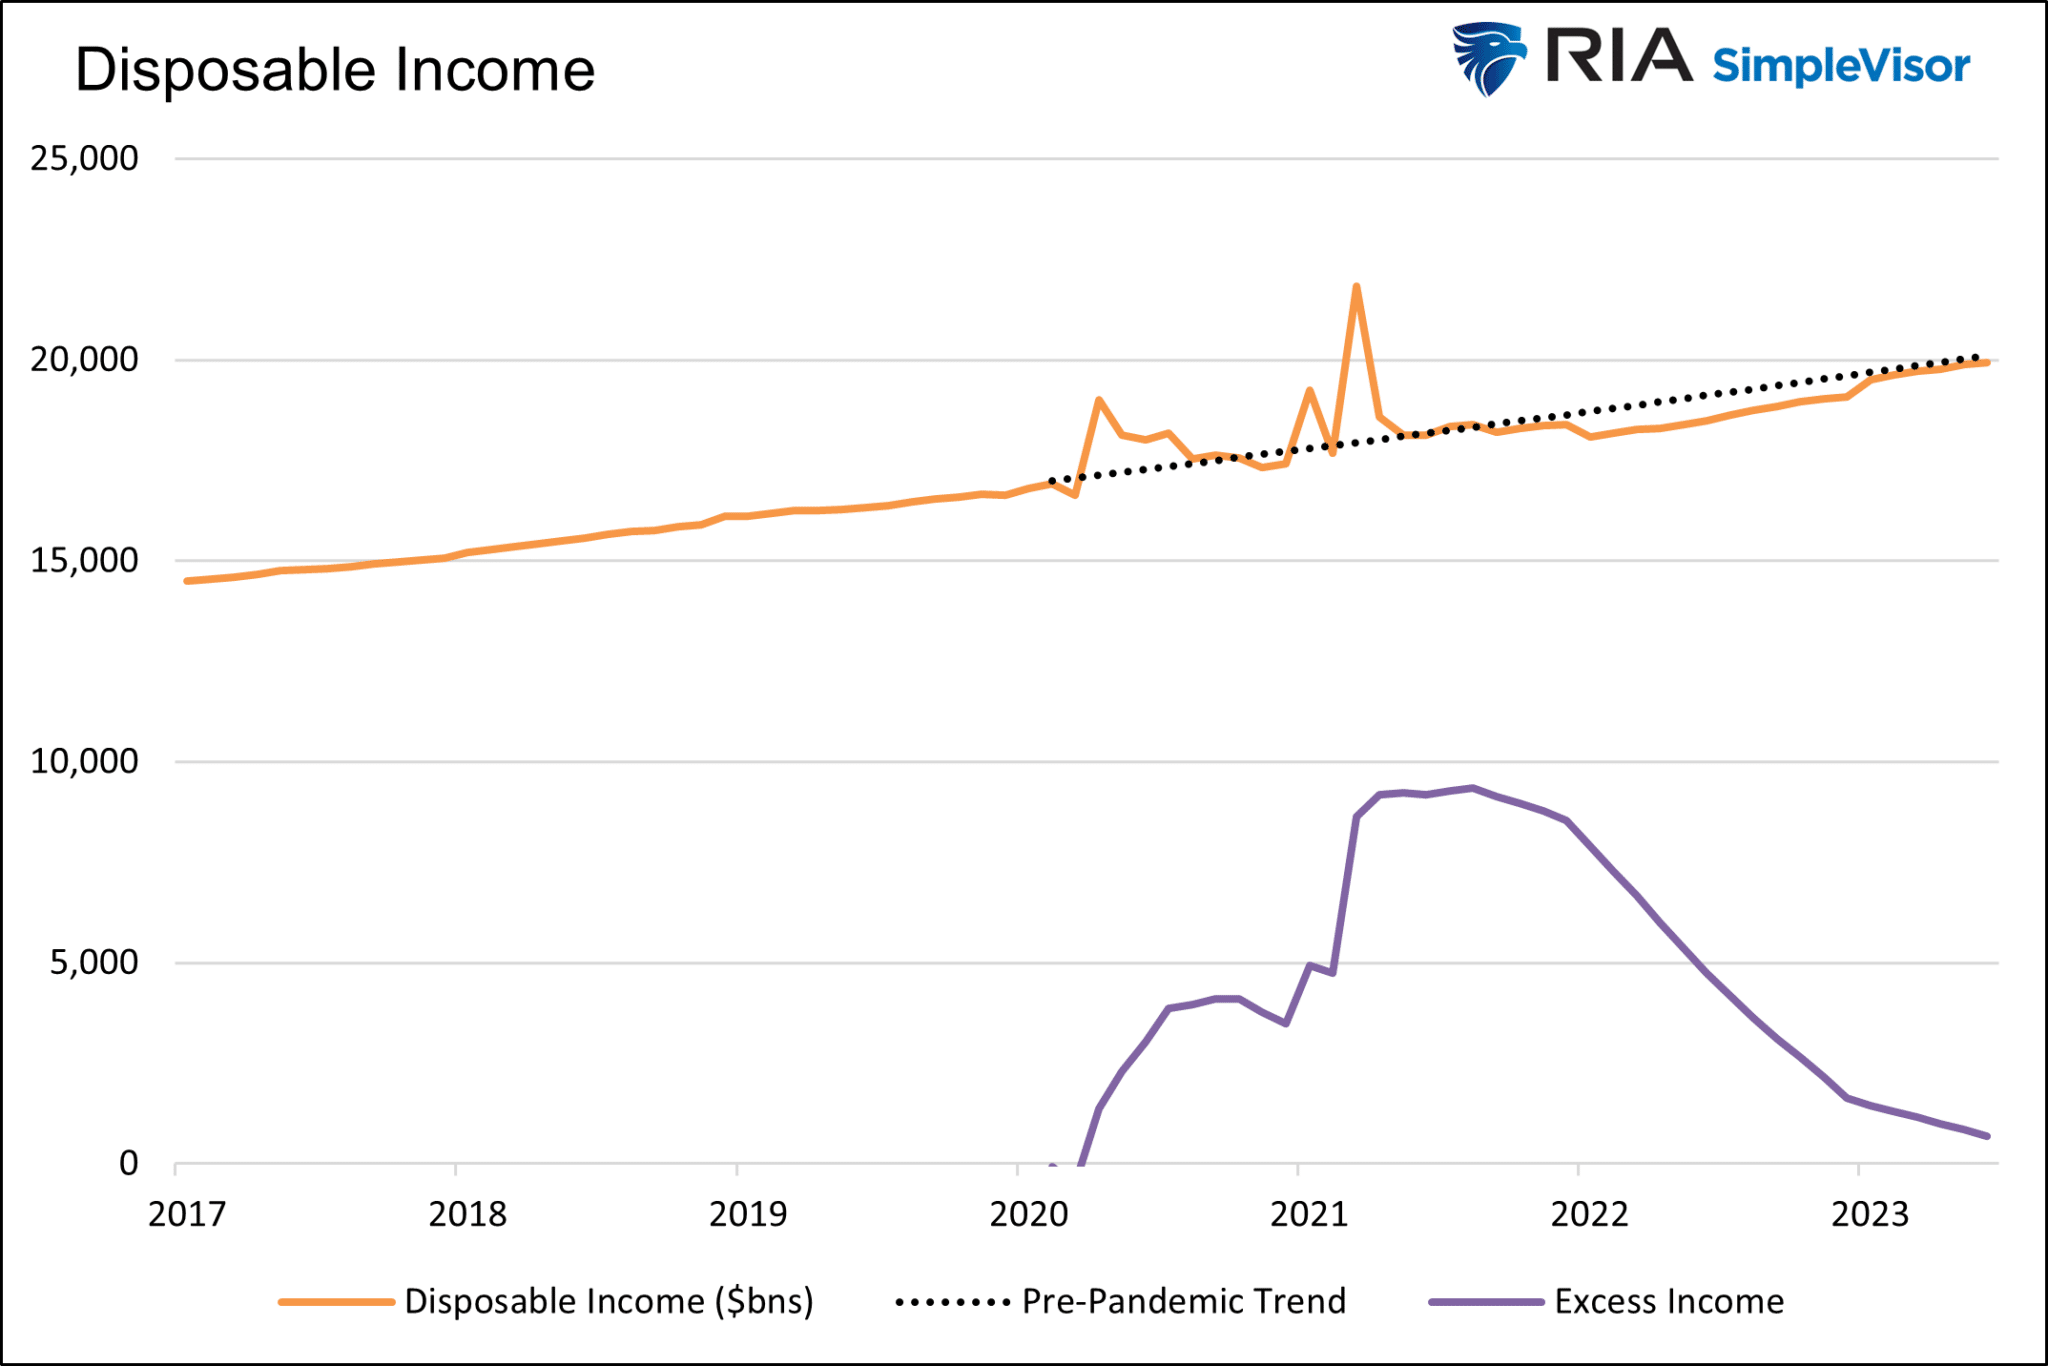
The graph below shows spikes in disposable income related to the two pandemic relief payments from the government. It also shows that disposable income has trended slightly below average after those payments. The purple line shows cumulative disposable income versus the trend. As it approaches zero, the excess pandemic-related income above trend vanishes.
The following graph shows the after-inflation growth in average salaries and aggregate salaries. The average wage has been below the inflation rate for almost two years. The aggregate of all salaries is higher. Such is a function of the number of employees growing and offsetting negative real wage growth.
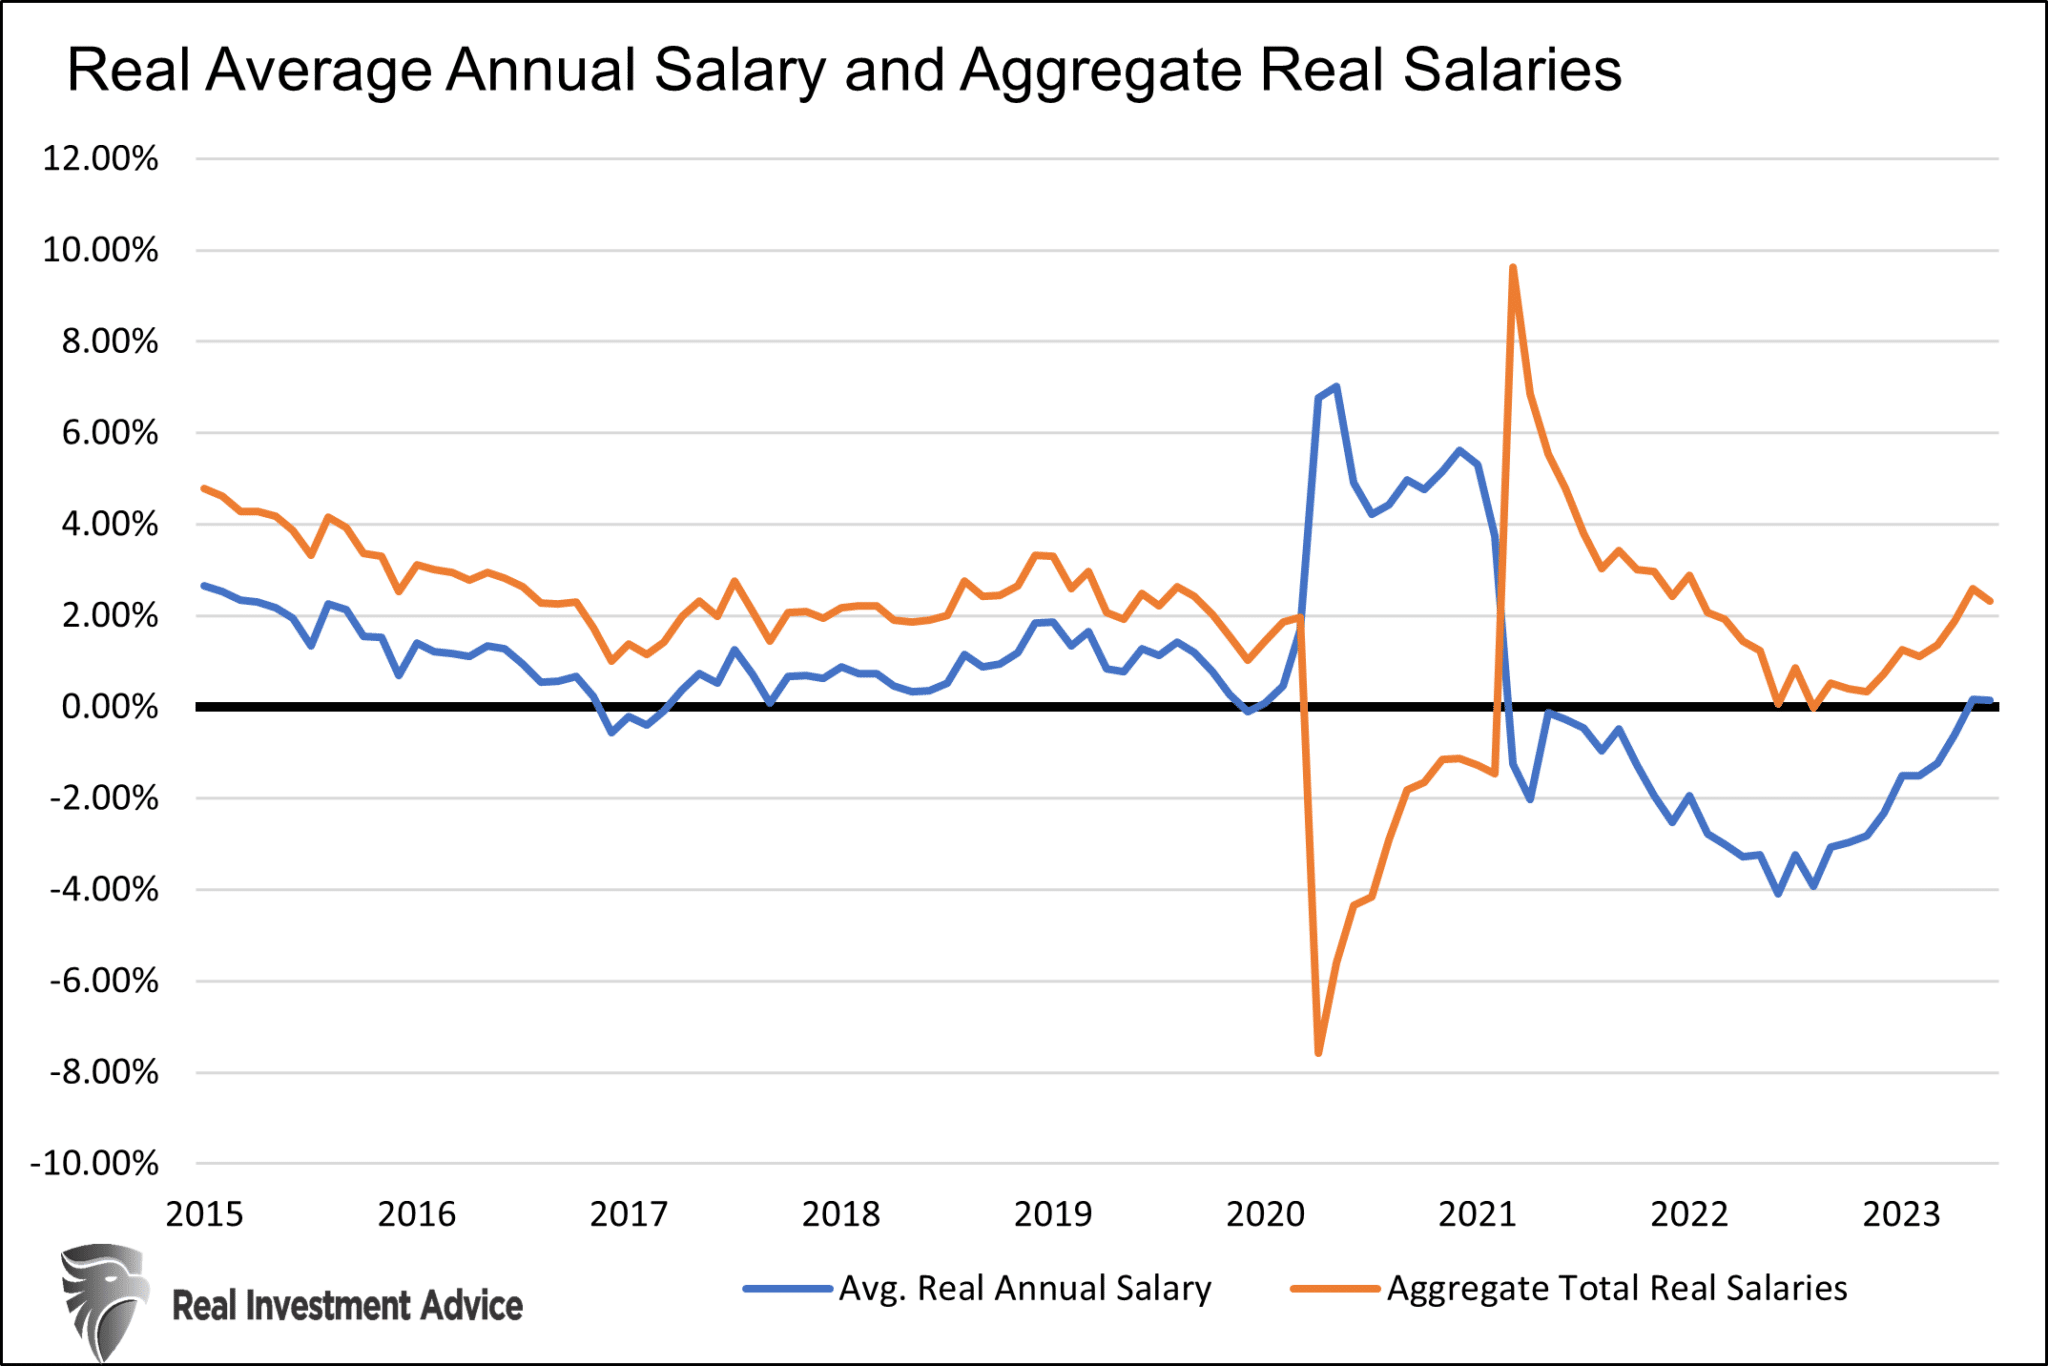
The graphs above tell the story that individuals have primarily used the stimulus-related income from the government to help support their consumption and offset declines in real wages. From a macro perspective, the above-average workforce growth boosted real growth in aggregate wages, which also helped propel the economy. However, with the unemployment rate hovering near 50-year lows, further outsized gains in employment will prove tricky.
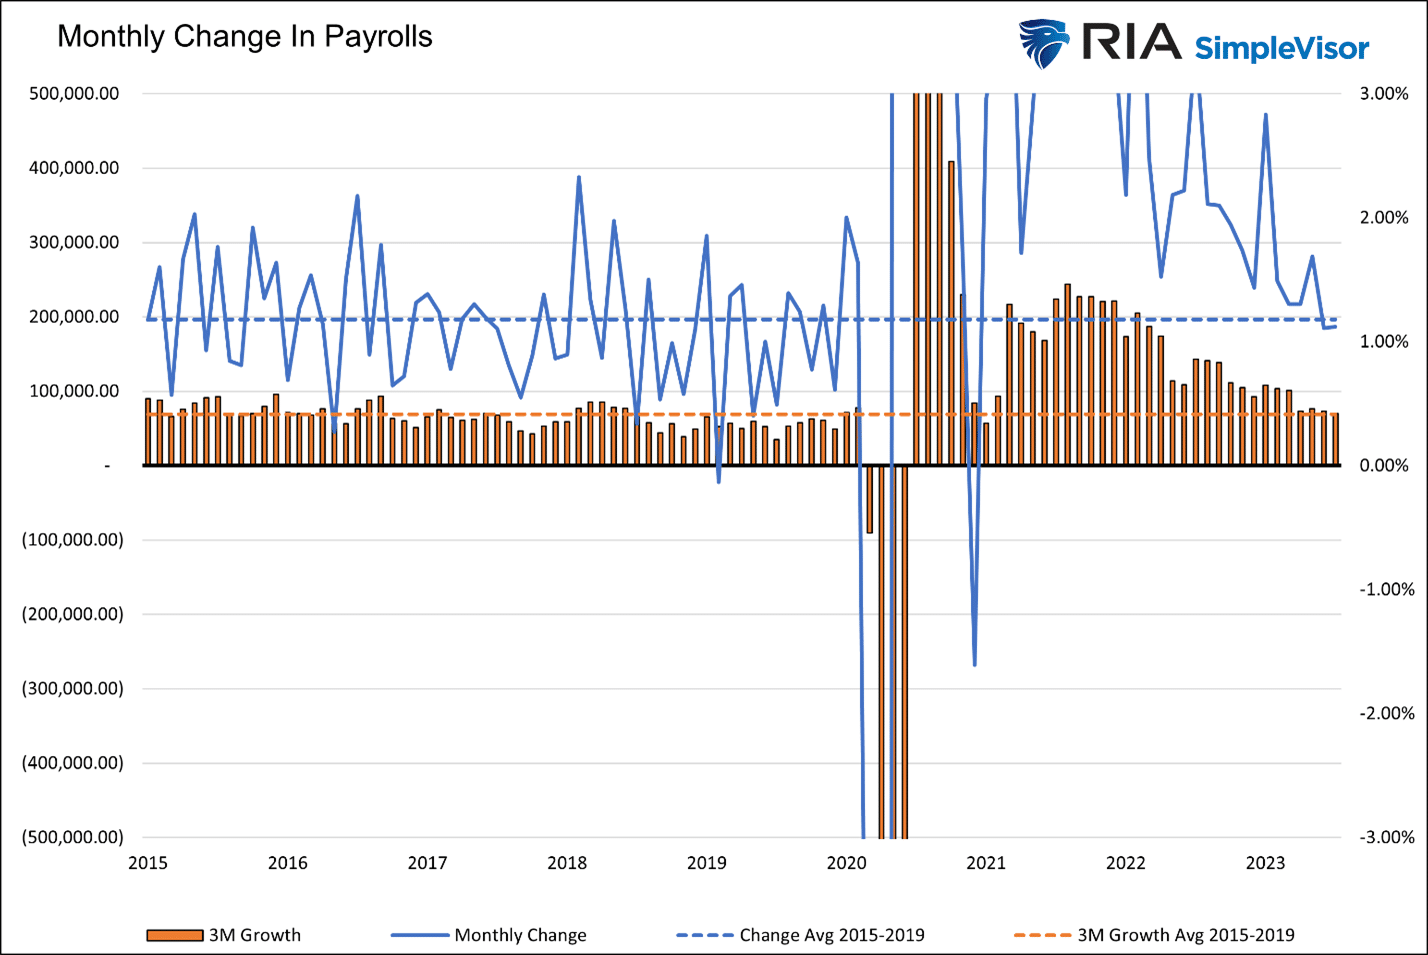
In fact, as we share below, monthly gains in employment are now back to pre-pandemic trends.
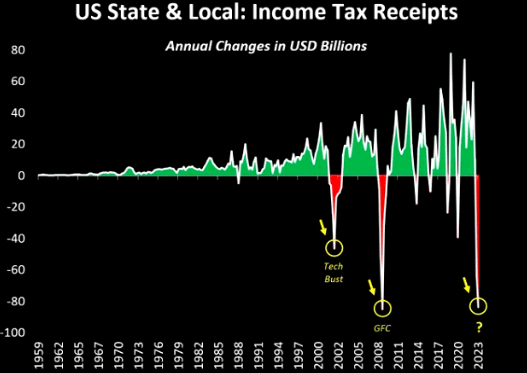
We leave this section with a confounding graph. Why are tax receipts declining if payroll and wage growth are strong and markets robust? Might it be that lower-paying jobs in the leisure and hospitality industries are replacing higher-paying jobs?

Savings and Debt Fueled Consumption
When consumers received stimulus payments, their ability to consume was limited. Supply chain problems, inventory shortages and mandated and self-imposed restrictions, and behavior changes due to the pandemic meant much of the stimulus money was initially saved.
The following graph shows the jump in savings commensurate with stimulus. The chart highlights that consumers saved less than average after the two giant government stimulus checks were distributed and drew down on elevated savings to consume. However, and this is important, cumulative personal savings are now below the longer-term trend.
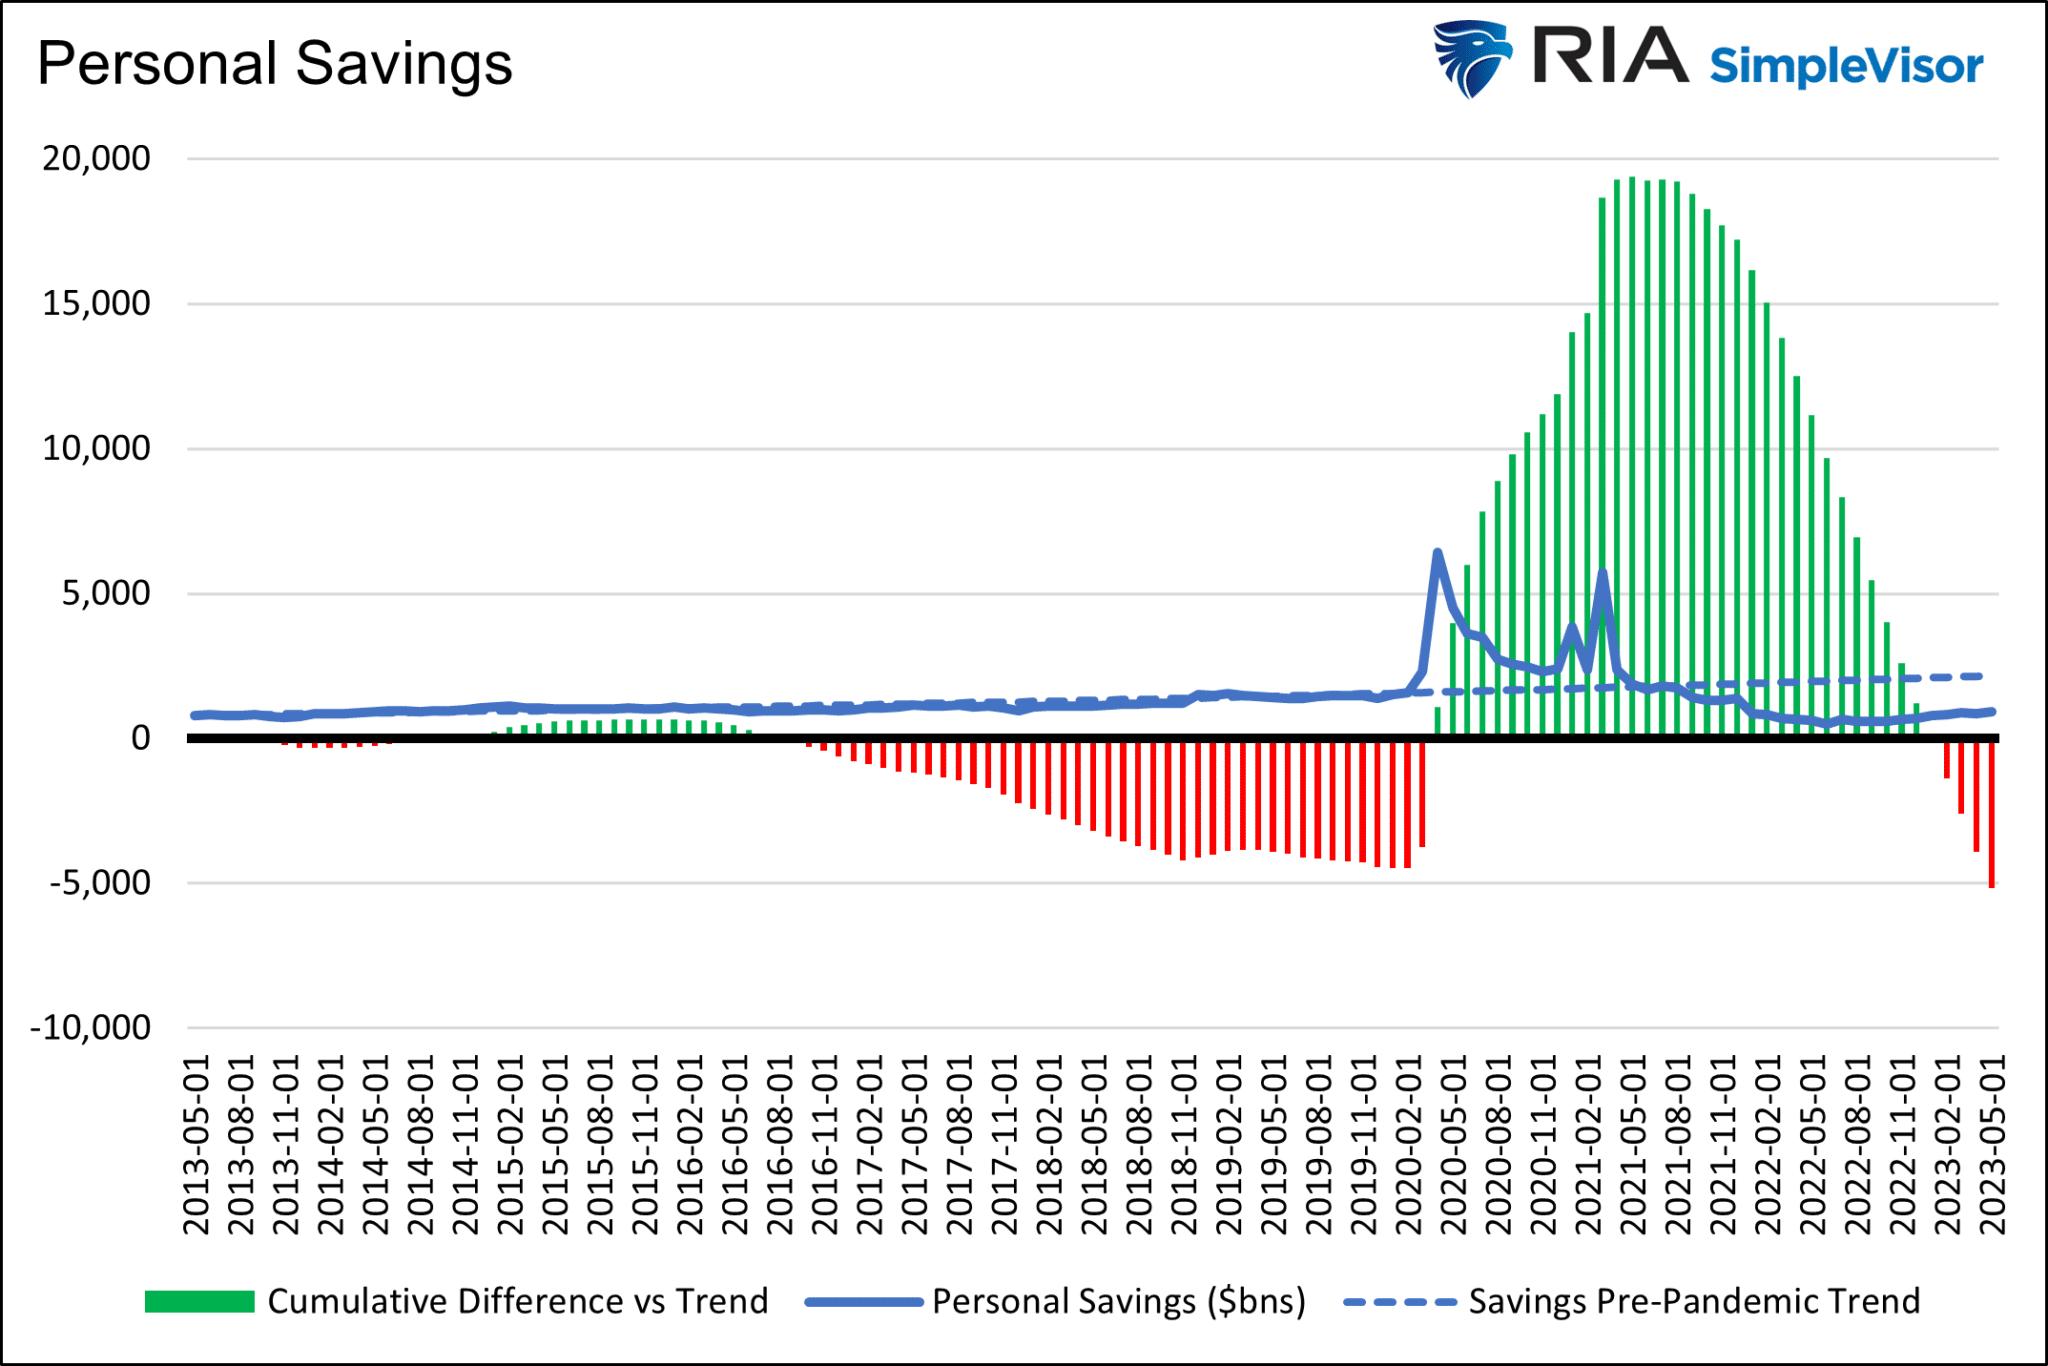
The bottom line is that consumers saved less and have largely drawn down the stimulus-related excess savings. It appears that savings drawdowns in aggregate will no longer contribute to above-trend consumption.
However, with dwindling savings, consumers have resorted to debt to supplement their purchasing power. The graph below shows the sharp increase in credit card debt outstanding.
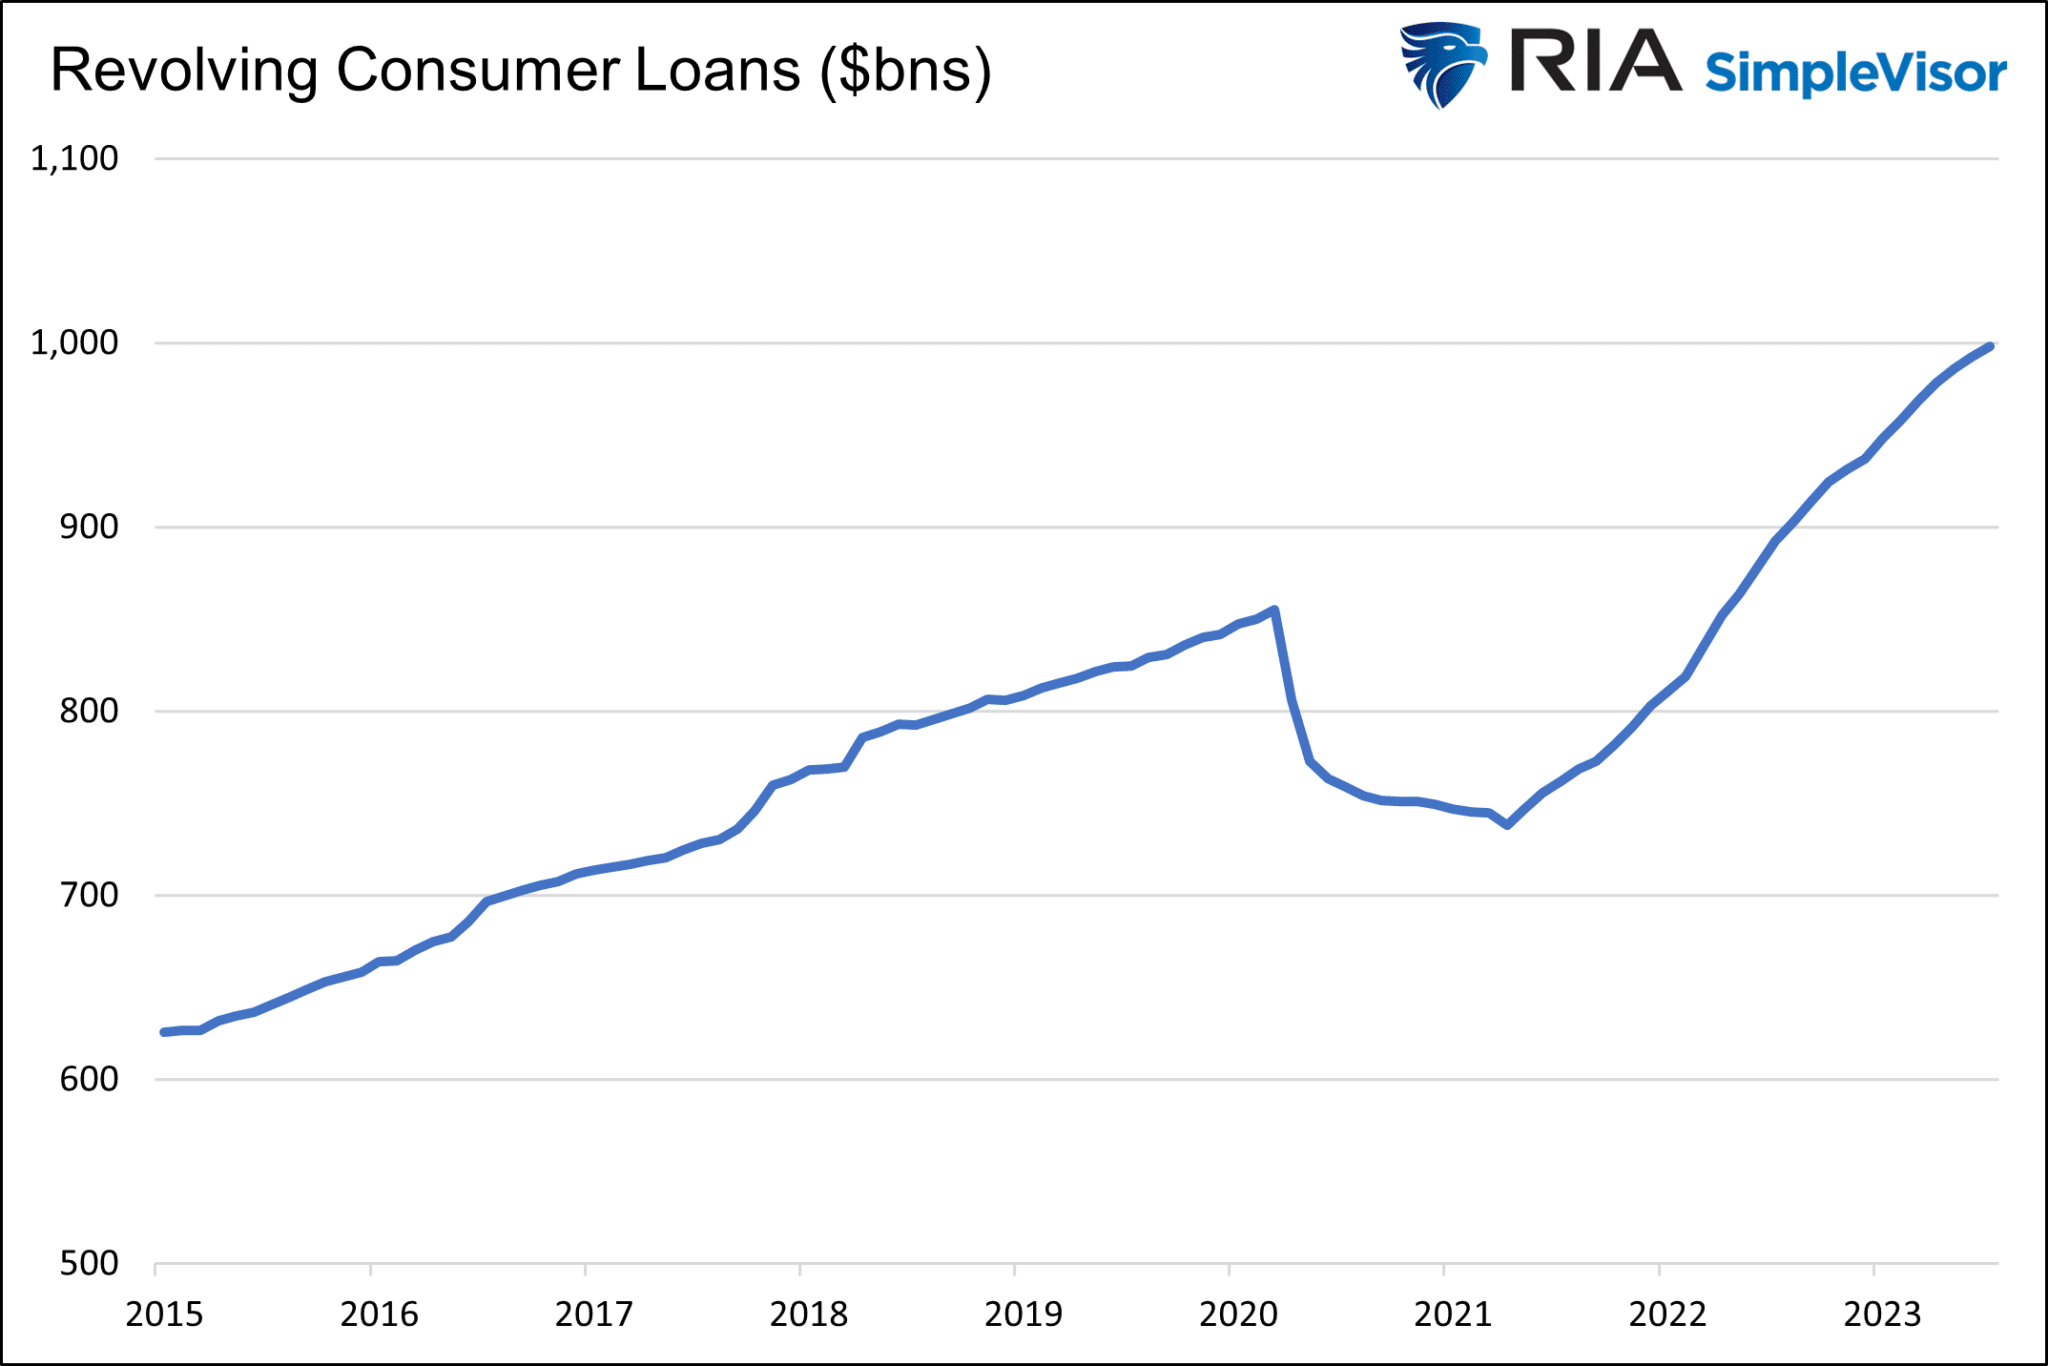
Such growth, led by debt and savings reductions, is not sustainable. The recent Fed SLOOS survey (Senior Loan Officer Opinion Survey) showed that demand for credit continues to weaken. And at the same time, banks are tightening their lending standards. Banks are less likely to extend credit card lines or bump up credit limits. Also, credit card borrowing rates are now over 20%, which means those not paying their balances in full will spend more on interest and, therefore, have less for goods and services.
As we finished this article, we learned that revolving credit fell in June for the first time since March 2021. One data point doesn’t make a trend, but it bears watching!
Employment and Sentiment
The ability and means to spend are essential, but we would be remiss if we did not discuss the desire to spend. When the economy is strong, and consumers feel confident in their jobs, they tend to spend more than average. Conversely, when friends or colleagues lose their jobs or feel threatened with losing their job, confidence wanes, and saving, not spending, takes precedence.
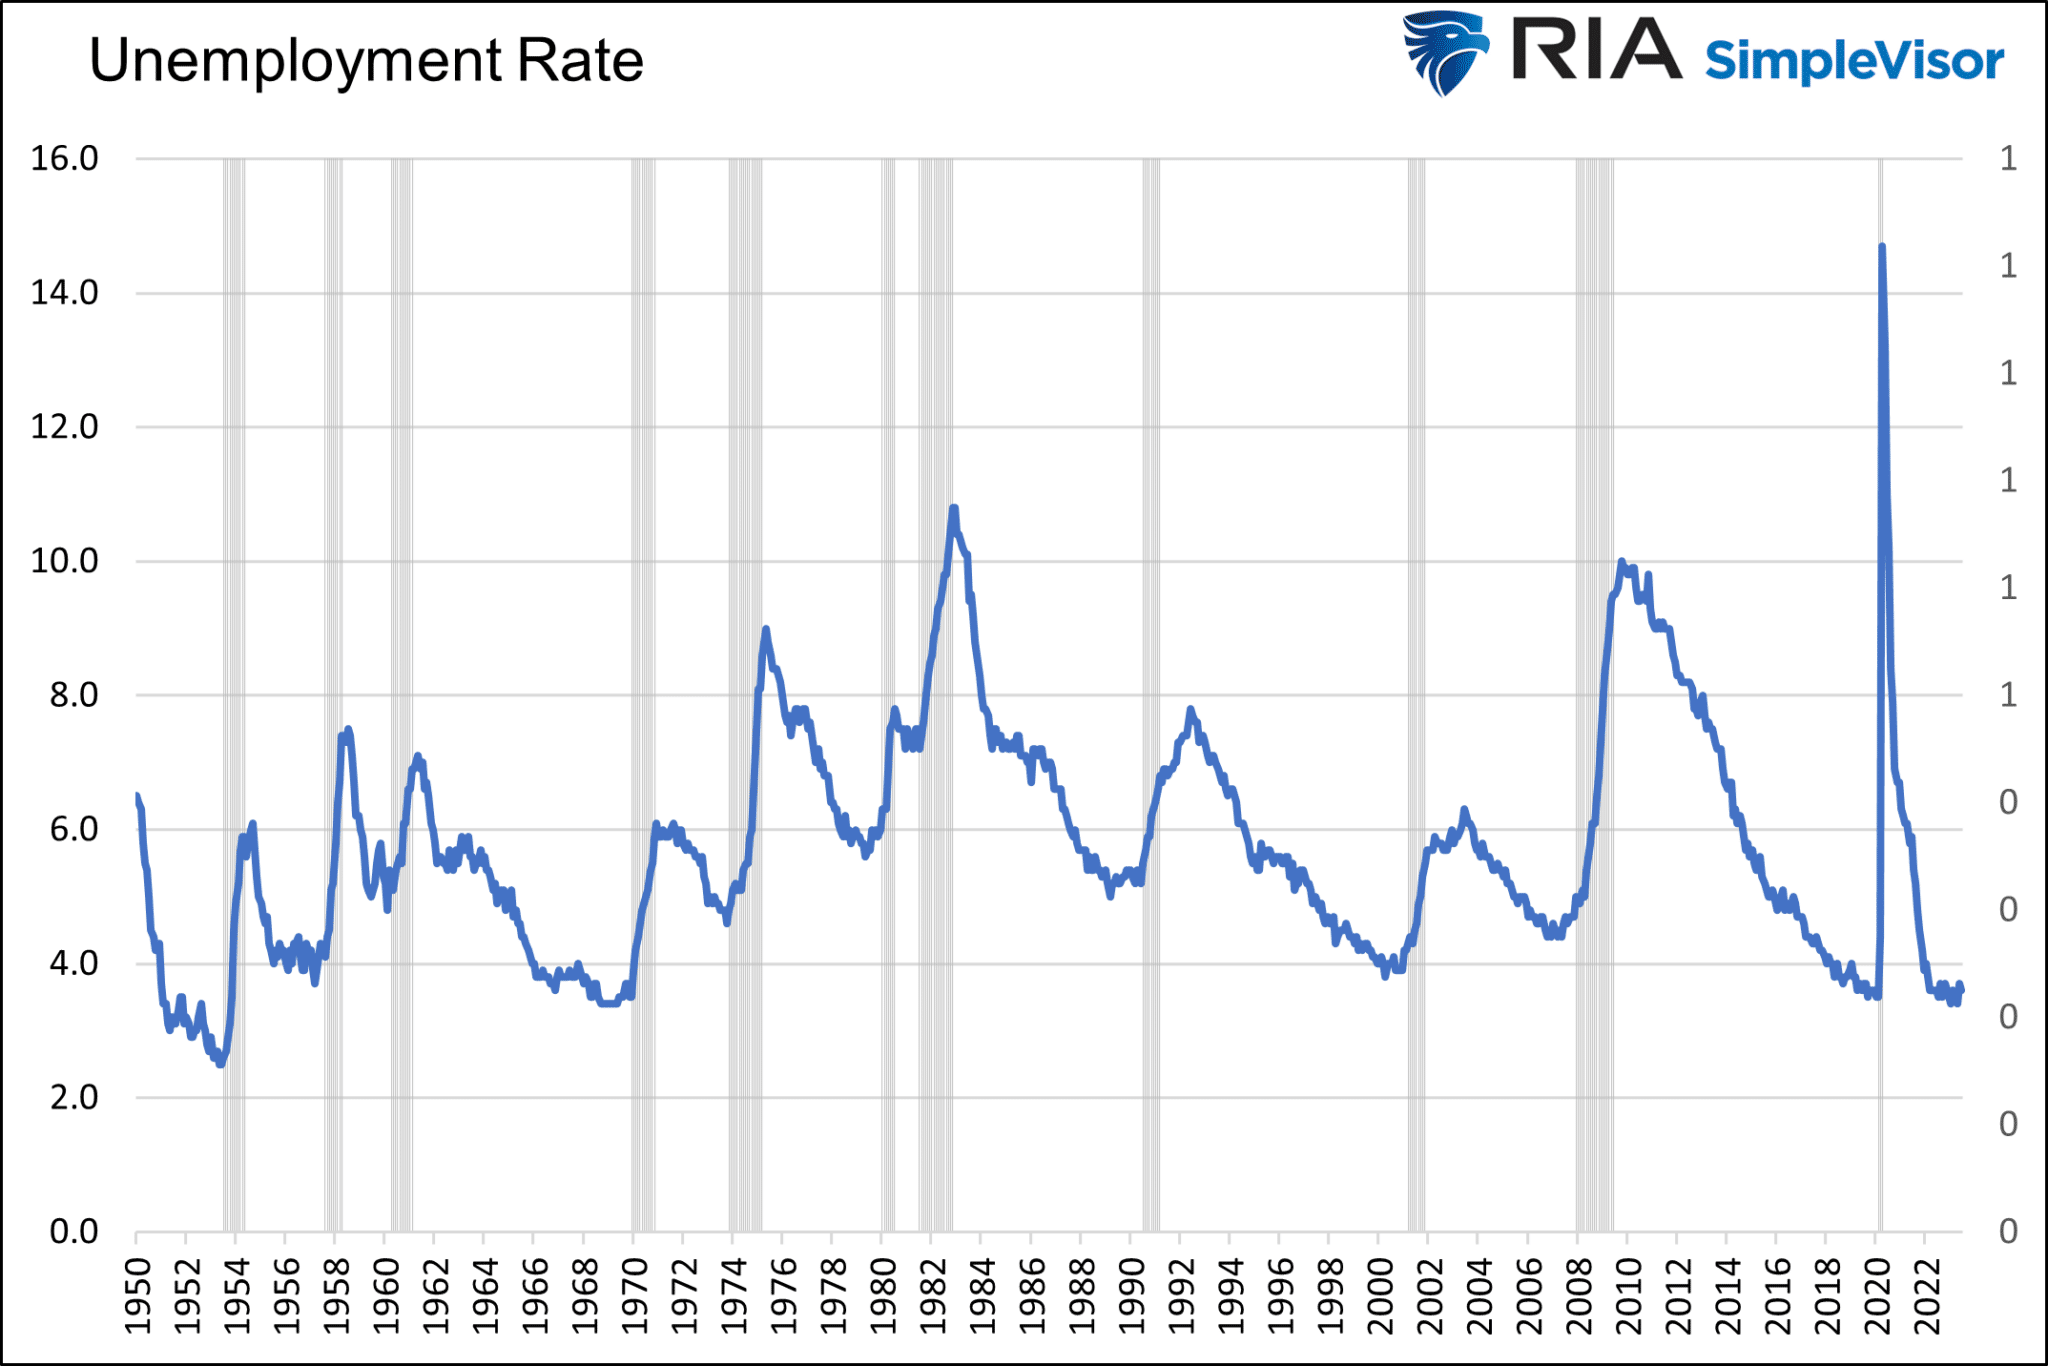
The unemployment rate graph below may be the most important economic indicator. Unfortunately, it’s not predictive. It often doesn’t start rising until a month or two before the start of a recession.
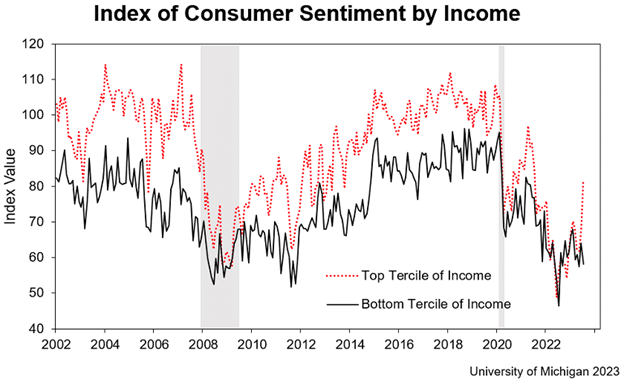
The following graph, courtesy of the University of Michigan Consumer Survey, shows that a considerable divergence in sentiment is emerging between the haves and have-nots. It may likely be that the stock market gains are bolstering the wealthy, allowing them to spend more than they would otherwise. However, sentiment remains poor for most consumers with minimal stock holdings.
Summary
The fumes of pandemic stimulus and related personal consumption continue to keep the economy running strong despite the increasing headwind of high-interest rates.
The question we must now ponder based on the material we present is whether economic and consumption trends revert to their natural growth trends or do the increasing headwinds of high-interest rates cause below-trend or negative personal consumption.
We think the labor market will be the key to answering that question. If the labor markets remain healthy, we will likely see consumption and economic trends revert to pre-pandemic norms.
If, however, higher interest rates and credit contraction weigh on the economy, as they always have, consumers will likely want to bolster their savings and pay down their debt at the expense of consumption. Timing such a potential slowdown or recession is very difficult given the last few years’ large financial and behavioral imbalances haven’t entirely worked their way out of the system.


Michael Lebowitz, CFA is an Investment Analyst and Portfolio Manager for RIA Advisors. specializing in macroeconomic research, valuations, asset allocation, and risk management. RIA Contributing Editor and Research Director. CFA is an Investment Analyst and Portfolio Manager; Co-founder of 720 Global Research.
Follow Michael on Twitter or go to 720global.com for more research and analysis.
Customer Relationship Summary (Form CRS)
Also Read


